Console Overview
The N|Solid Console provides valuable insight into clusters of N|Solid processes running in a variety of configurations. Processes are grouped by their associated application, making it simple to find outliers in memory and CPU utilization.
Navigating to an individual process shows various metrics, and provides the ability to take heap snapshots and generate CPU profiles.
Applications Overview
Once a user launched the N|Solid Console and connected their processes to the console, users will now land on the console’s overview screen.
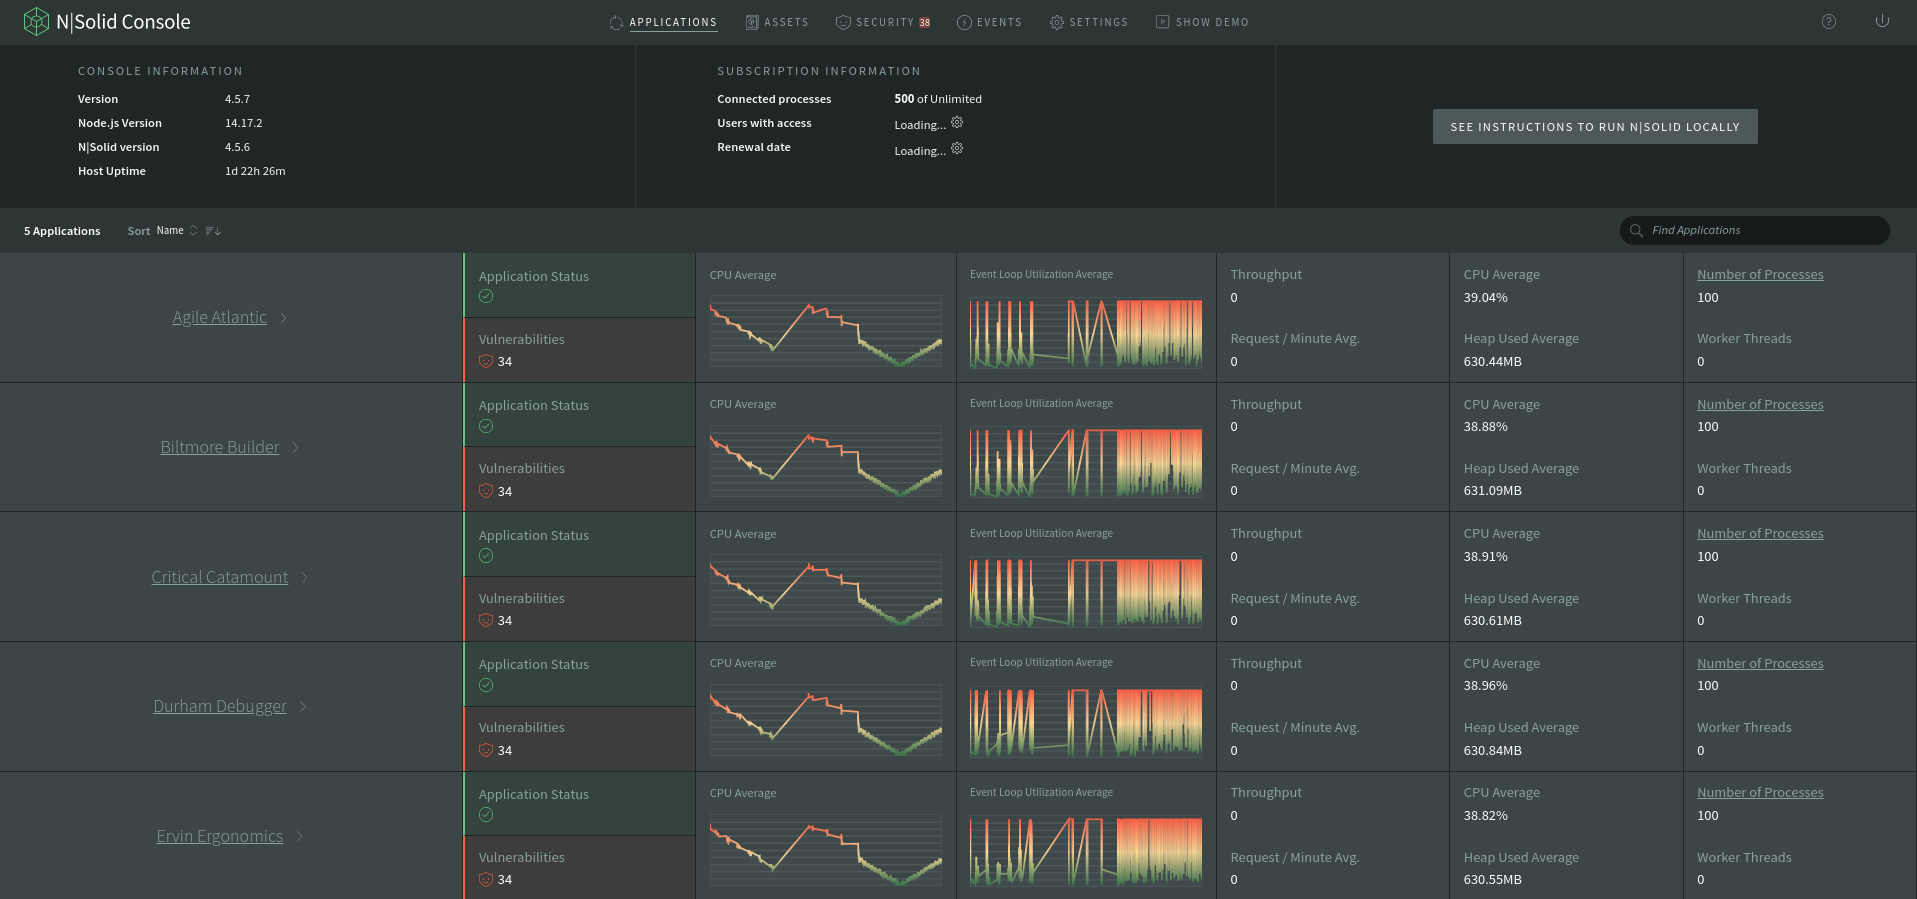
This screen delivers aggregated application metrics, including:
- Process Count
- Number of Vulnerabilities
- Application's status
- CPU utilization average
- Event loop utilization average
- Requests average
- Throughput
- Heap Used average
- Number of Worker Threads.
This list can be filtered and sorted by name, number of processes and number of vulnerabilities.
When selecting a specific application by clicking the application's name, users are redirected to the Application Summary.
When Number of Processes is clicked, users are redirected to the scatterplot filtered by the selected application name.
Application Summary
This screen delivers key information of the selected application including metrics, the number of vulnerabilities, number of processes, number of Worker Threads, number of events, and the application's status itself.
More insightful application information is presented in this view, with a fully dedicated metrics view, modules view, assets view, and events view; all this is shown application-wide.
Application metrics summary
In the application metrics summary view, users can a short graphical summary of how the application is behaving.
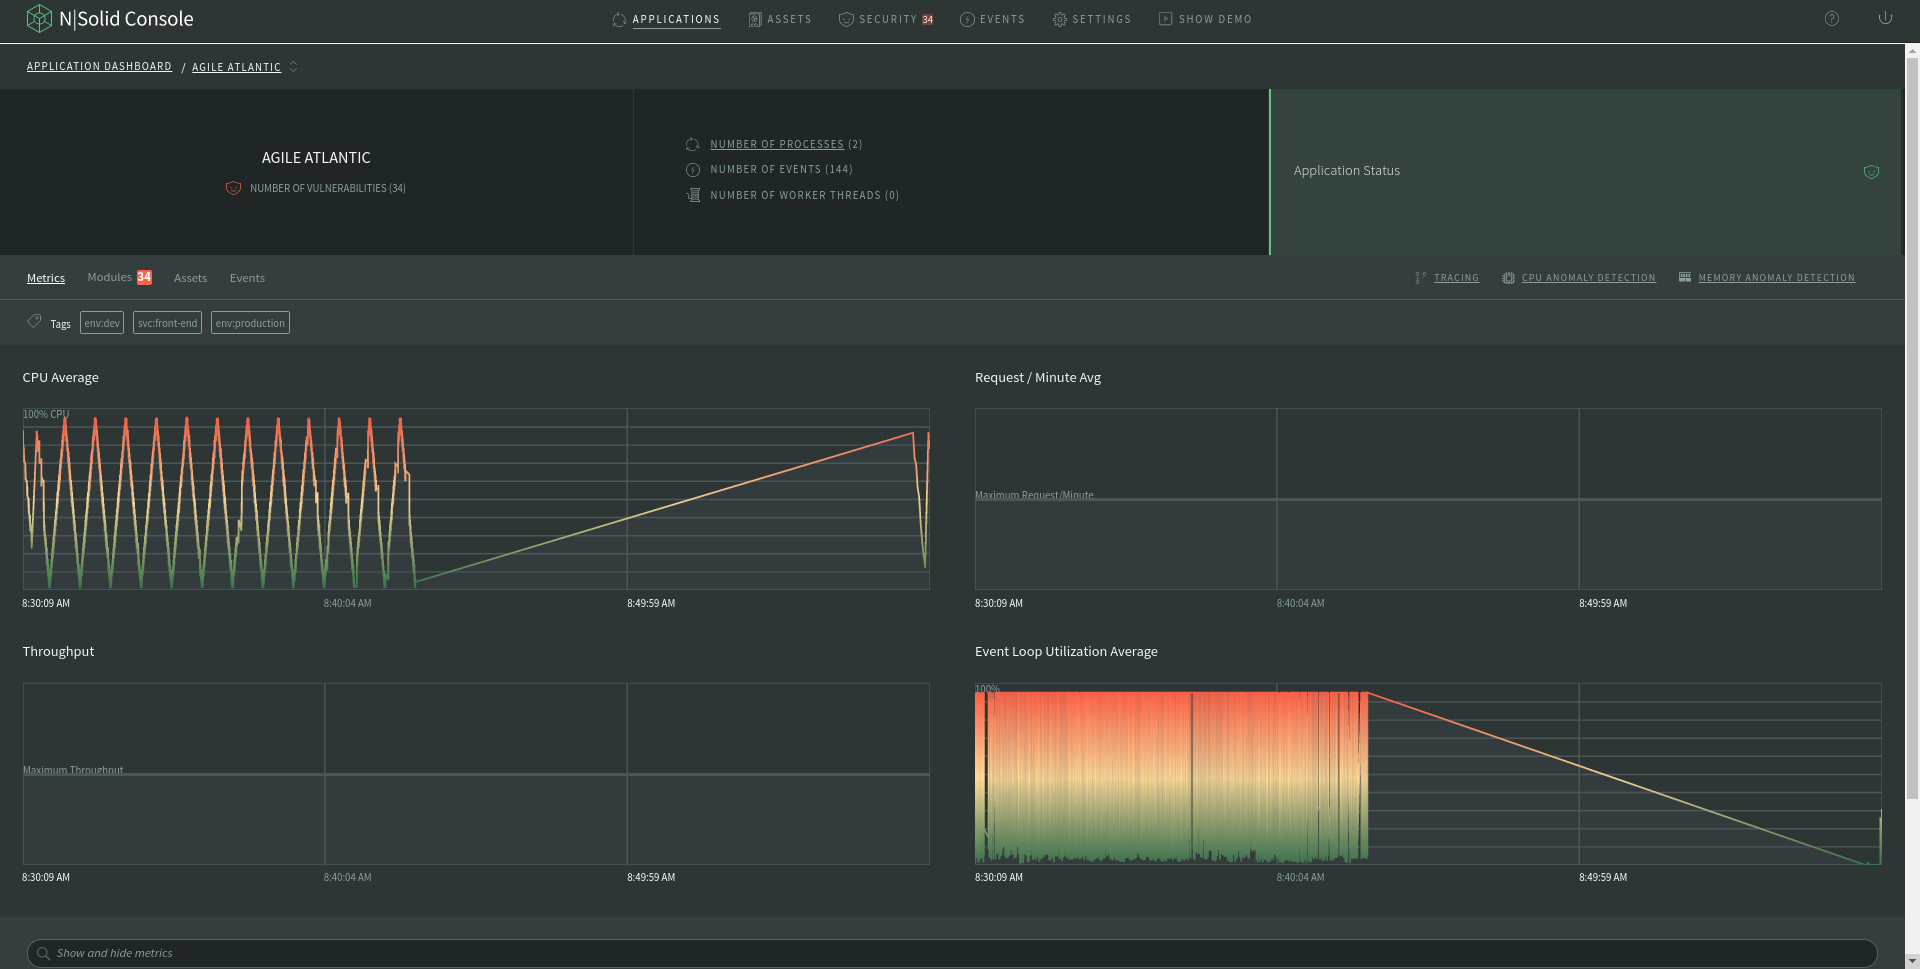
A key feature of the application's metrics view is the power of filtering the average of the metrics to processes with tags, users can select and unselect filters by their necessities and the graphs will be updated with processes with the desired tags.
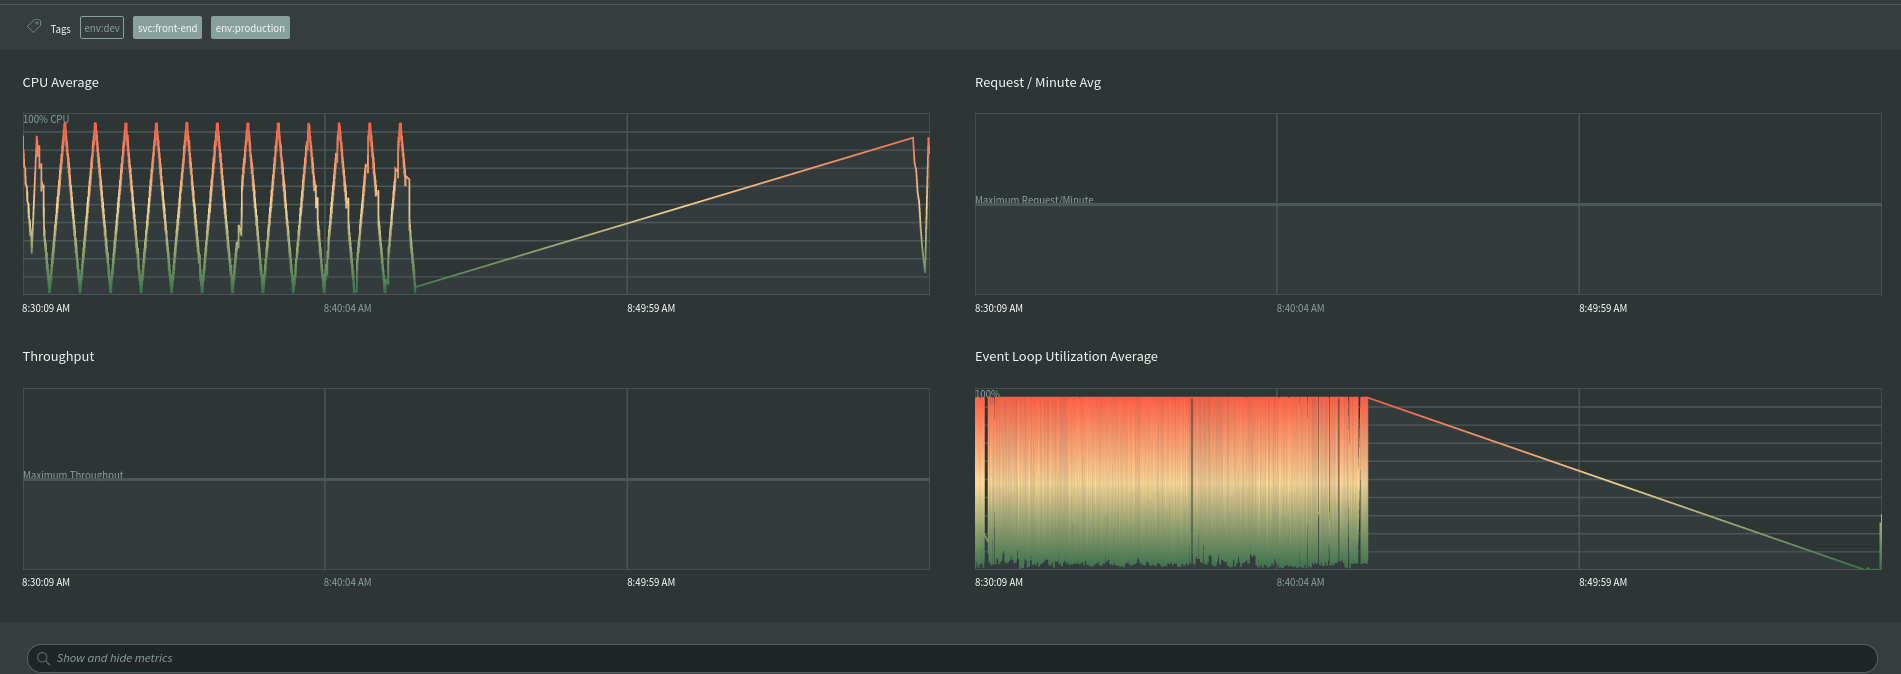
Users are now able to inspect any metric considered insightful per application, those metrics could be numeric or a graph.
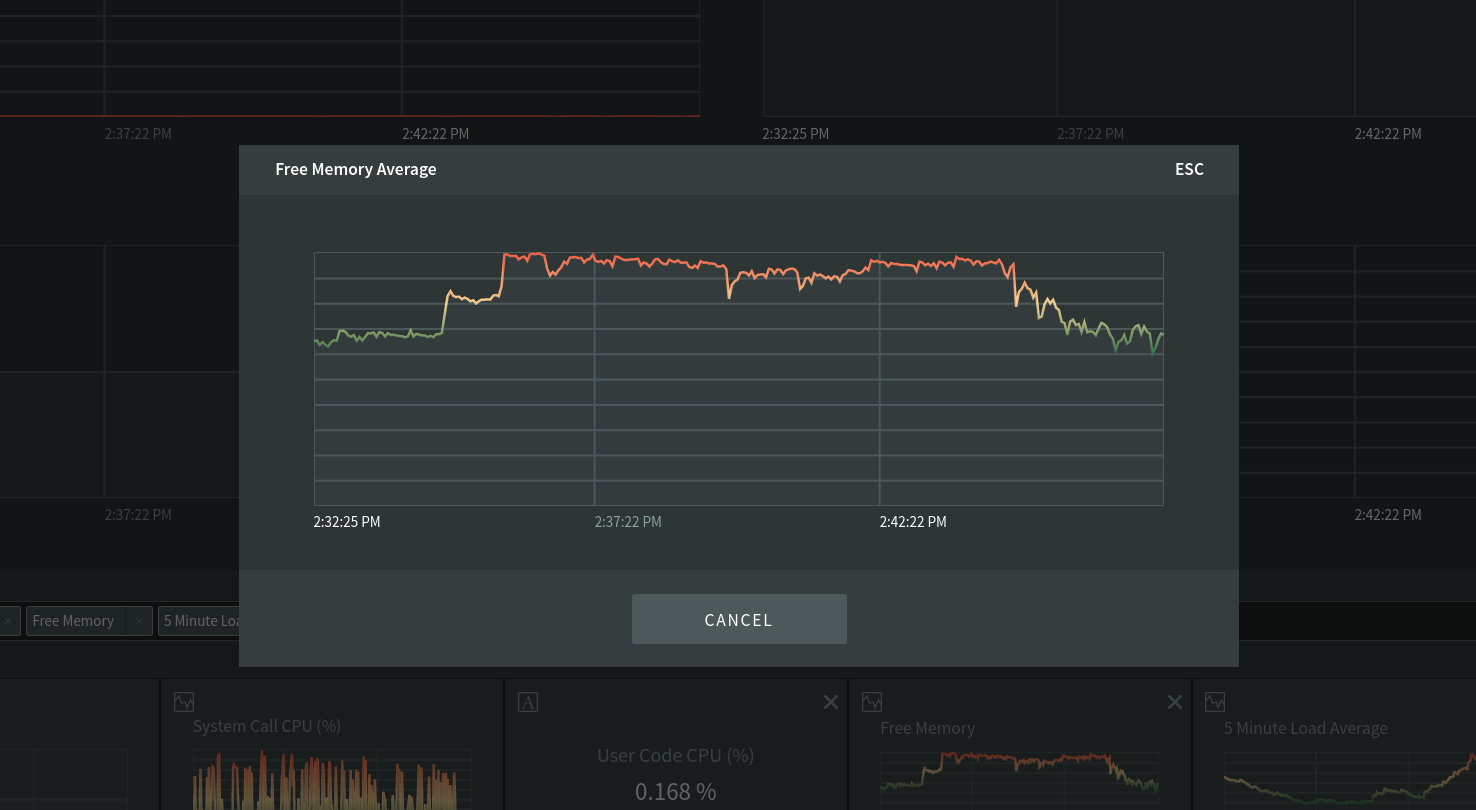
When a metric is clicked, it is zoomed in.
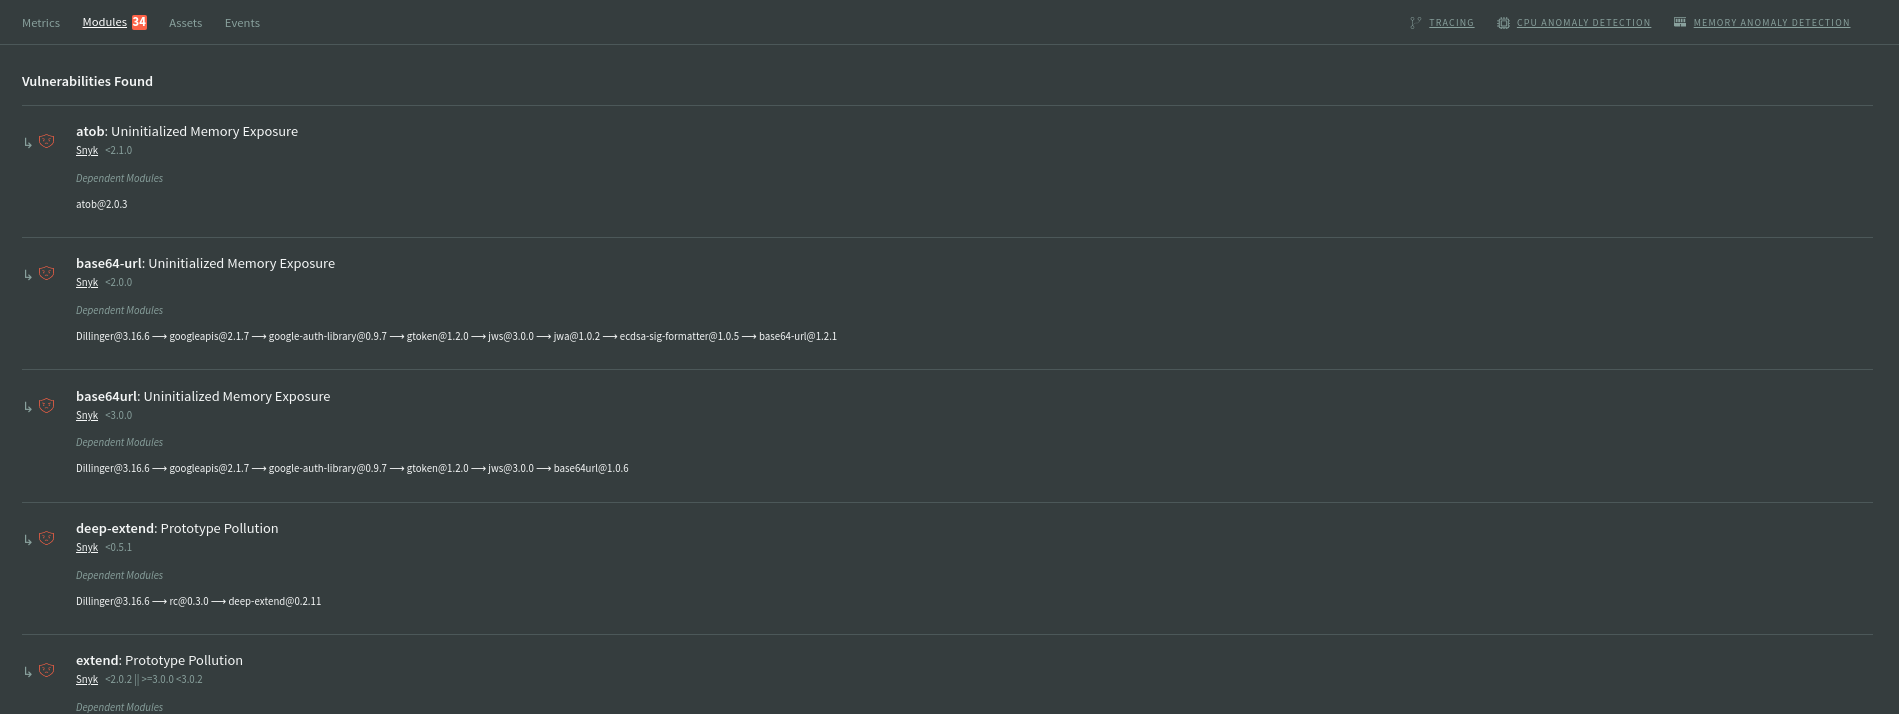
Application modules summary
In the application's modules view, the vulnerabilities are filtered application-wide, users can see the vulnerabilities not just for individual processes but complete applications, that's a better approach to take real advantage of NCM power.
Application assets summary
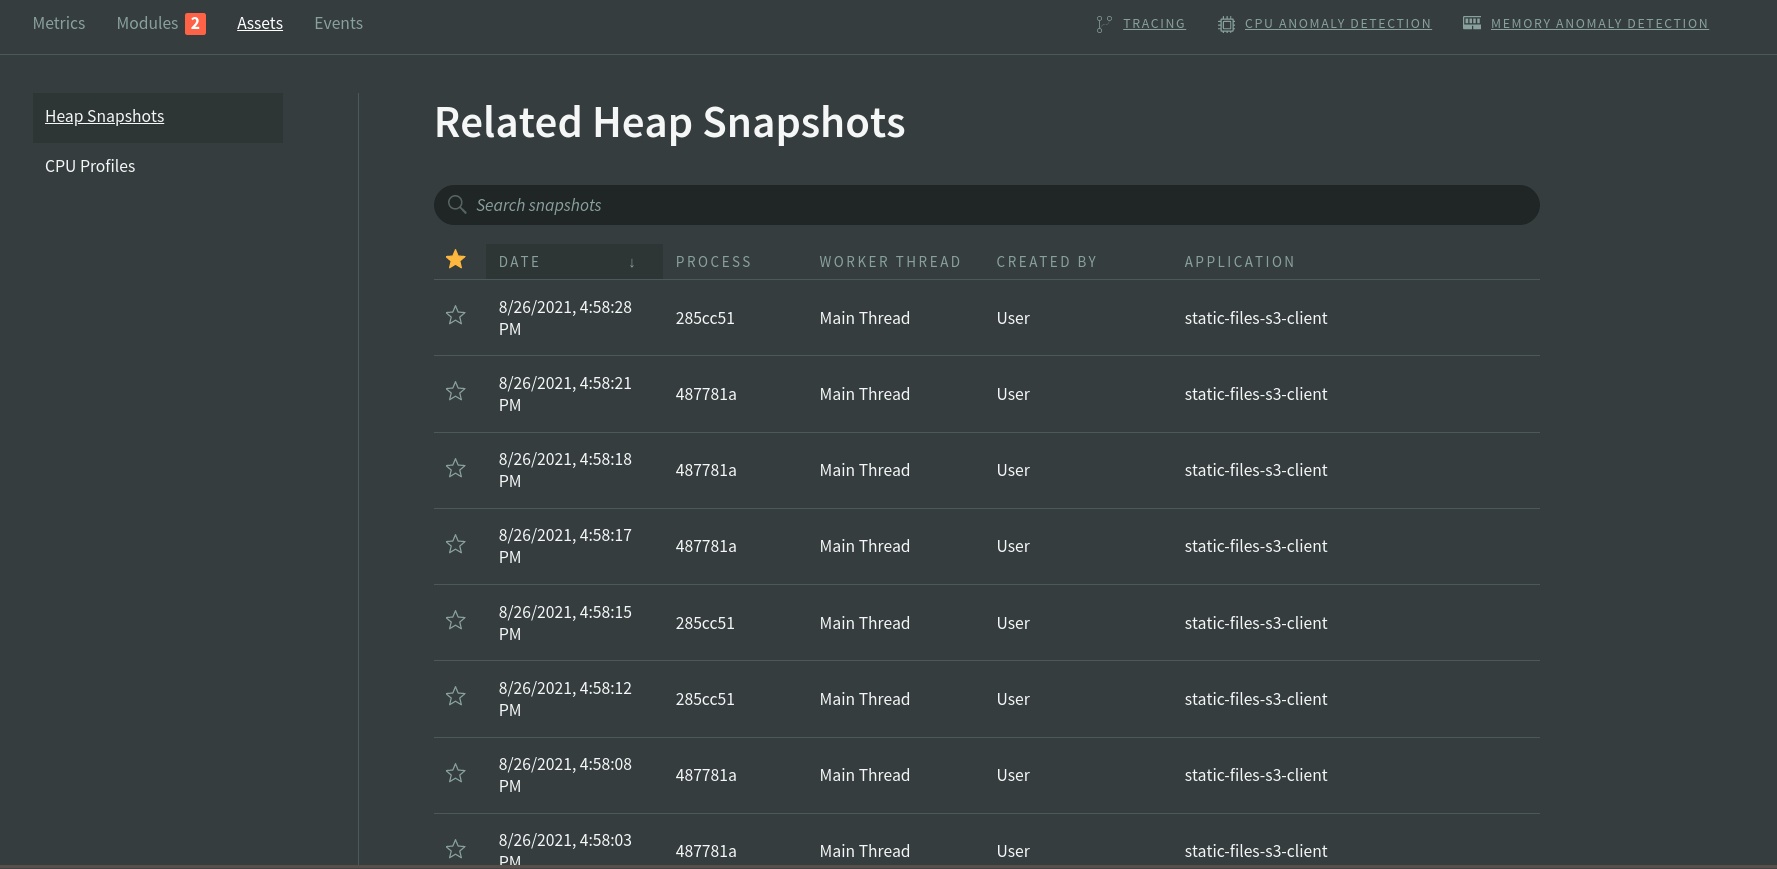
In the application's assets view, all the CPU profiles and Heap Snapshots of the application are listed, this makes it easier for users to diagnose per application not just per process.
Application events summary
In the applications events view, users can see all the runtime events, like security events, lifecycle events, system events, performance events, and assets events.
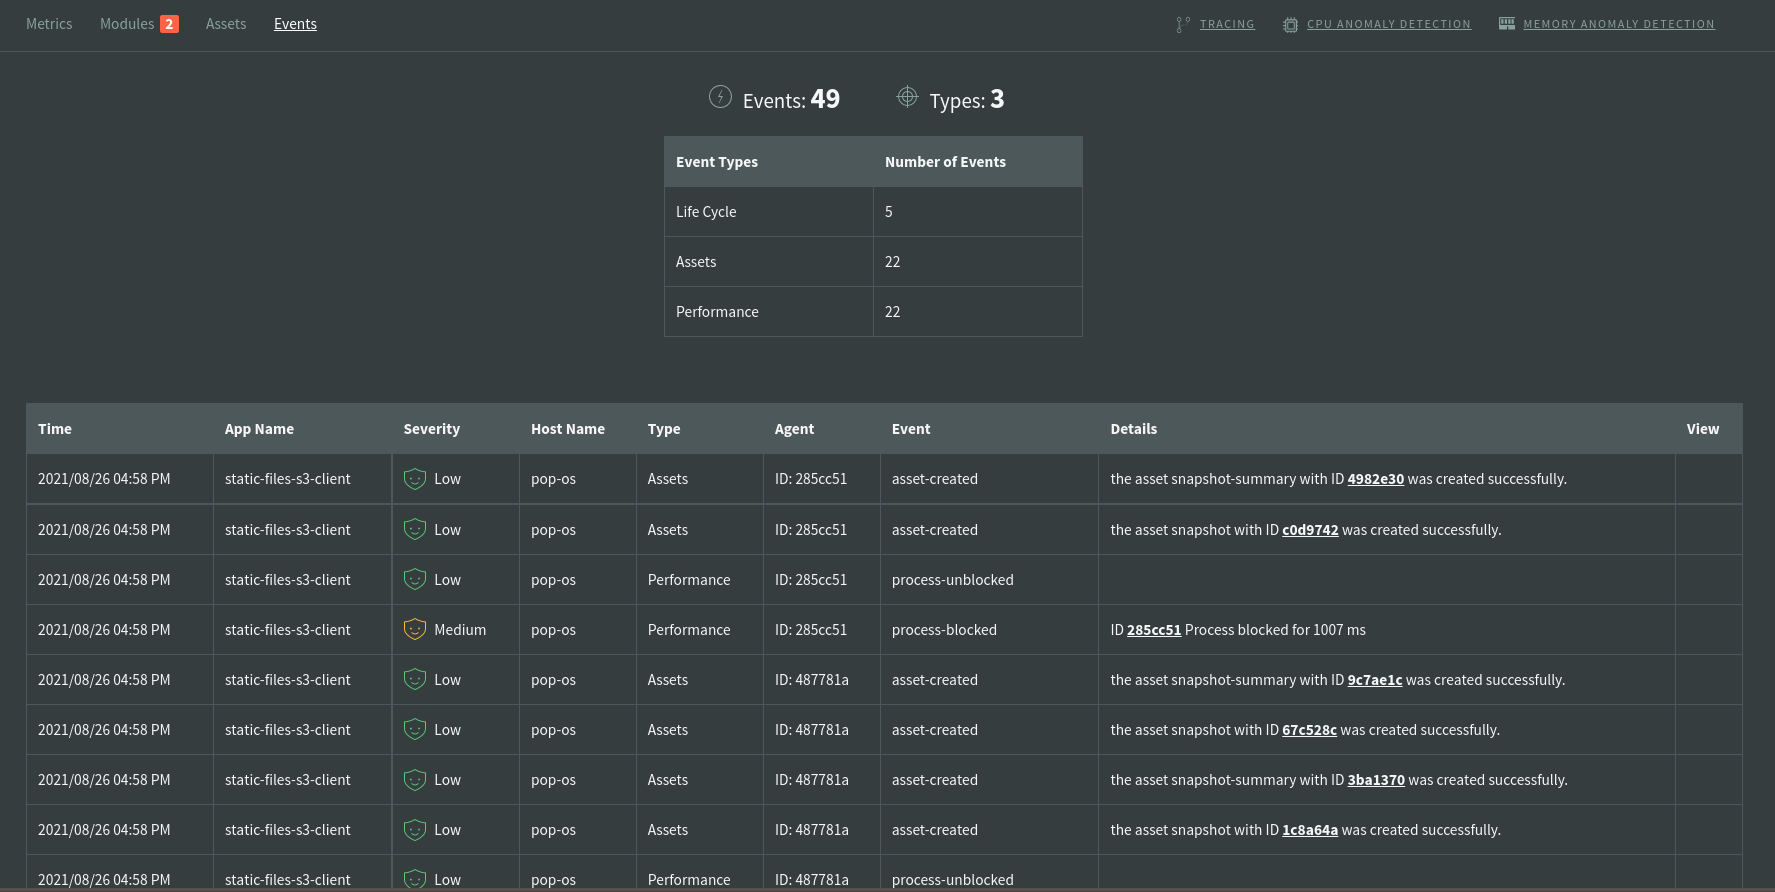
Learn more about event profiling here.
Processes View
The Processes view provides a visual overview of N|Solid applications monitored by the Console. By default, the N|Solid Console will display all processes. Using Filtering and Saved Views, you may filter processes by a wide variety of attributes, e.g. name, tags, performance metrics, etc. Saved views can also be created to group sets of processes together.
| Section | Description |
|---|---|
| View | The View dropdown allows you to navigate between different Saved Views and their respective Scatterplots. See Saved Views for more information on creating and managing Saved Views. The default view is All Processes |
| Filter | The filter allows you to dynamically query for processes or create a new saved view |
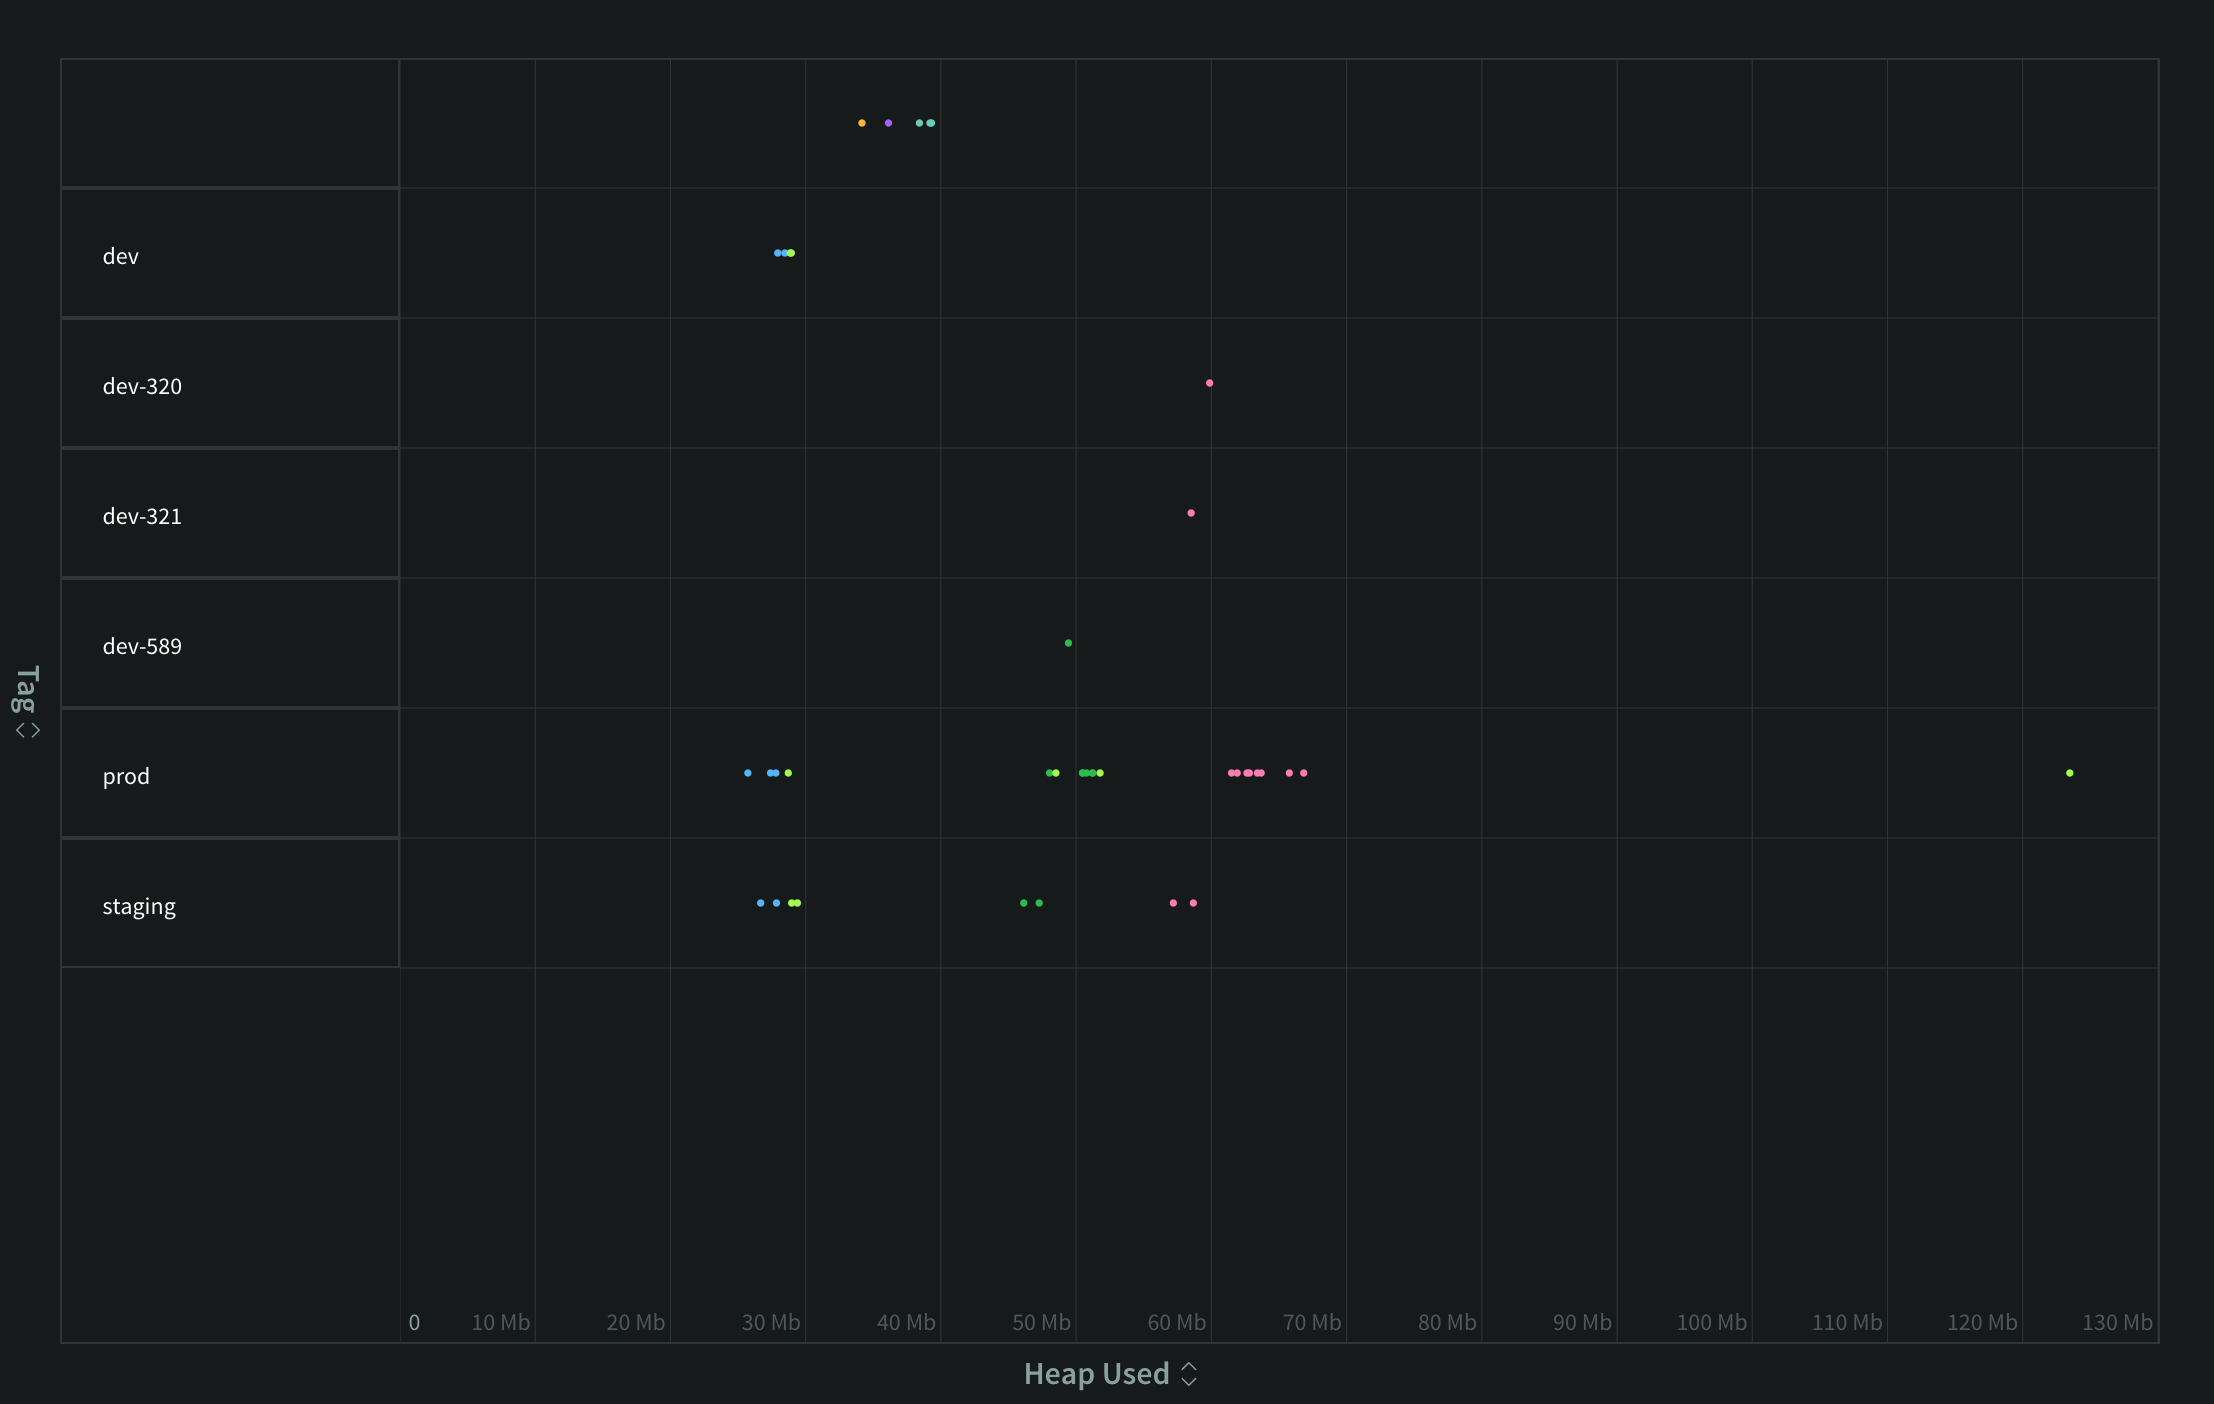
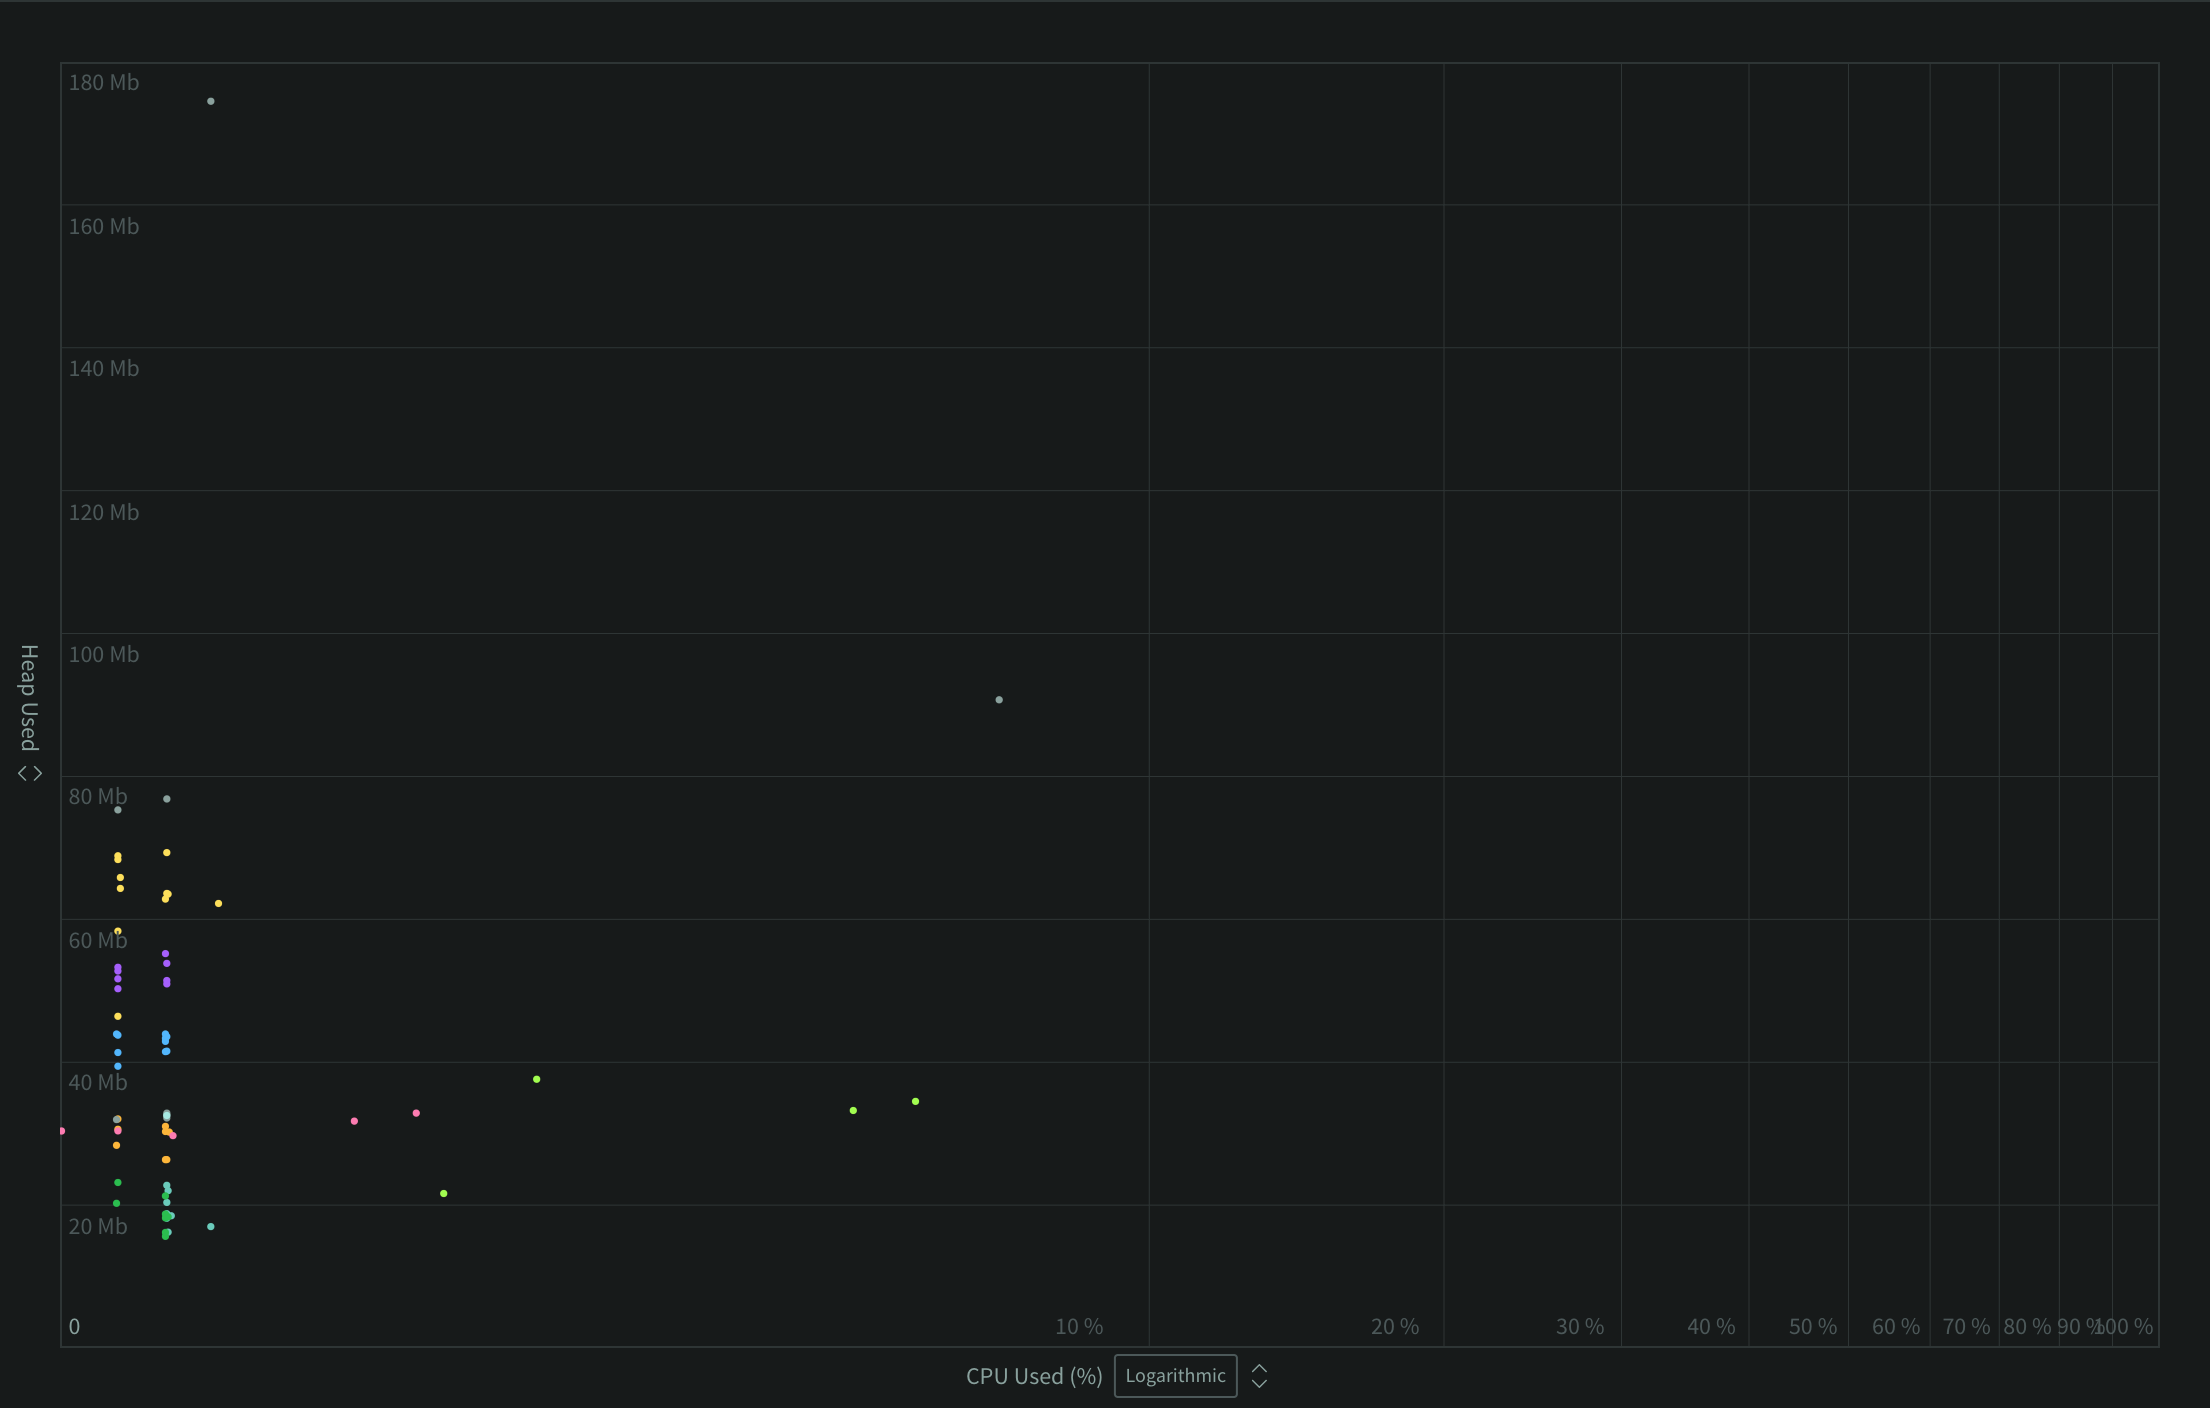
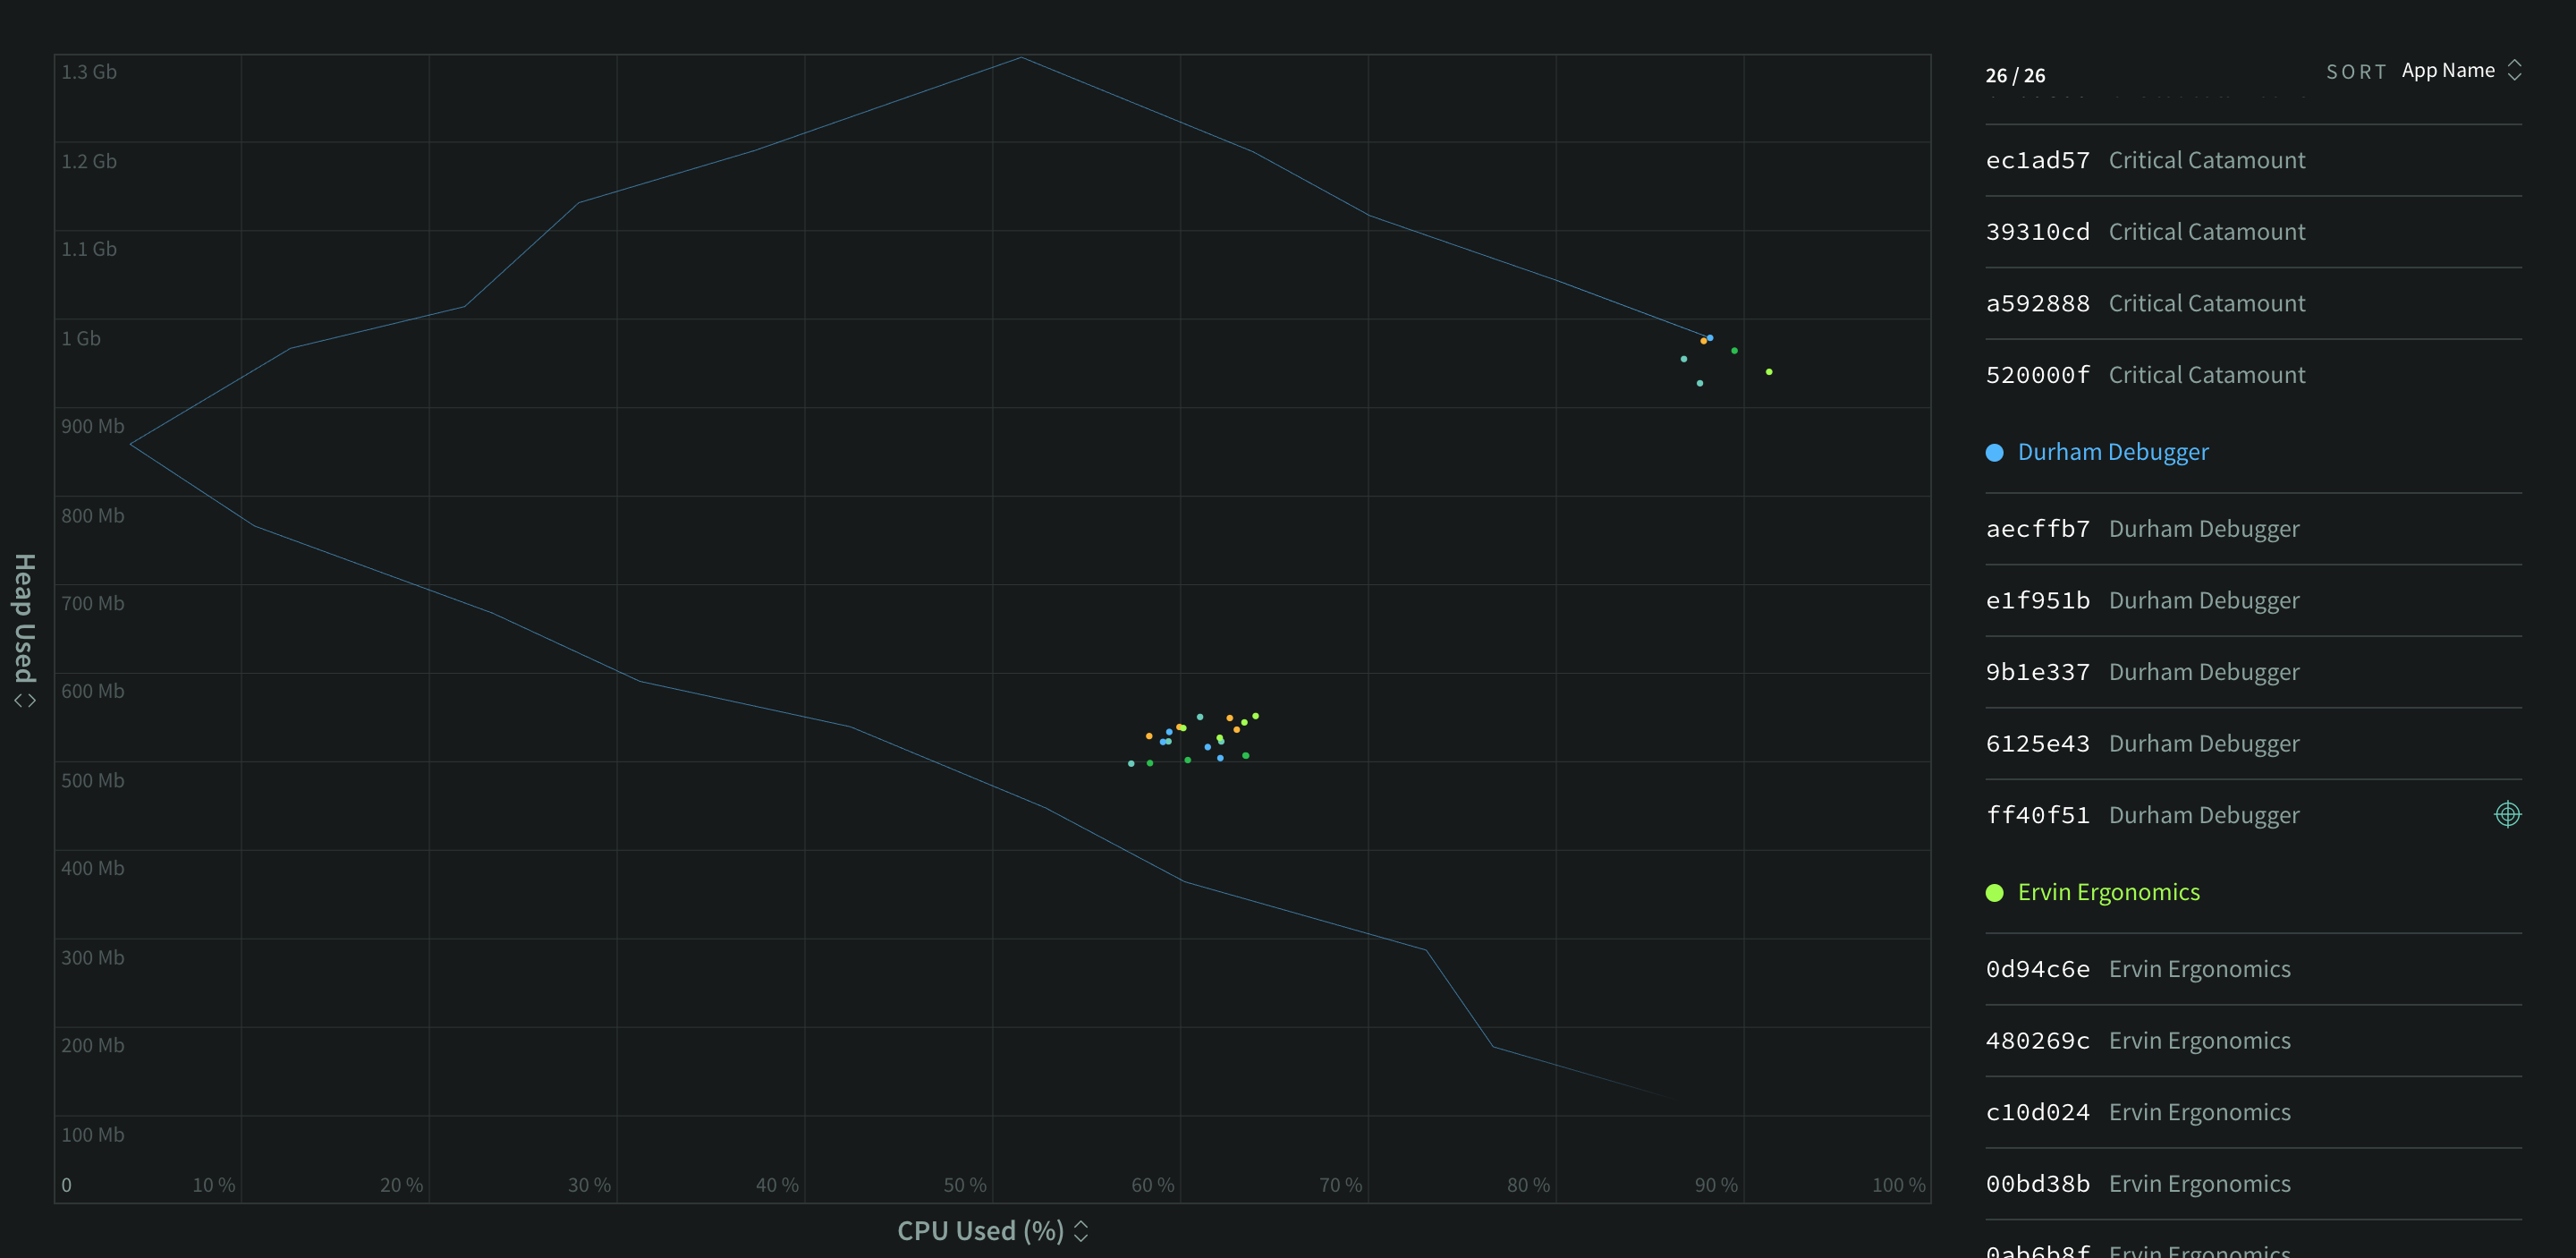
| Scatterplot | The scatterplot is a graph where processes matching the currently-selected saved view will be shown. Graph axes can be configured differently for each saved view, and process dots animate as the values for those attributes change |
| Processes List | The processes list is a textual representation of the processes graphed on the scatterplot |
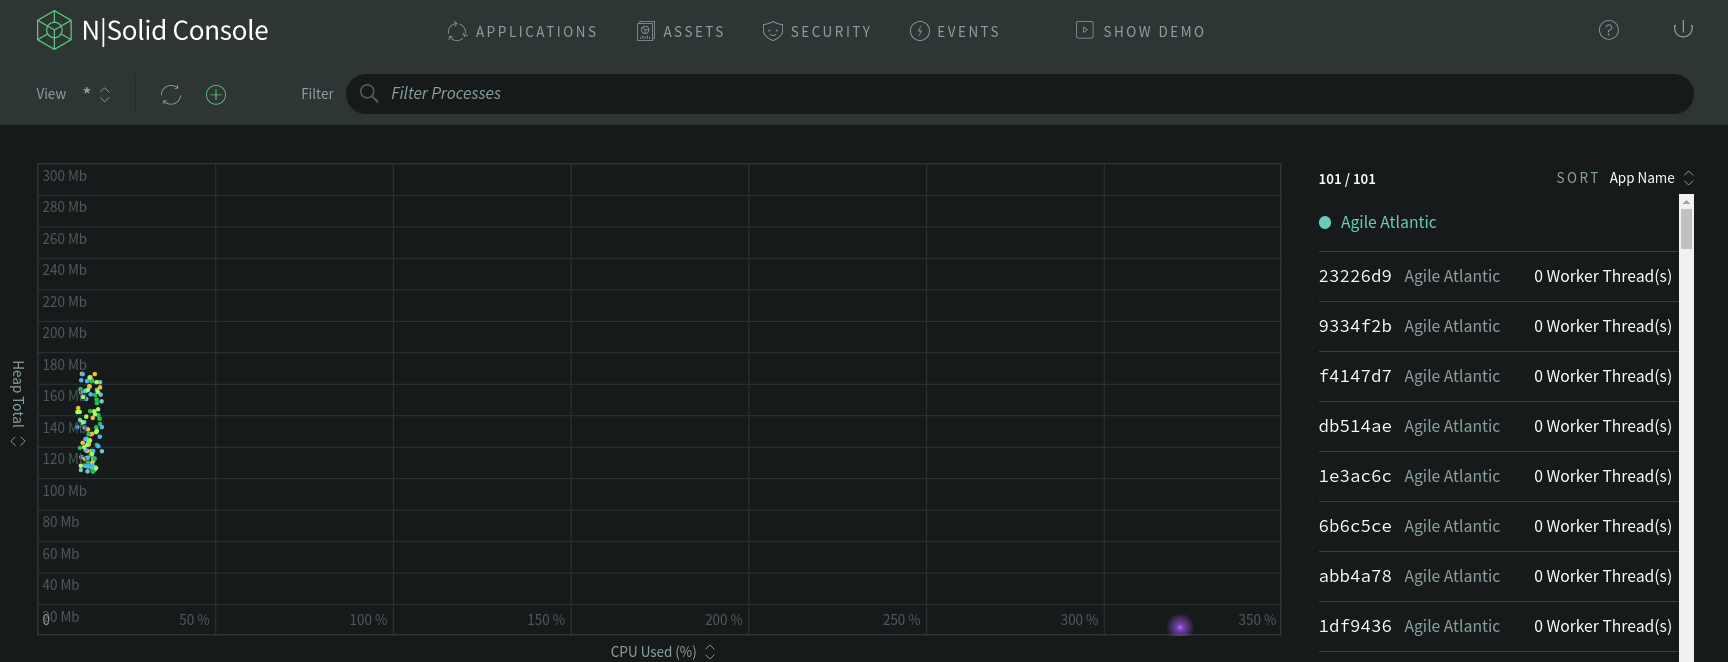
The Scatterplot
The Scatterplot is an animated graph that provides an overview of your applications' performance across all or a subset of connected processes, when an specific process has at least one active worker thread, the process will be highlighted.
Graph Axes Configuration
By default, the Y-axis plots the memory (Heap Used), and the X-axis plots the % CPU utilized for each process. You can configure these axes to measure different parameters.
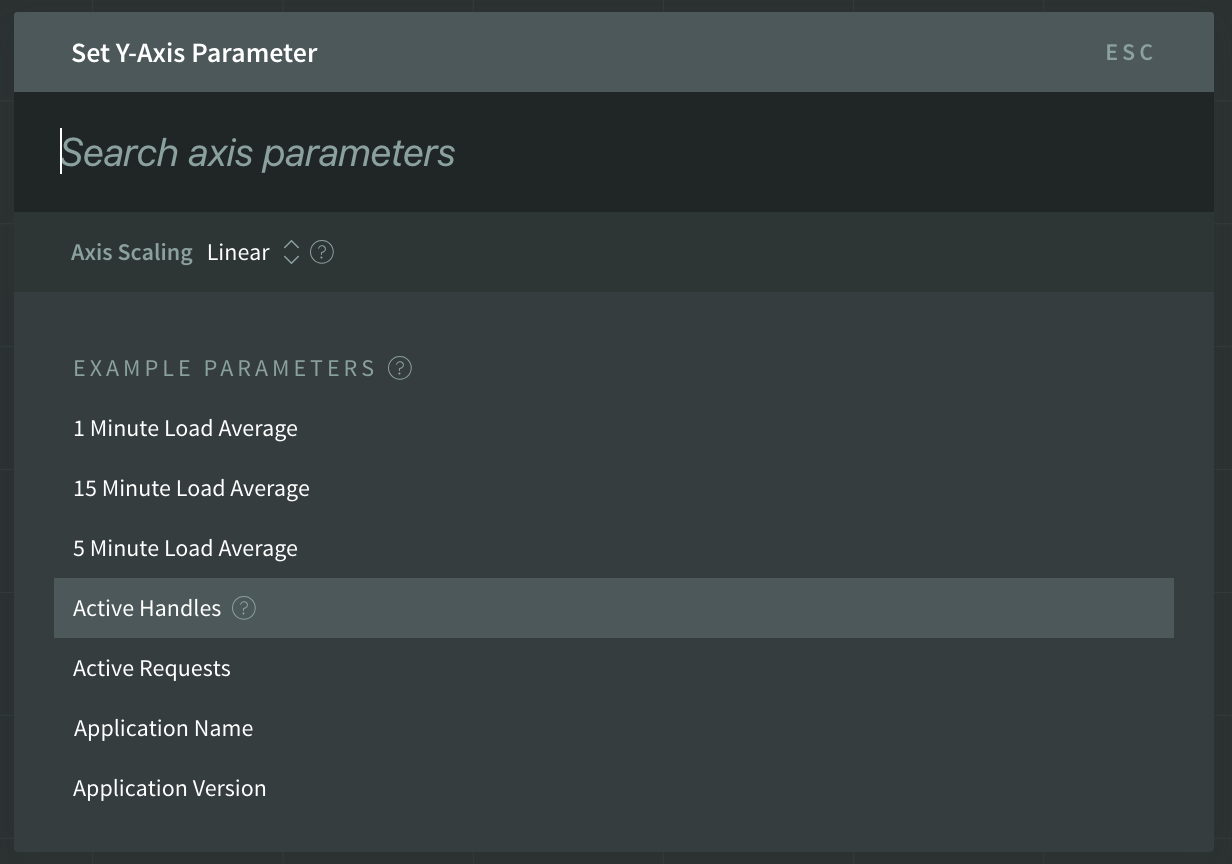
Any numeric metric may be used to plot either axis. NodeSource recommends the following metrics as being the most useful:
| Metric | Description |
|---|---|
| 5 Minute Load Average | The host system's five-minute load average. |
| Active Handles | The number of active long-term resources held by the process. |
| Application Name | The user-specified application name as set in package.json or the NSOLID_APP environment variable. |
| CPU Used (%) | The percent CPU used by the process. |
| Event Loop Estimated Lag | The estimated amount of time a I/O response may have to wait in the process, in milliseconds. |
| Event Loop Idle Percent | The percent time that the process is waiting (idle) for I/O or timers. |
| GC Count | The total number of garbage collections done by the process. |
| GC Median Duration | The process's median duration of garbage collections, in microseconds. |
| Heap Total | The process's total allocated JavaScript heap size, in bytes. |
| Heap Used | The process's total used JavaScript heap size, in bytes. |
| Hostname | The host system's name. |
| NODE_ENV environment variable | The user-specified NODE_ENV environment variable. |
| Process Uptime | The process's uptime, in seconds. |
| Resident Set Size | The resident set size (total memory) used by the process, in bytes. |
| Tag | The user-specified tags as set by the NSOLID_TAGS environment variable. |
| Vulnerabilities Found | The number of known vulnerabilities found in the modules of the process. |
Additionally, the Y-axis may also plot any textual field data that is provided by the N|Solid agents.
A full list of metrics available to N|Solid can be found in the Metrics in Detail section (some of the listed metrics may not be available in the Scatterplot).
Axis Scaling
There are three options for axis scaling available:
- Linear: The default scaling option. Plotted values are evenly distributed along the graph.
- Logarithmic: Decompresses lower values along the graph.
- Exponential: Decompresses higher values along the graph.
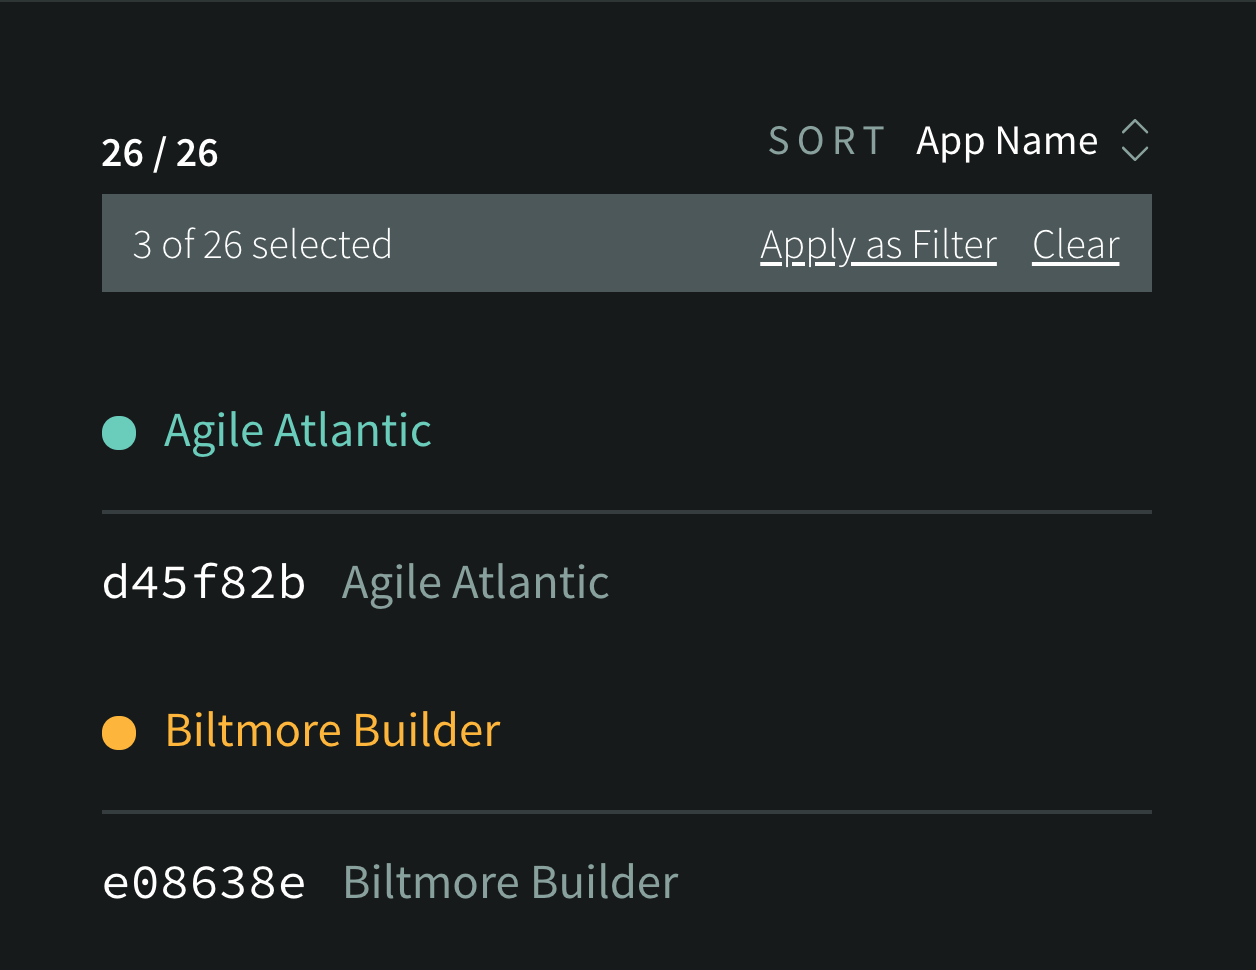
Processes List
The Processes List on the right side of the page provides a textual representation of the processes on the scatterplot.
Click and drag inside the scatterplot to select a subset of processes. The Processes List will update to show only these processes. Click Apply as Filter to view the selected processes as a filter, which you can then save as a Saved View. Click Clear or click on the graph to clear the selection and show all processes within the view.

Sort selected processes in the Processes List using the Sort dropdown. Sorting by App Name or Hostname will group like processes together. Sorting by Vulnerabilities will group vulnerable and non-vulnerable processes together respectively. Sorting by CPU, Memory, or Uptime will sort the processes numerically by these metrics. For sorting methods that group processes (App Name, Hostname, and Vulnerabilities), clicking on the label for a group of processes will select, or narrow selection, to that group of processes.
Clicking the process ID will take you to the Process Detail view.
Hovering your mouse over a process in the Processes List will highlight that process in the graph for easy identification among other processes. Hovering on a process when processes are selected also reveals an X icon that may be clicked to remove a single process from the selection.
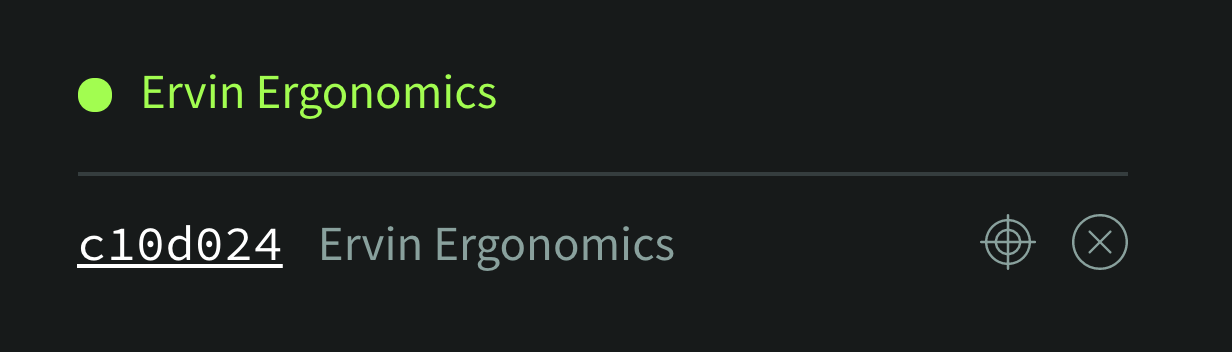
Hovering over a process in the Processes List also shows a target icon that enables process targeting. Process targeting causes one minute of the process's recent historic metrics to be visualized as a trail following the process around the graph. One process can be targeted at a time. Clicking the target icon a second time will disable process targeting.
Process Detail View
The Process Detail view shows detailed information relating to a specific process. At the top of the view it displays data that N|Solid receives from the process, including the pid, host, platform, and CPU configuration.
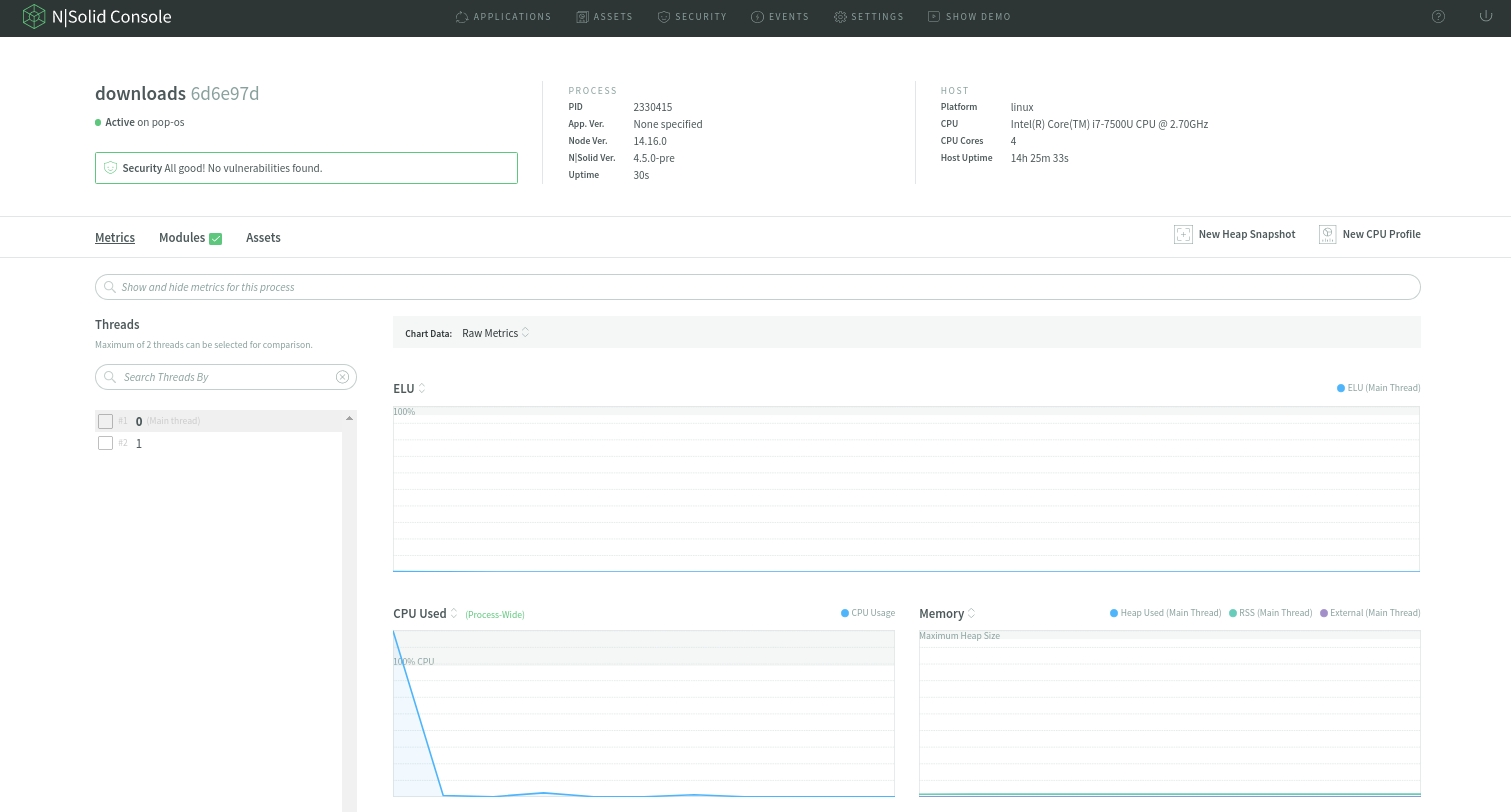
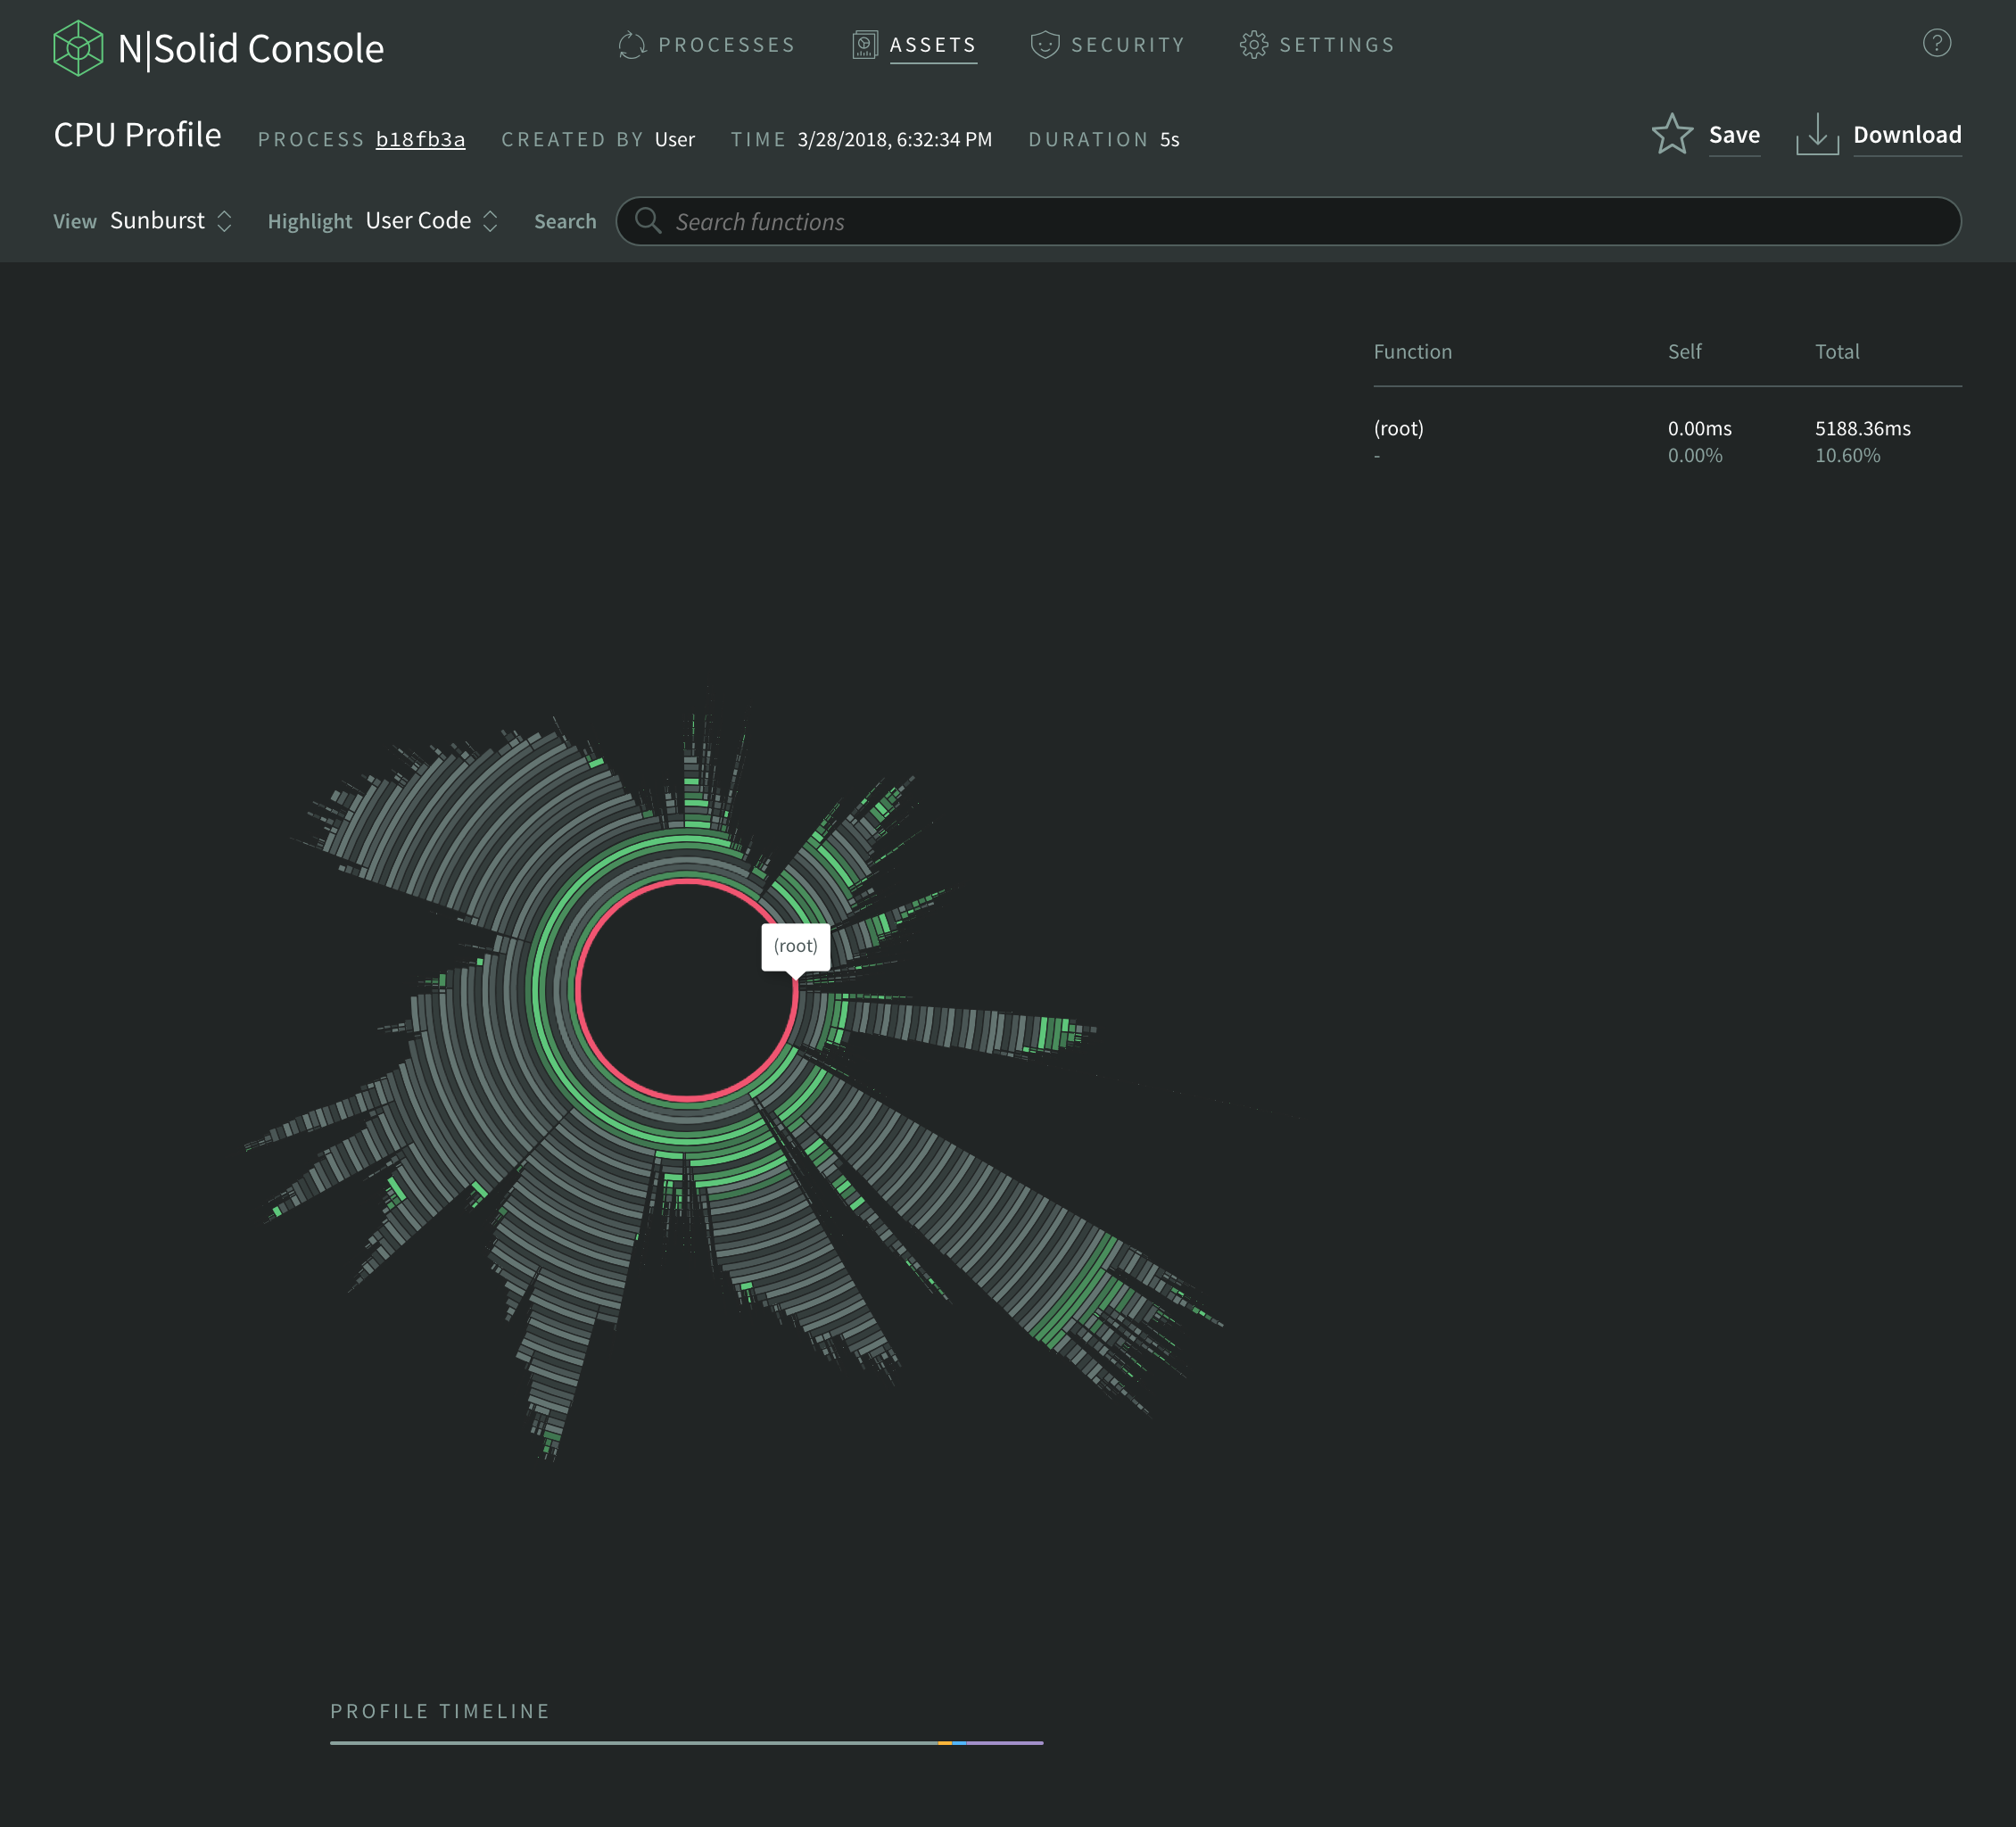
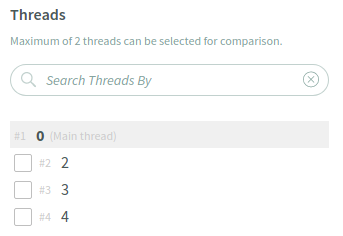
The left side of this view contains the threads (worker threads) of the process, the thread 0 is the main thread and the rest of them are worker threads, and the right side of this page also contains controls for manually taking CPU profiles and heap snapshots of this process.
The available threads can also have a name to make them easier to identify, learn how to set thread name
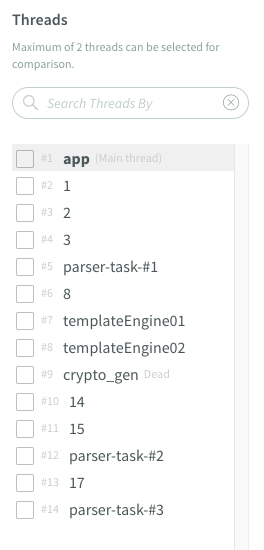
Comparison of Threads
You can compare threads by selecting thread IDs on the Thread List. Please note that maximum of 2 threads can be selected for comparison.
The legend of the metrics chart will be automatically updated including each thread ID based on the threads you selected for comparision.
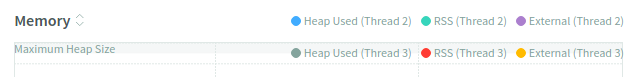
Note: There are some metrics marked as process-wide, which are not thread-specific.
Metrics Tab
The Metrics tab contains several charts which visualize important performance metrics which N|Solid gets from your processes.
| Section | Description |
|---|---|
| ELU (Event loop utilization) | Learn more at: Event loop utilization blogpost |
| CPU Used | CPU usage for this process |
| Memory | Heap total, heap used, and resident set size. Heap total is total size of the V8 heap, which includes everything in the heap, including free space which has been allocated by V8 but is unused by JavaScript objects. Heap used is the size of of the V8 heap occupied directly by JavaScript objects created by the application, as well as V8 internal objects created on behalf of it. Resident set size (RSS) is the actual memory footprint of the process over time. It does not include memory that belongs to the process that has been swapped out to disk |
| Host Load | The average system load over the last one, five, and fifteen minutes |
| Event Loop | Two series that reflect the health of the event loop. The Idle % shows how often the event loop is waiting for work. The Lag data shows the average time in milliseconds for each tick of the event loop |
| Internal Activity | Two series which include process-lifetime counts of the total number of garbage collections performed, and the number of event loop turns |
| Host Memory | The amount of host memory in use by all processes on this system |
| Internal Activity Rates | The Internal Activity graph, but instead of lifetime totals it shows how many Event Loop iterations and Garbage Collections run per second |
| HTTP Median | The median timing of HTTP/HTTPS Client or Server requests and DNS requests made by the application. Each is measured in milliseconds |
| HTTP 99th Percentile | The 99th Percentile timings of HTTP/HTTPS Client and Server requests and DNS requests made by the application, measured in milliseconds |
| HTTP Totals | The total counts of HTTP/HTTPS Client and Server requests and DNS requests for the lifetime of the application |
| HTTP Requests Per Sec | The number of HTTP/HTTPS Client and Server requests and DNS requests made by the application per second |
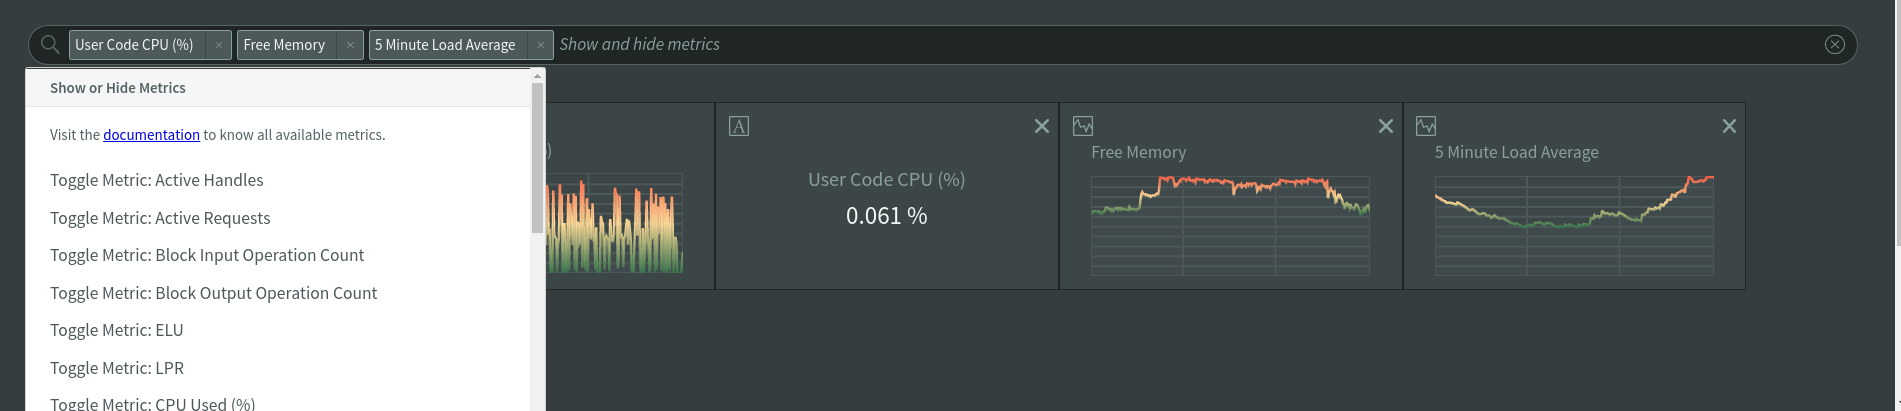
Show or Hide Metrics
The Metrics Search Bar allows you to show or hide metrics, which supports auto-completion for all of the metrics defined in the Metrics in Detail.
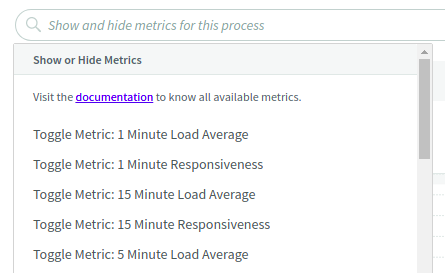
To show more metrics which are not on the metrics tab by default, search metrics using the auto-completion and select the metrics from the search results. You can also set multiple filters on the search bar.
Note: Please refer to Metrics in Detail to see all available metrics.
The chart of the metrics that you selected will be shown below the ELU metrics chart. If you want to hide metrics, click x icon on the metrics label on the search bar.
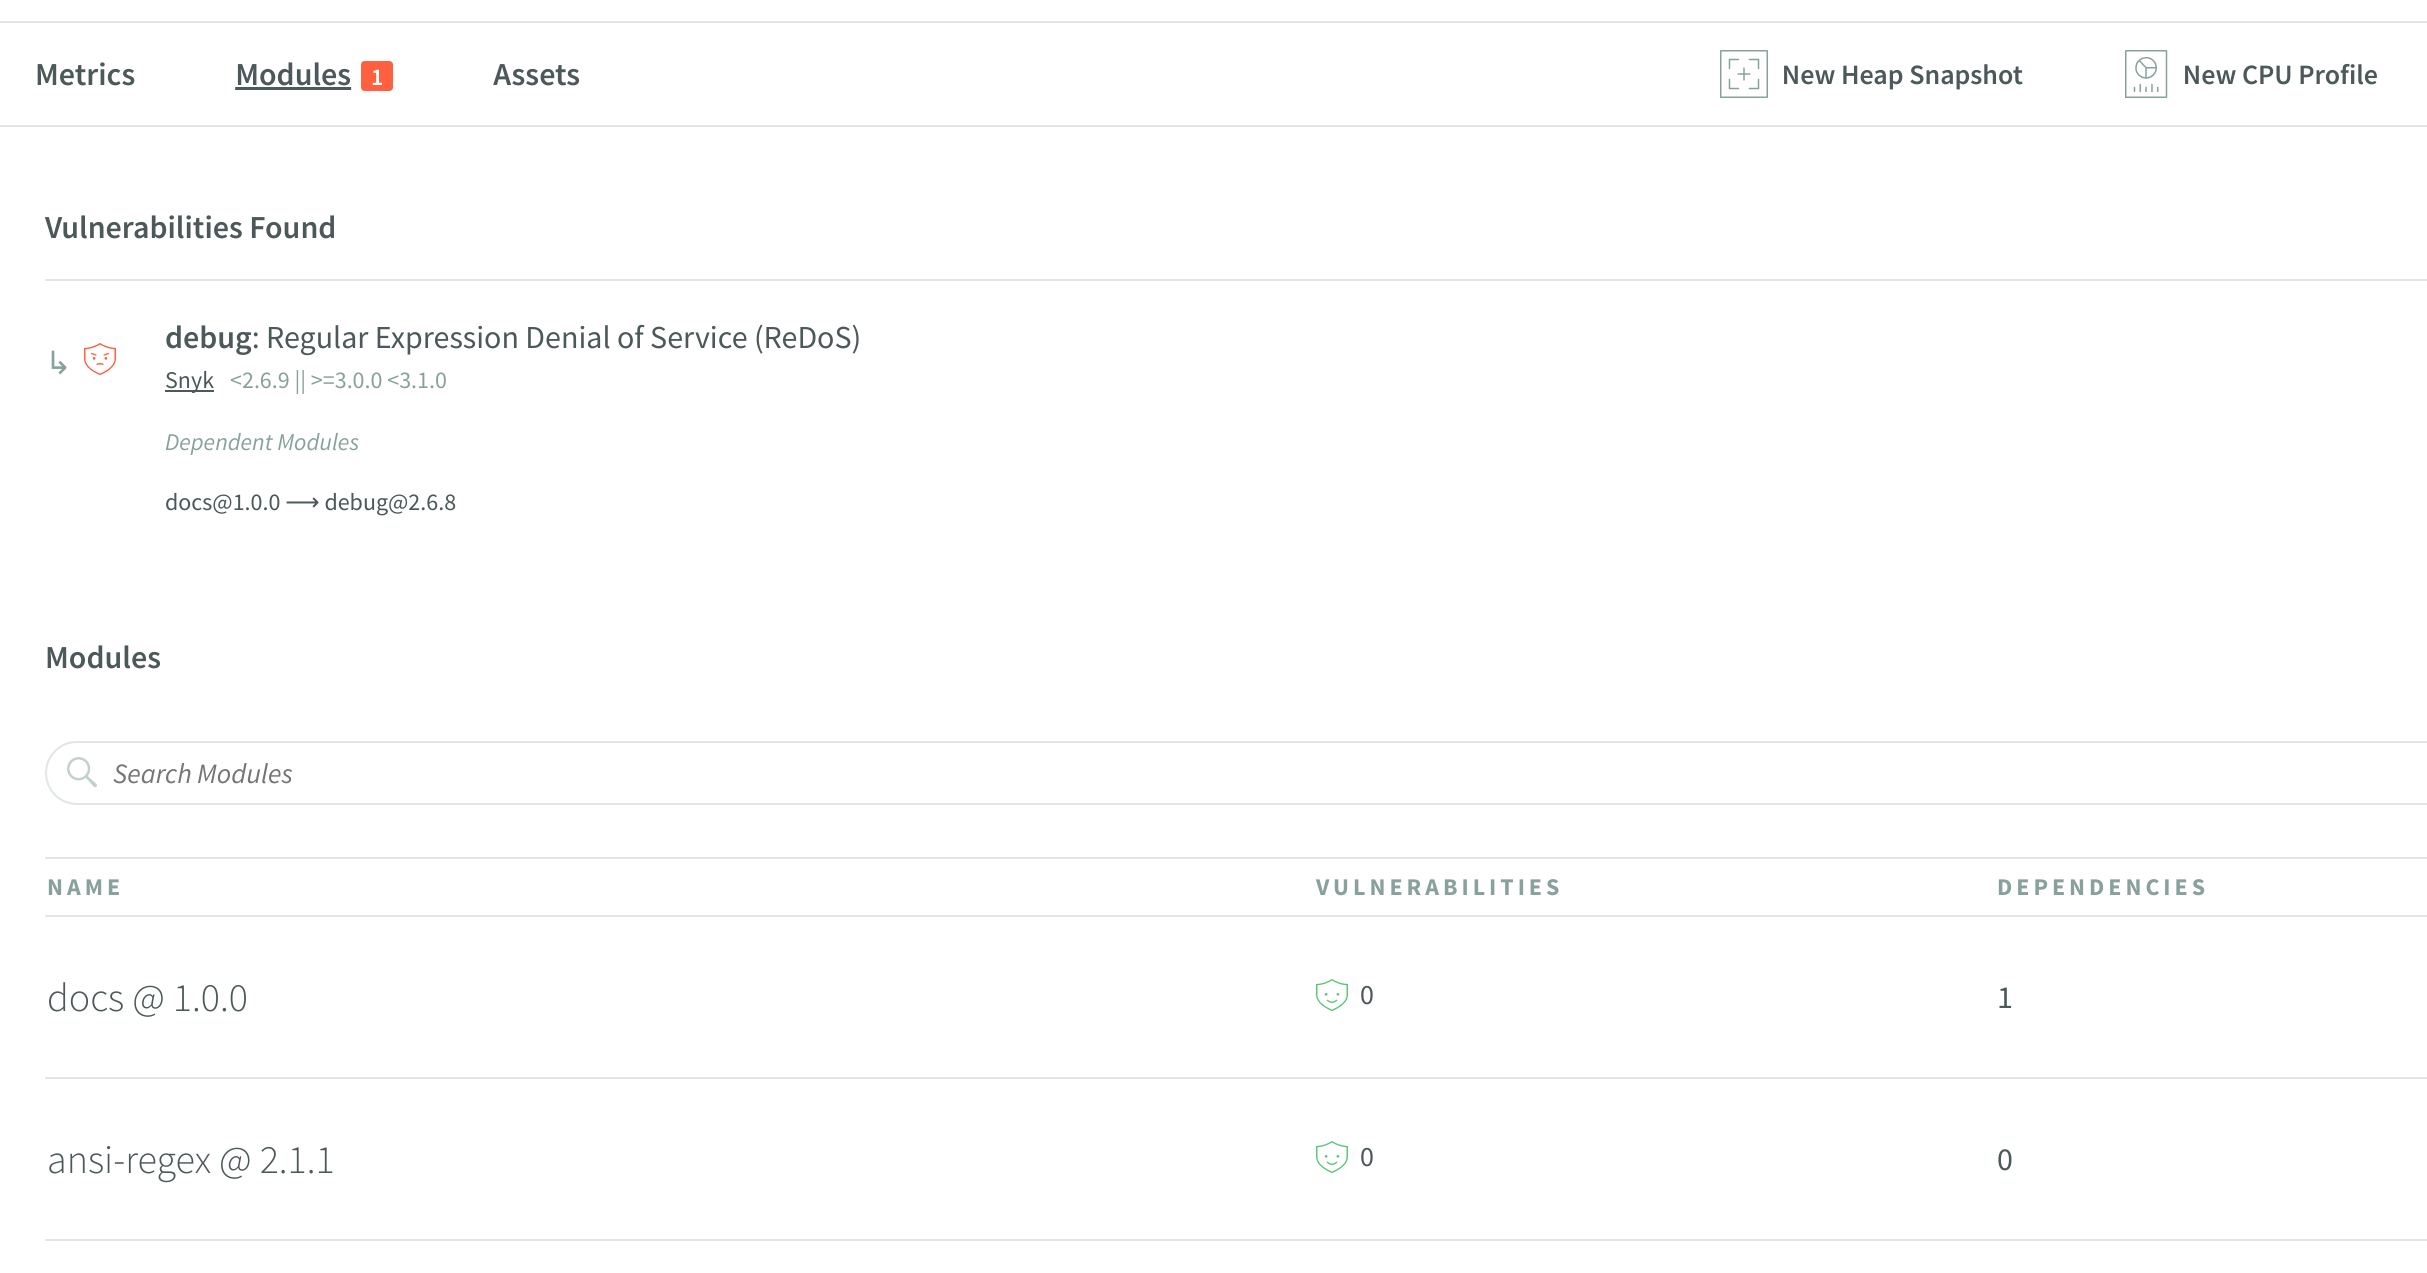
Modules Tab
The Modules tab lists all modules this process is loading and using at runtime. More importantly, this tab prominently features modules that include known security vulnerabilities.
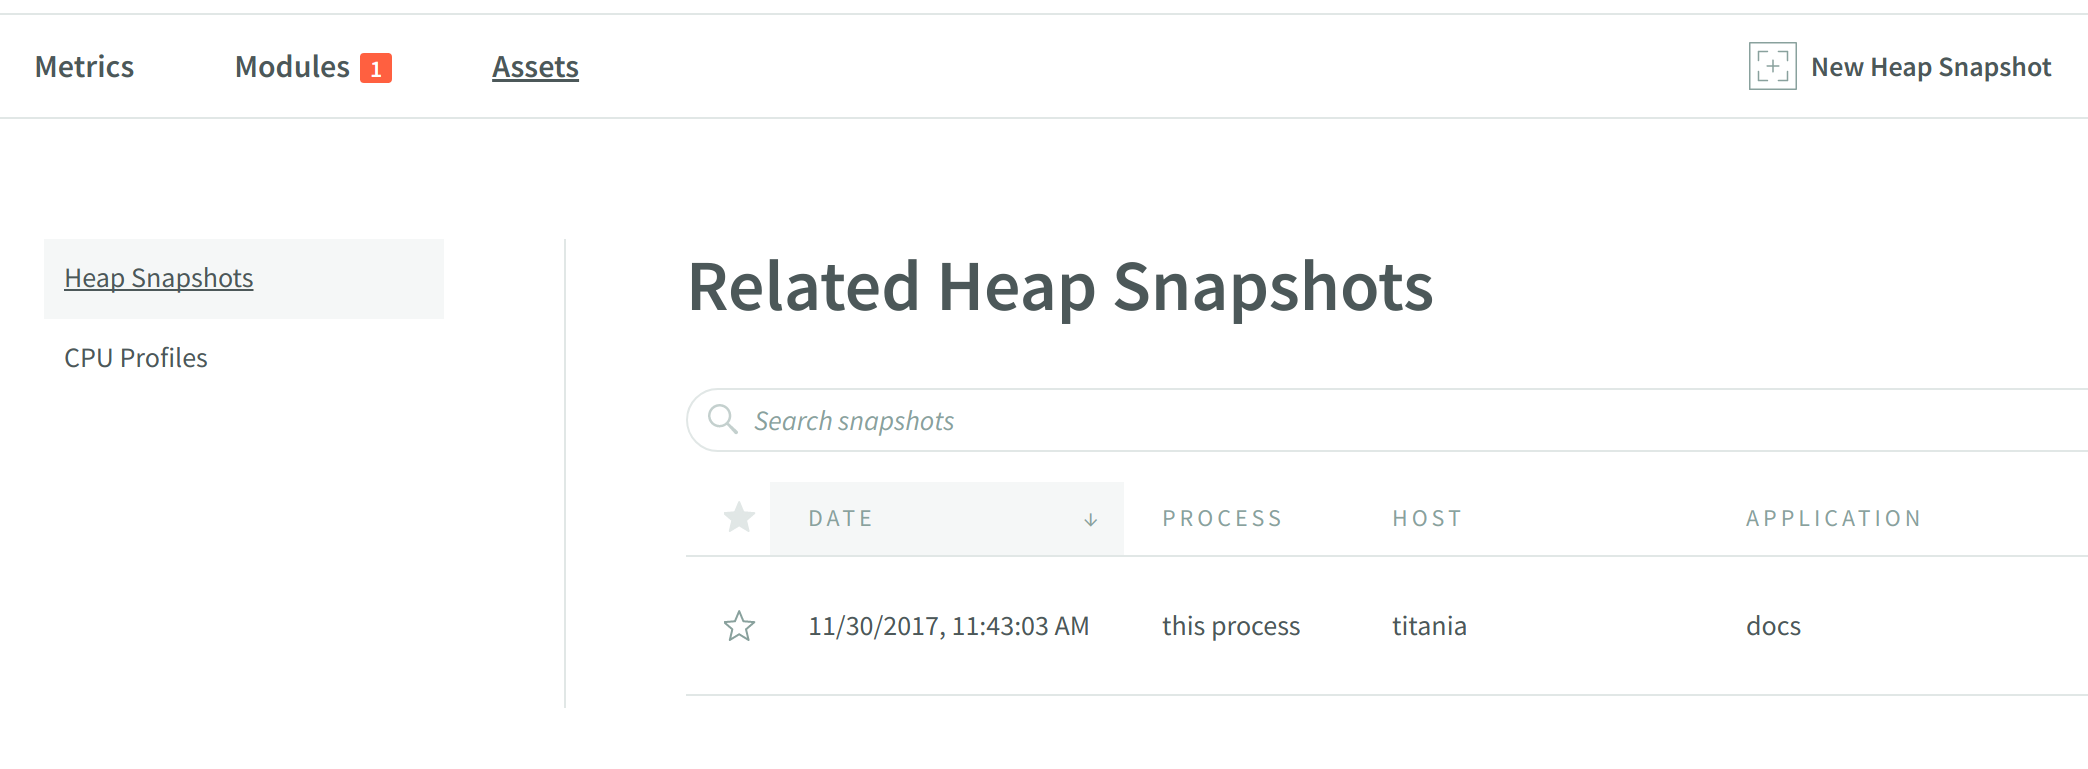
Assets Tab
The Assets tab lists CPU profile and heap snapshots related to this process. Click on the asset to view it.