Saved Views
A Saved View is a graph defined by a search query. Saved views allow you to view processes that fulfill certain parameters and to instruct N|Solid to take certain actions (such as taking heap snapshots, CPU profiles, or sending webhooks) when one or more processes cross over performance thresholds or match query parameters that you set.
Performance problems often occur in production code non-deterministically, and often the only diagnostics available are an error log or possibly a stack trace. With N|Solid's saved views, you can automatically capture critical information when problems arise in production.
Saved View Presets
Several preset saved views are included to provide out-of-the-box insight into the running state of your Node.js application:
Memory Clustering. This preset compares Heap Used and Resident Set Size, and helps capture processes' total memory space.
Garbage Collection Clustering. In the GC Clustering preset view, GC Count and GC Duration 99th Percentile are directly compared, providing insight into how garbage collection duration affects processes' memory usage.
Garbage Collection Anomalies. By comparing Garbage Collections Count and Process Uptime, this saved view provides insights into GC Count outliers.
Active Resource Usage. With this preset, the number of Active Handles and the Resident Set Size are compared, providing insight into longer term resource usage.
Garbage Collection Efficiency. This preset compares Major Garbage Collections Count and GC Median Duration to provide insights into garbage collection efficiency.
Creating a Saved View with N|Solid Console
-
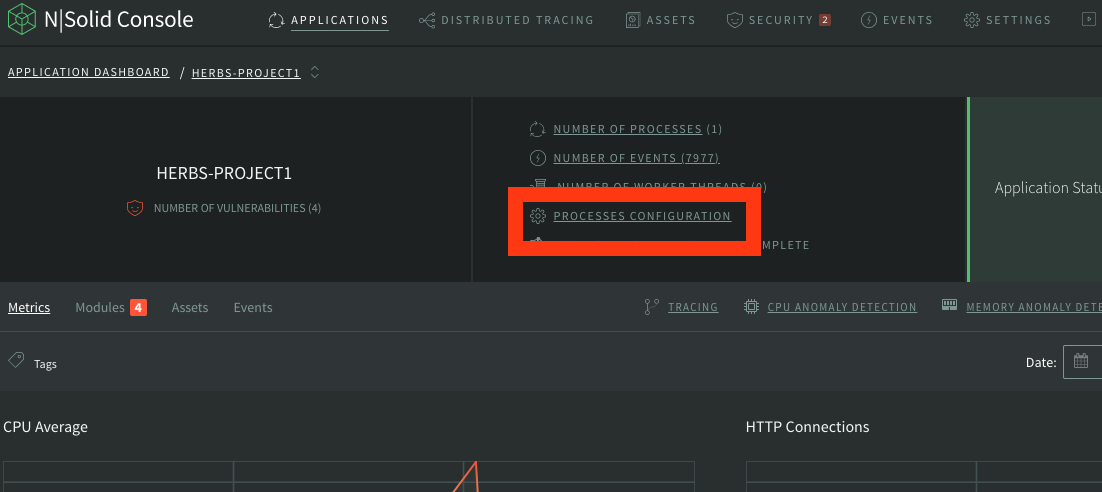
Click Processes in the Nav Bar to get to the Processes view. The default view shows all processes connected to N|Solid Console.
-
To create a saved view, enter some query parameters and values into the filter search bar. Clicking on the bar will display a partial list of query terms. Type to begin searching for the parameter you wish to use. Click on one of the terms to select an operator and value.
-
Click Set Filter to save this search term to your active filter. Repeat this process until your filter is set up as desired with all of your required search terms.
-
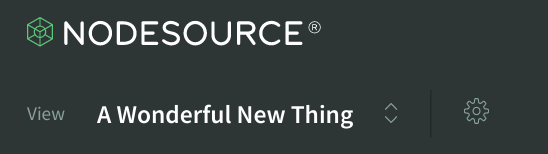
When the filter has been named and saved, it will become available in the View dropdown selector.
Actions
Actions are a way to trigger some "actions" (as the features name describe) when a saved view filter is attended.
Configuring actions
-
Navigate to the Processes view and select a saved view from the dropdown menu. If you have never created a saved view before, create a saved view as described in the session below. You might see the default
All Processesview Actions and notifications but the Actions can't be added to theAll Processesview, so create a new saved view. -
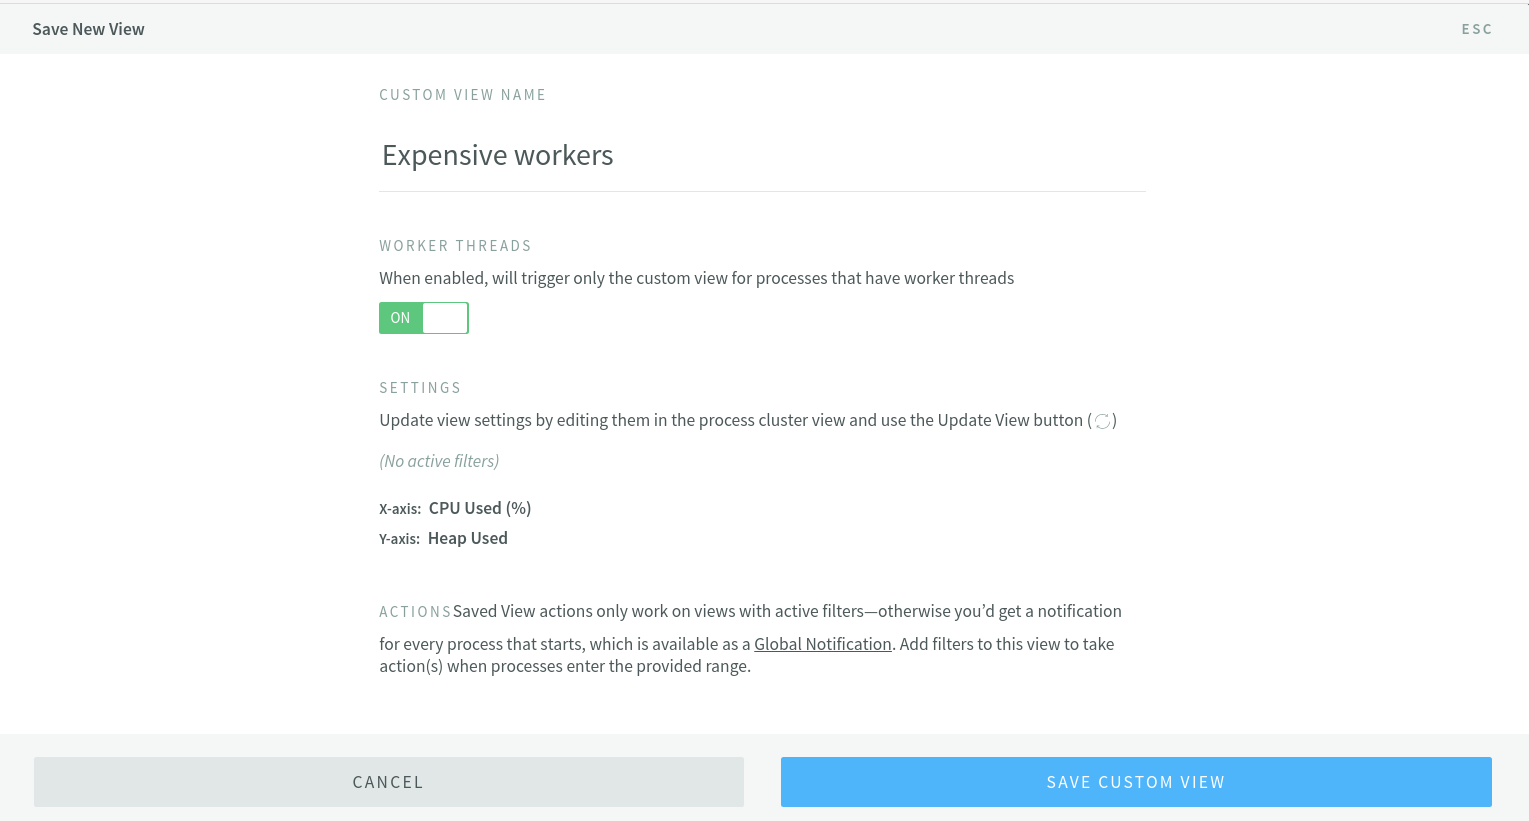
Click on the gear icon to the right of the saved view name.
-
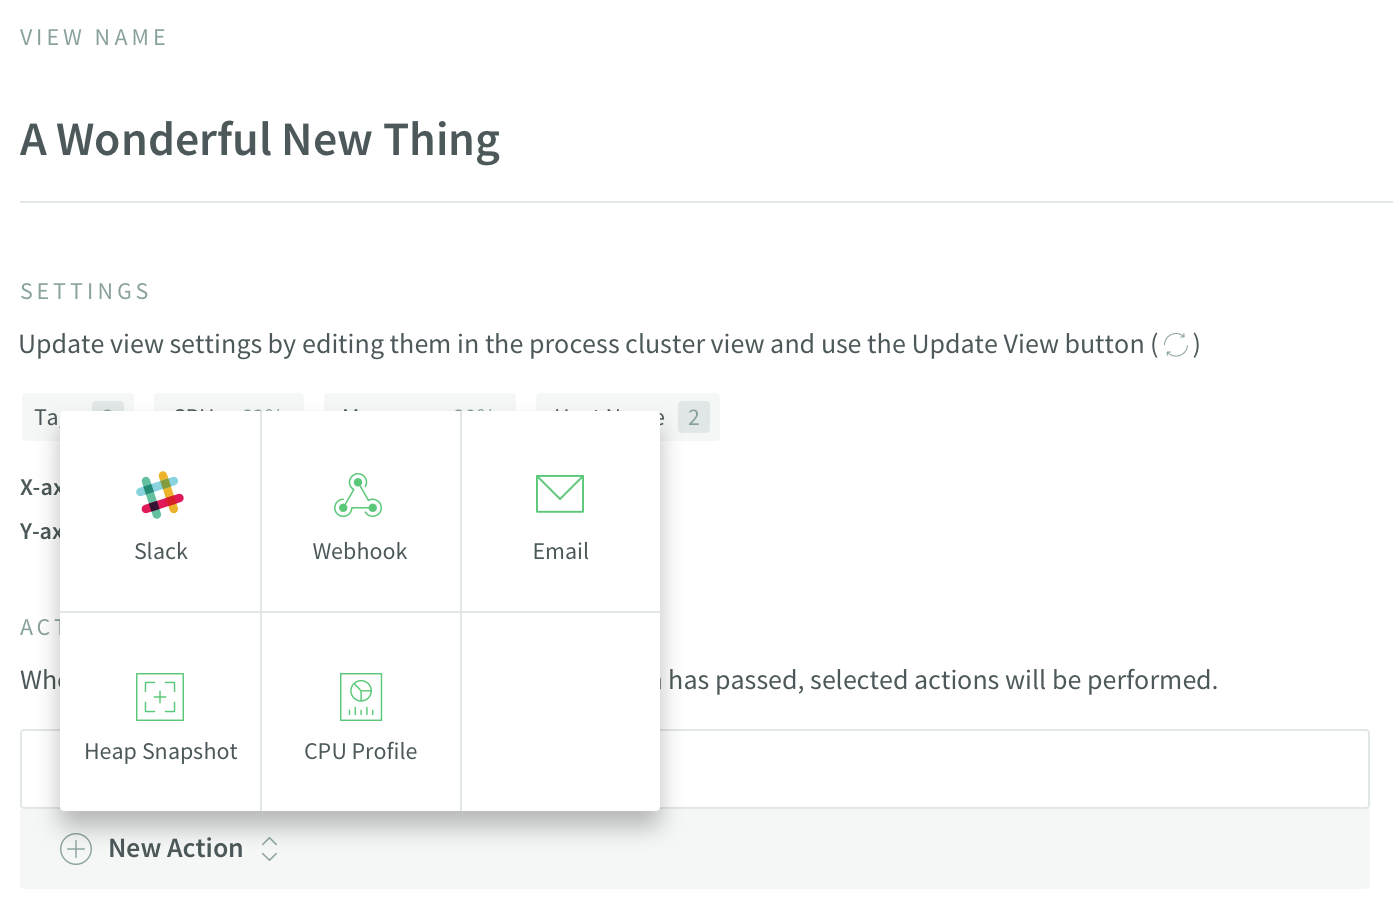
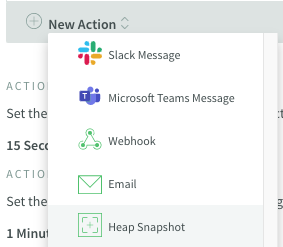
Select one or more actions or notification integrations, if desired. These will run on each process that matches the saved view filter.
The saved views can be Workers Processes exclusive, if the Worker threads option is enabled, this view will be triggered only on Apps with active worker threads.
Note: Be careful about setting a very high value on your saved view's filter expression, such as 99% Heap, and then selecting an action that uses the same resource, such as Take Heap Snapshot. Taking intensive action at a very high ceiling is likely to negatively impact your application.
Heap snapshot
This one is the easiest Action to set up. Just select the Heap Snapshot option in the Actions drop-down menu.
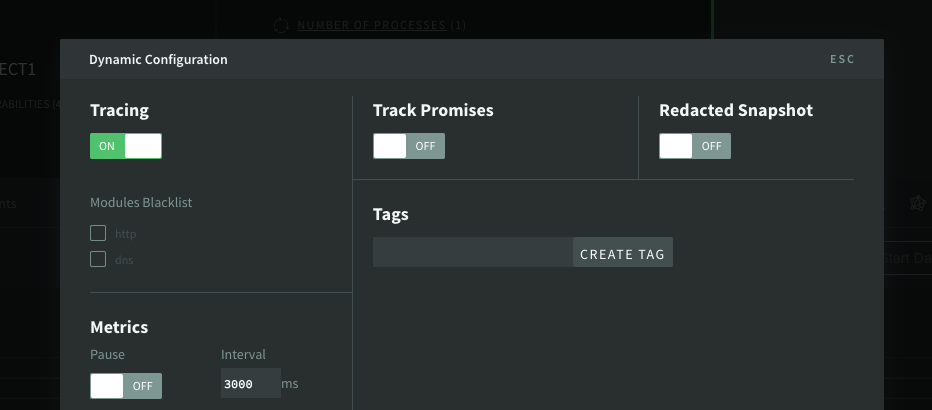
Tracing
After selecting the Trace or CPU Profiling option in the Actions drop-down menu, a modal will open, there you can inform how much time you want the trace runs when the saved view has been triggered. Learn more about tracing here.
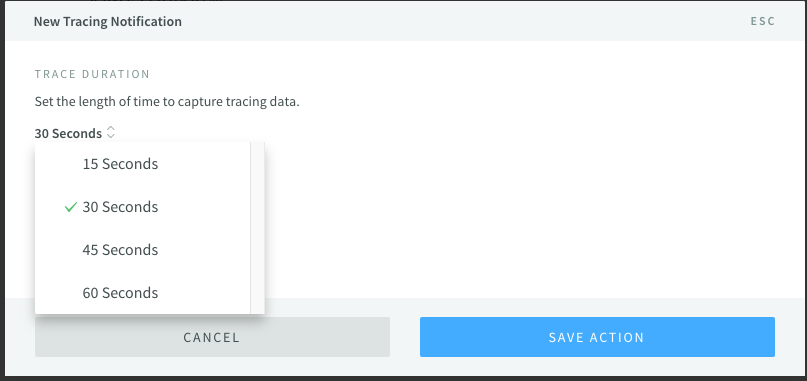
This action will activate and deactivate the trace option for a few seconds on the Process configuration
CPU Profile
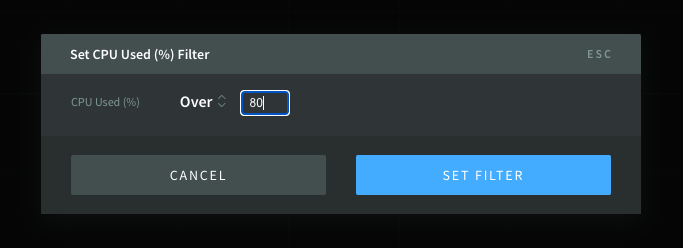
After selecting the CPU Profiling option in the Actions drop-down menu, a modal will open, there you can inform how much time you want the trace runs when the saved view has been triggered.
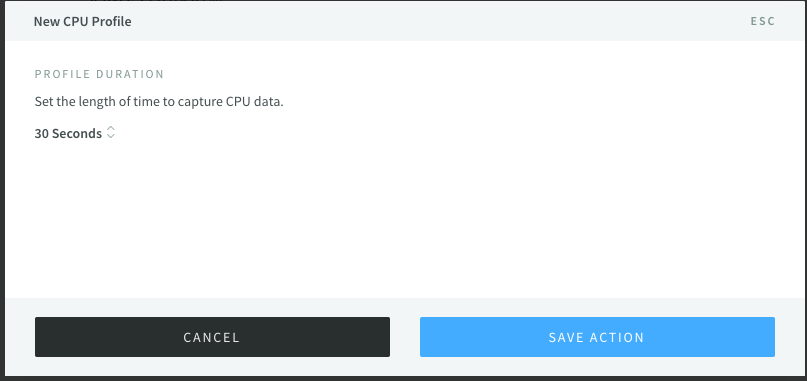
After that, just click on the save action.
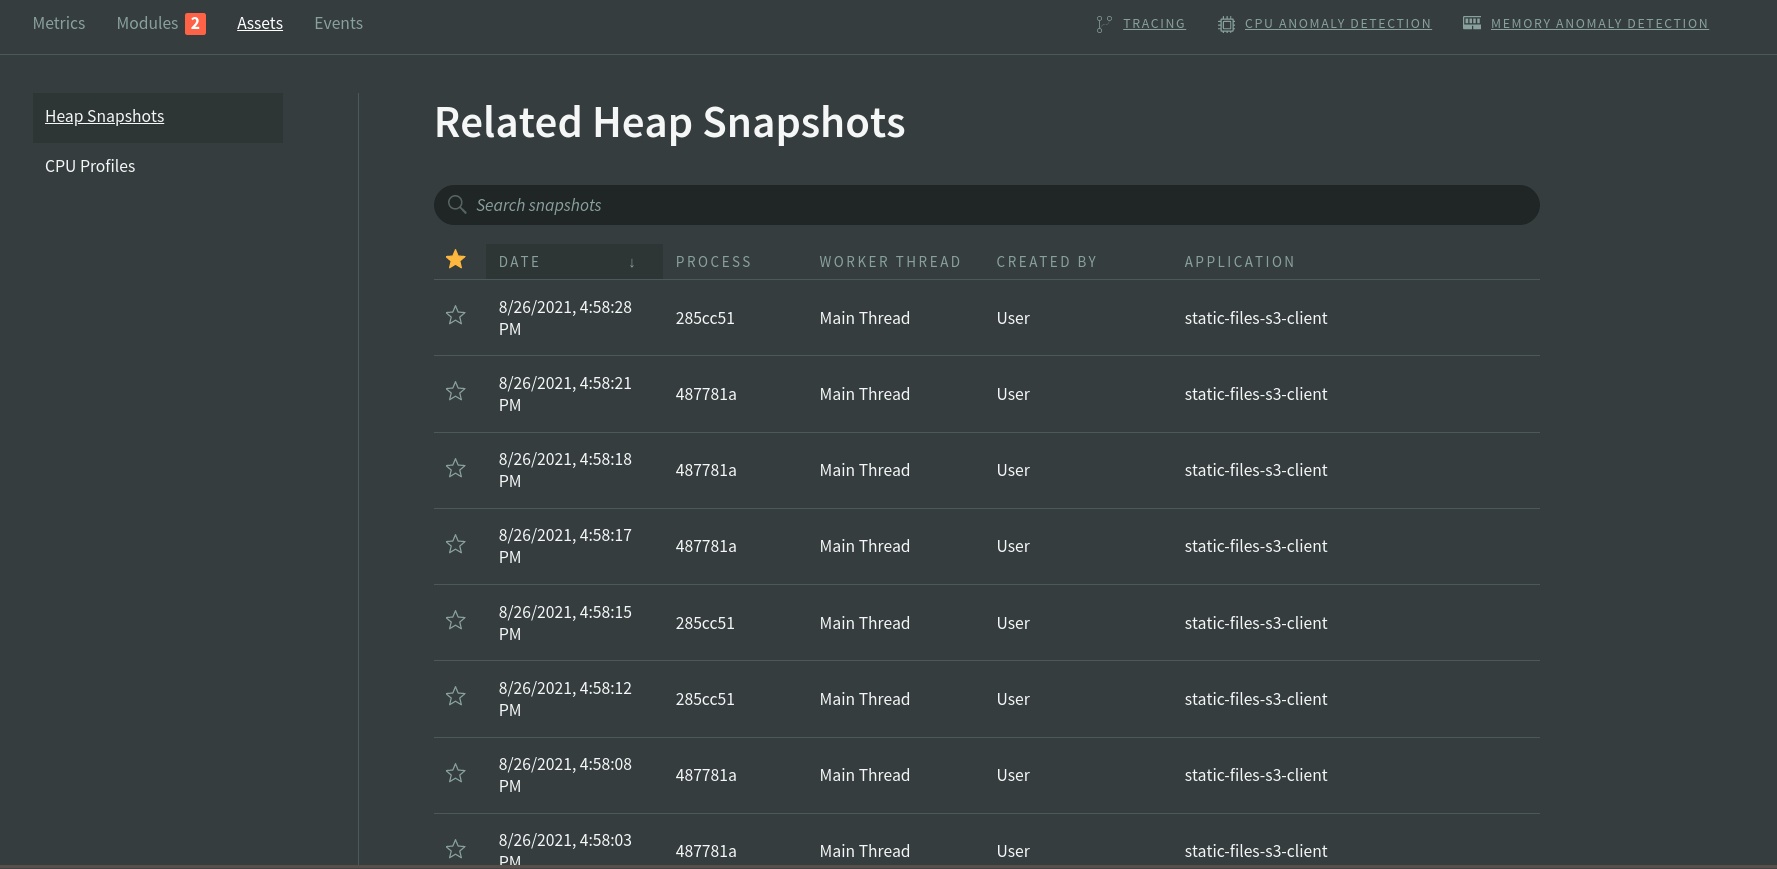
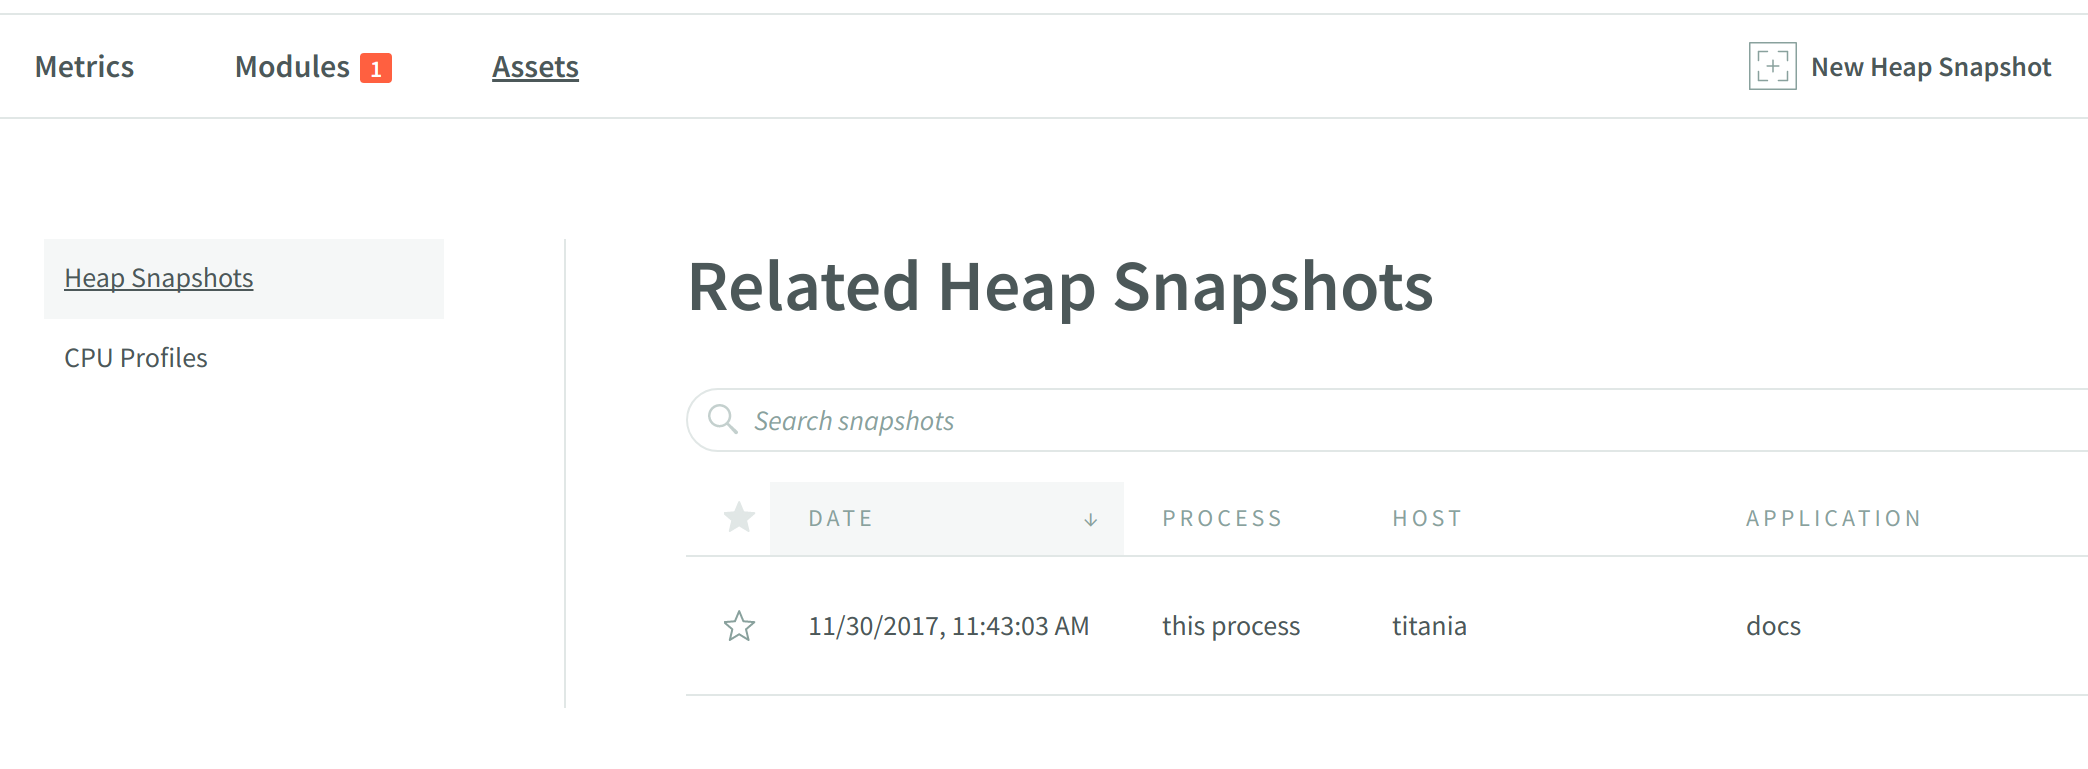
Action results
CPU Profiling and Heap Snapshot
After the saved view has been triggered, you could check the results in the Application assets summary or the assets tab.
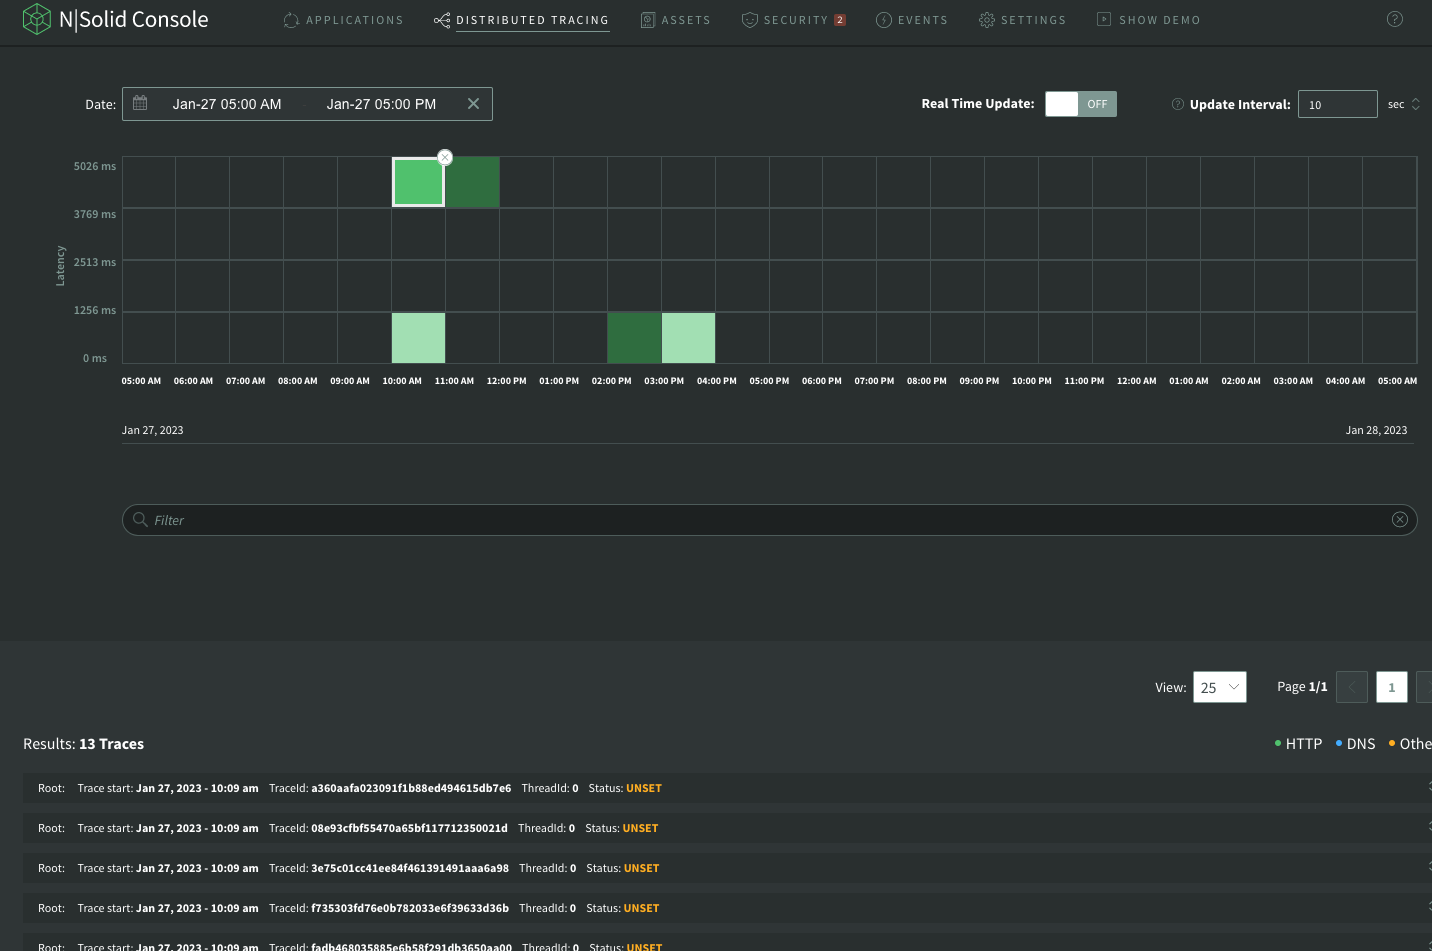
Tracing
After the saved view has been triggered, you could check the results filtering by date on Distributed Tracing page.