Memory Anomaly Detection
Understanding memory management reduces the possibility of wasting your application’s resources, and the unexpected effects on performance. In many cases, there is no clear understanding as to why the memory grows endlessly, however, a check for correlation between set of metrics who intereact with each other can give insights about memory usage and response time degradation.
Memory Anomalies in the N|Solid Console provides a way to detect early cases of memory miss behavior or upcoming Out of Memory situations before it happens.
Inspecting Anomalies
In the N|Solid Console, go to the the Applications Dashboard and click
MEMORY ANOMALY DETECTION.
![]()
If there are no anomalies registered, you'll get an empty list and 0 values in the charts and placeholders.
![]()
If any of the processes or worker threads under an application name have
reported anomaly events, you'll get a list at the left side with a short title,
the process id and if it came from them main or a worker thread. You can filter
this list by processID with the search box at the top.
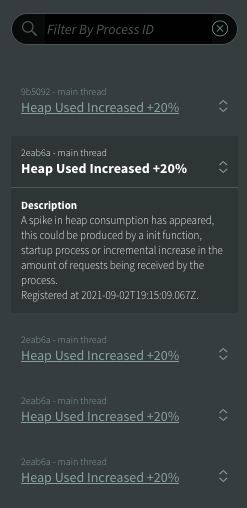
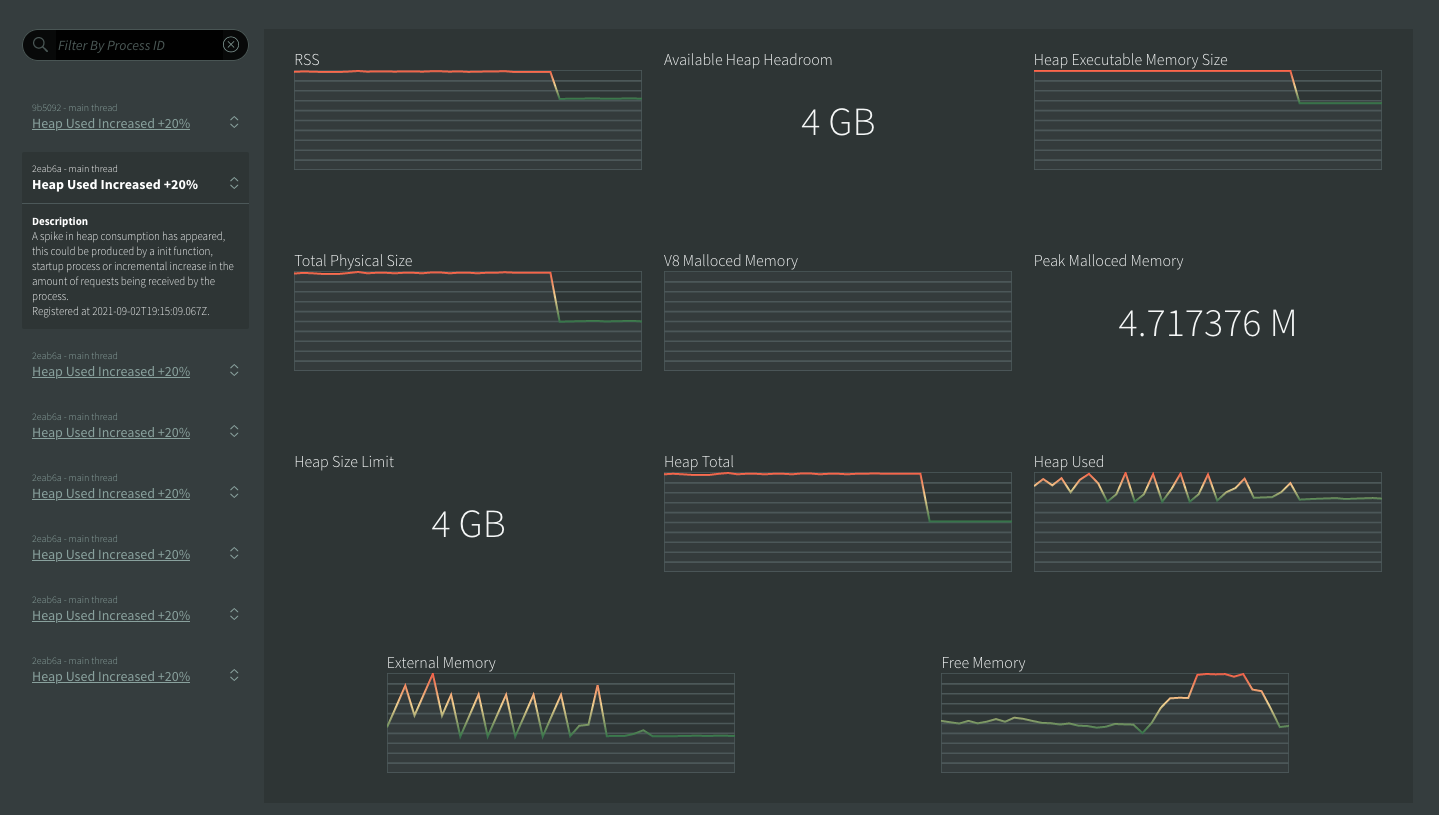
To see the details and load the metrics of an anomaly, click the title of an item to expand it, and extended description will appear with the timestamp and the charts at the right side will load a snapshot of the metrics one minute before and after the timestamp registered in the event.
Note: If you are redirected from Events tab, the corresponding anomalies will be shown.
