Heap Snapshots
When faced with a memory leak or performance issue, taking heap snapshots is a great way to help identify the underlying problem. N|Solid provides several ways to capture snapshots: the N|Solid Console, the N|Solid CLI, and the N|Solid Node API.
Taking Heap Snapshots with the N|Solid Console
Using the N|Solid Console, take a series of snapshots and quickly switch between them to better identify problematic areas:
- Launch the console and locate the Processes list on the right.
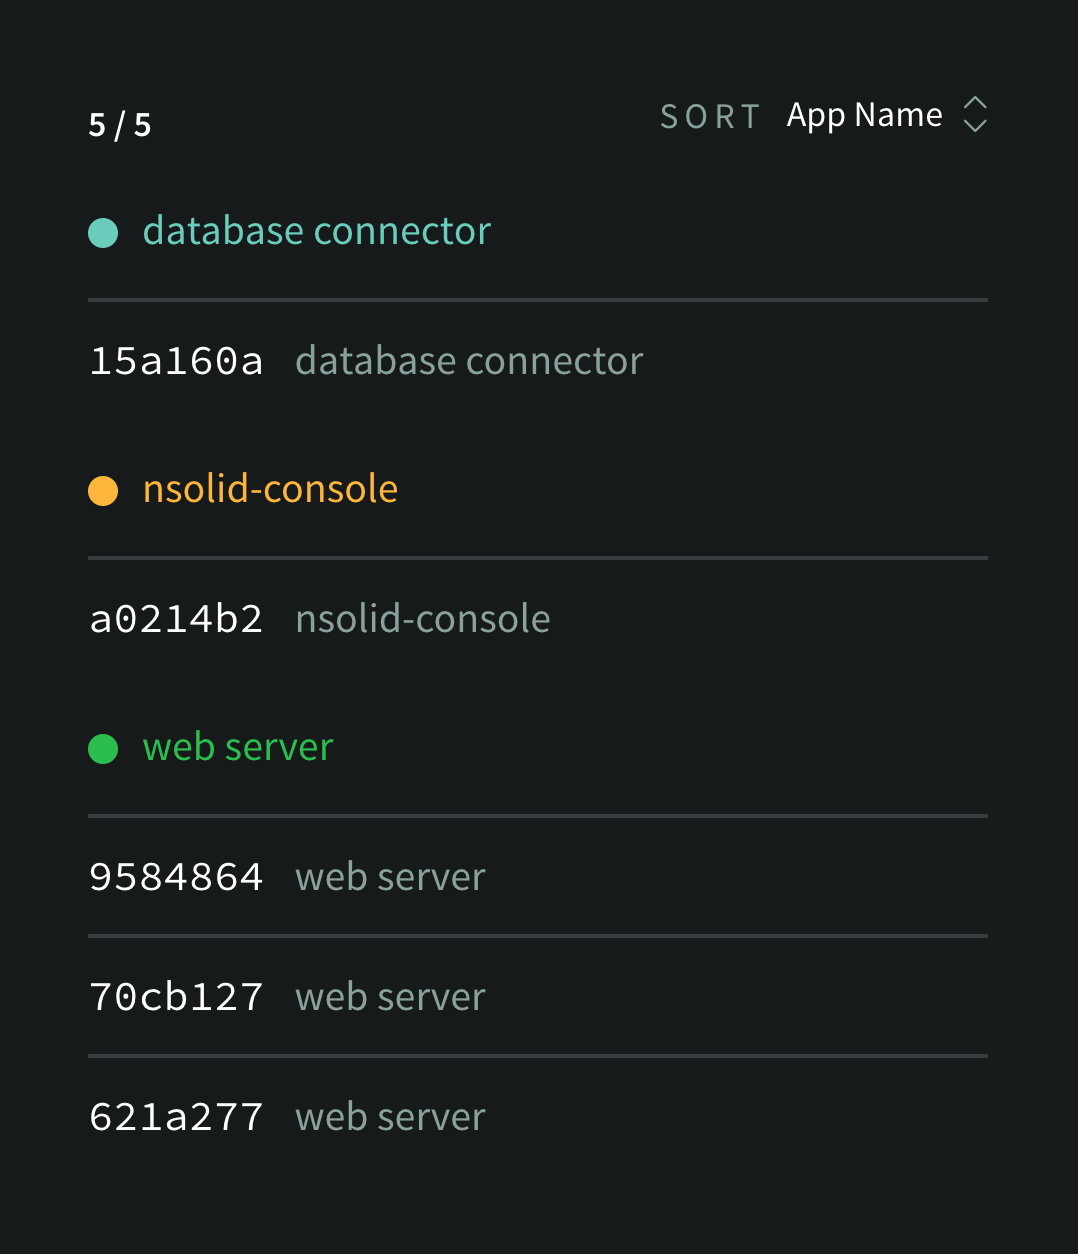
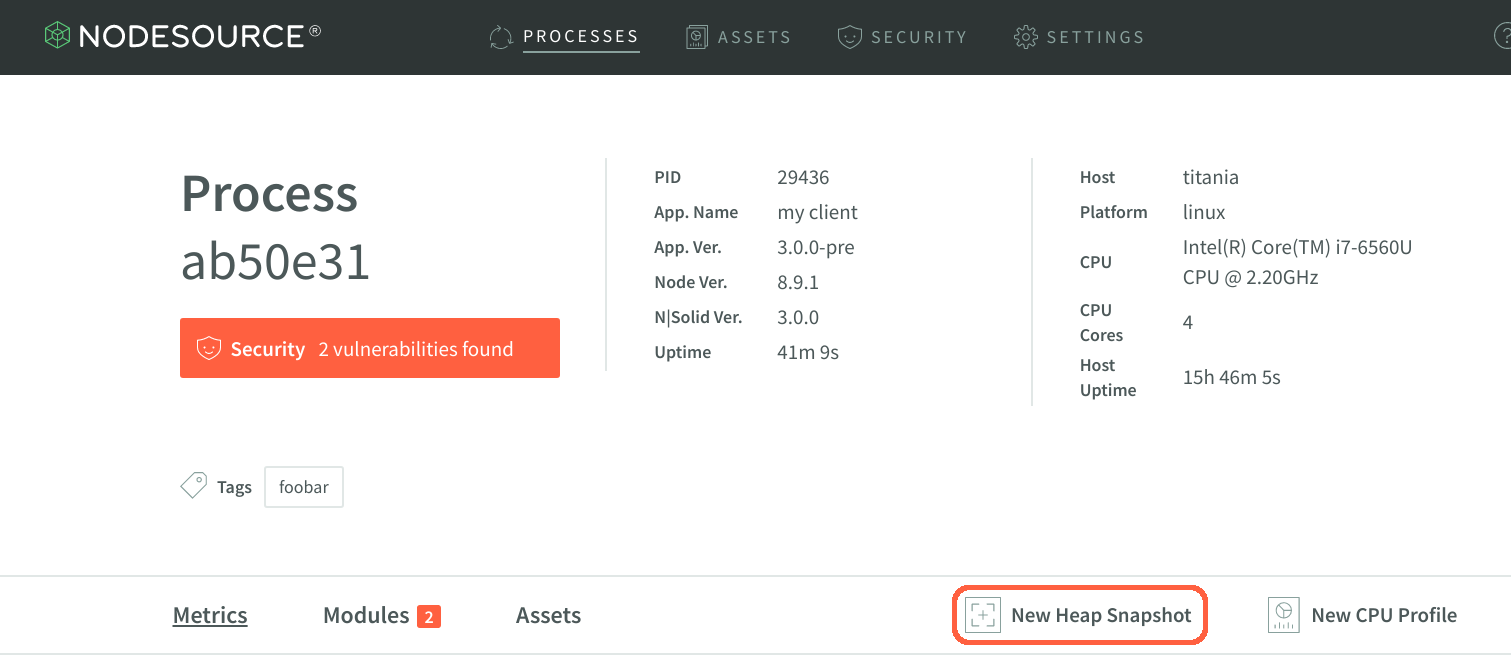
- Click the process ID of the process of interest, and click New Heap Snapshot from the Process Detail view.
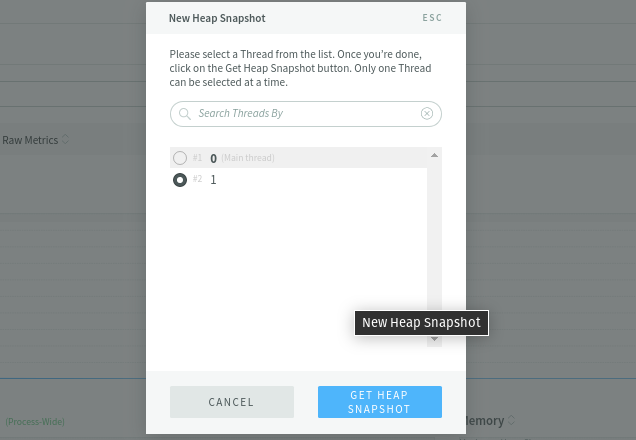
- Select the thread ID of the process of interest, and click Get Heap Snapshot button.
- Once the snapshot completes, a green alert will pop up on the page. Click View Snapshot to see the results, and navigate through the various objects indexed during the snapshot process. To navigate a large number of indexed objects, you can use the Search Constructors search box to narrow the results.
- Snapshots taken in the N|Solid Console can be downloaded to your local drive for exploration via a 3rd party tool (i.e. Chrome Developer Tools). If you wish to download the snapshot for analysis through other tools, simply click Download on the right.
- If you want a particular snapshot to be saved and prevented from being deleted automatically, click Save to mark it for retention.
Note: You can trigger heap snapshots automatically by creating a customized saved view on a memory-related metric (such as
Heap Used > 128MB) that triggers a heap snapshot action when when processes exceed the metric threshold. This is particularly useful for generating heap snapshots on applications that have rare or intermittent memory leaks.
Analyzing Heap Snapshots
Heap Snapshots capture a record of all live JavaScript objects in your Node application available at the time the snapshot is captured. The objects are grouped by their constructor name, with aggregated counts of the total number of objects, their shallow size, and their retained size as columns in the Constructors view.
Shallow Size indicates the amount of space the object uses for its own properties. For instance, an object with no properties will have a very small shallow size, where an object with a number of properties will have a larger shallow size.
Retained Size indicates the amount of space the object is referencing, and keeping from being garbage collected.
From the Constructors view of the snapshot, you can sort by constructor name, number of objects, shallow size, and retained size. The list can also be filtered by constructor name.
You can use the number of objects value to look for the objects that are leaking, and you can use the retained size value to look for objects referencing those leaking objects.
In cases where you are leaking objects - and thus consuming more memory than you should be - sorting by number of objects and by retained size can provide a good indication of where to look for the cause of the leak. A large number of objects of a particular type may be an indication that these objects are still being referenced by other objects, when they could be garbage collected. A large retained size may be an indication that these objects are referencing more objects than they should be, keeping them from being garbage collected.
Comparing Snapshots
The heap snapshot comparison feature makes debugging memory leaks a snap. To begin, you'll need two heap snapshots: a baseline snapshot, taken before the leak is evident, as well as a comparison snapshot, taken when the process or application has exhibited the leaking behavior.
- Navigate to the heap snapshots list, by way of the Assets tab.
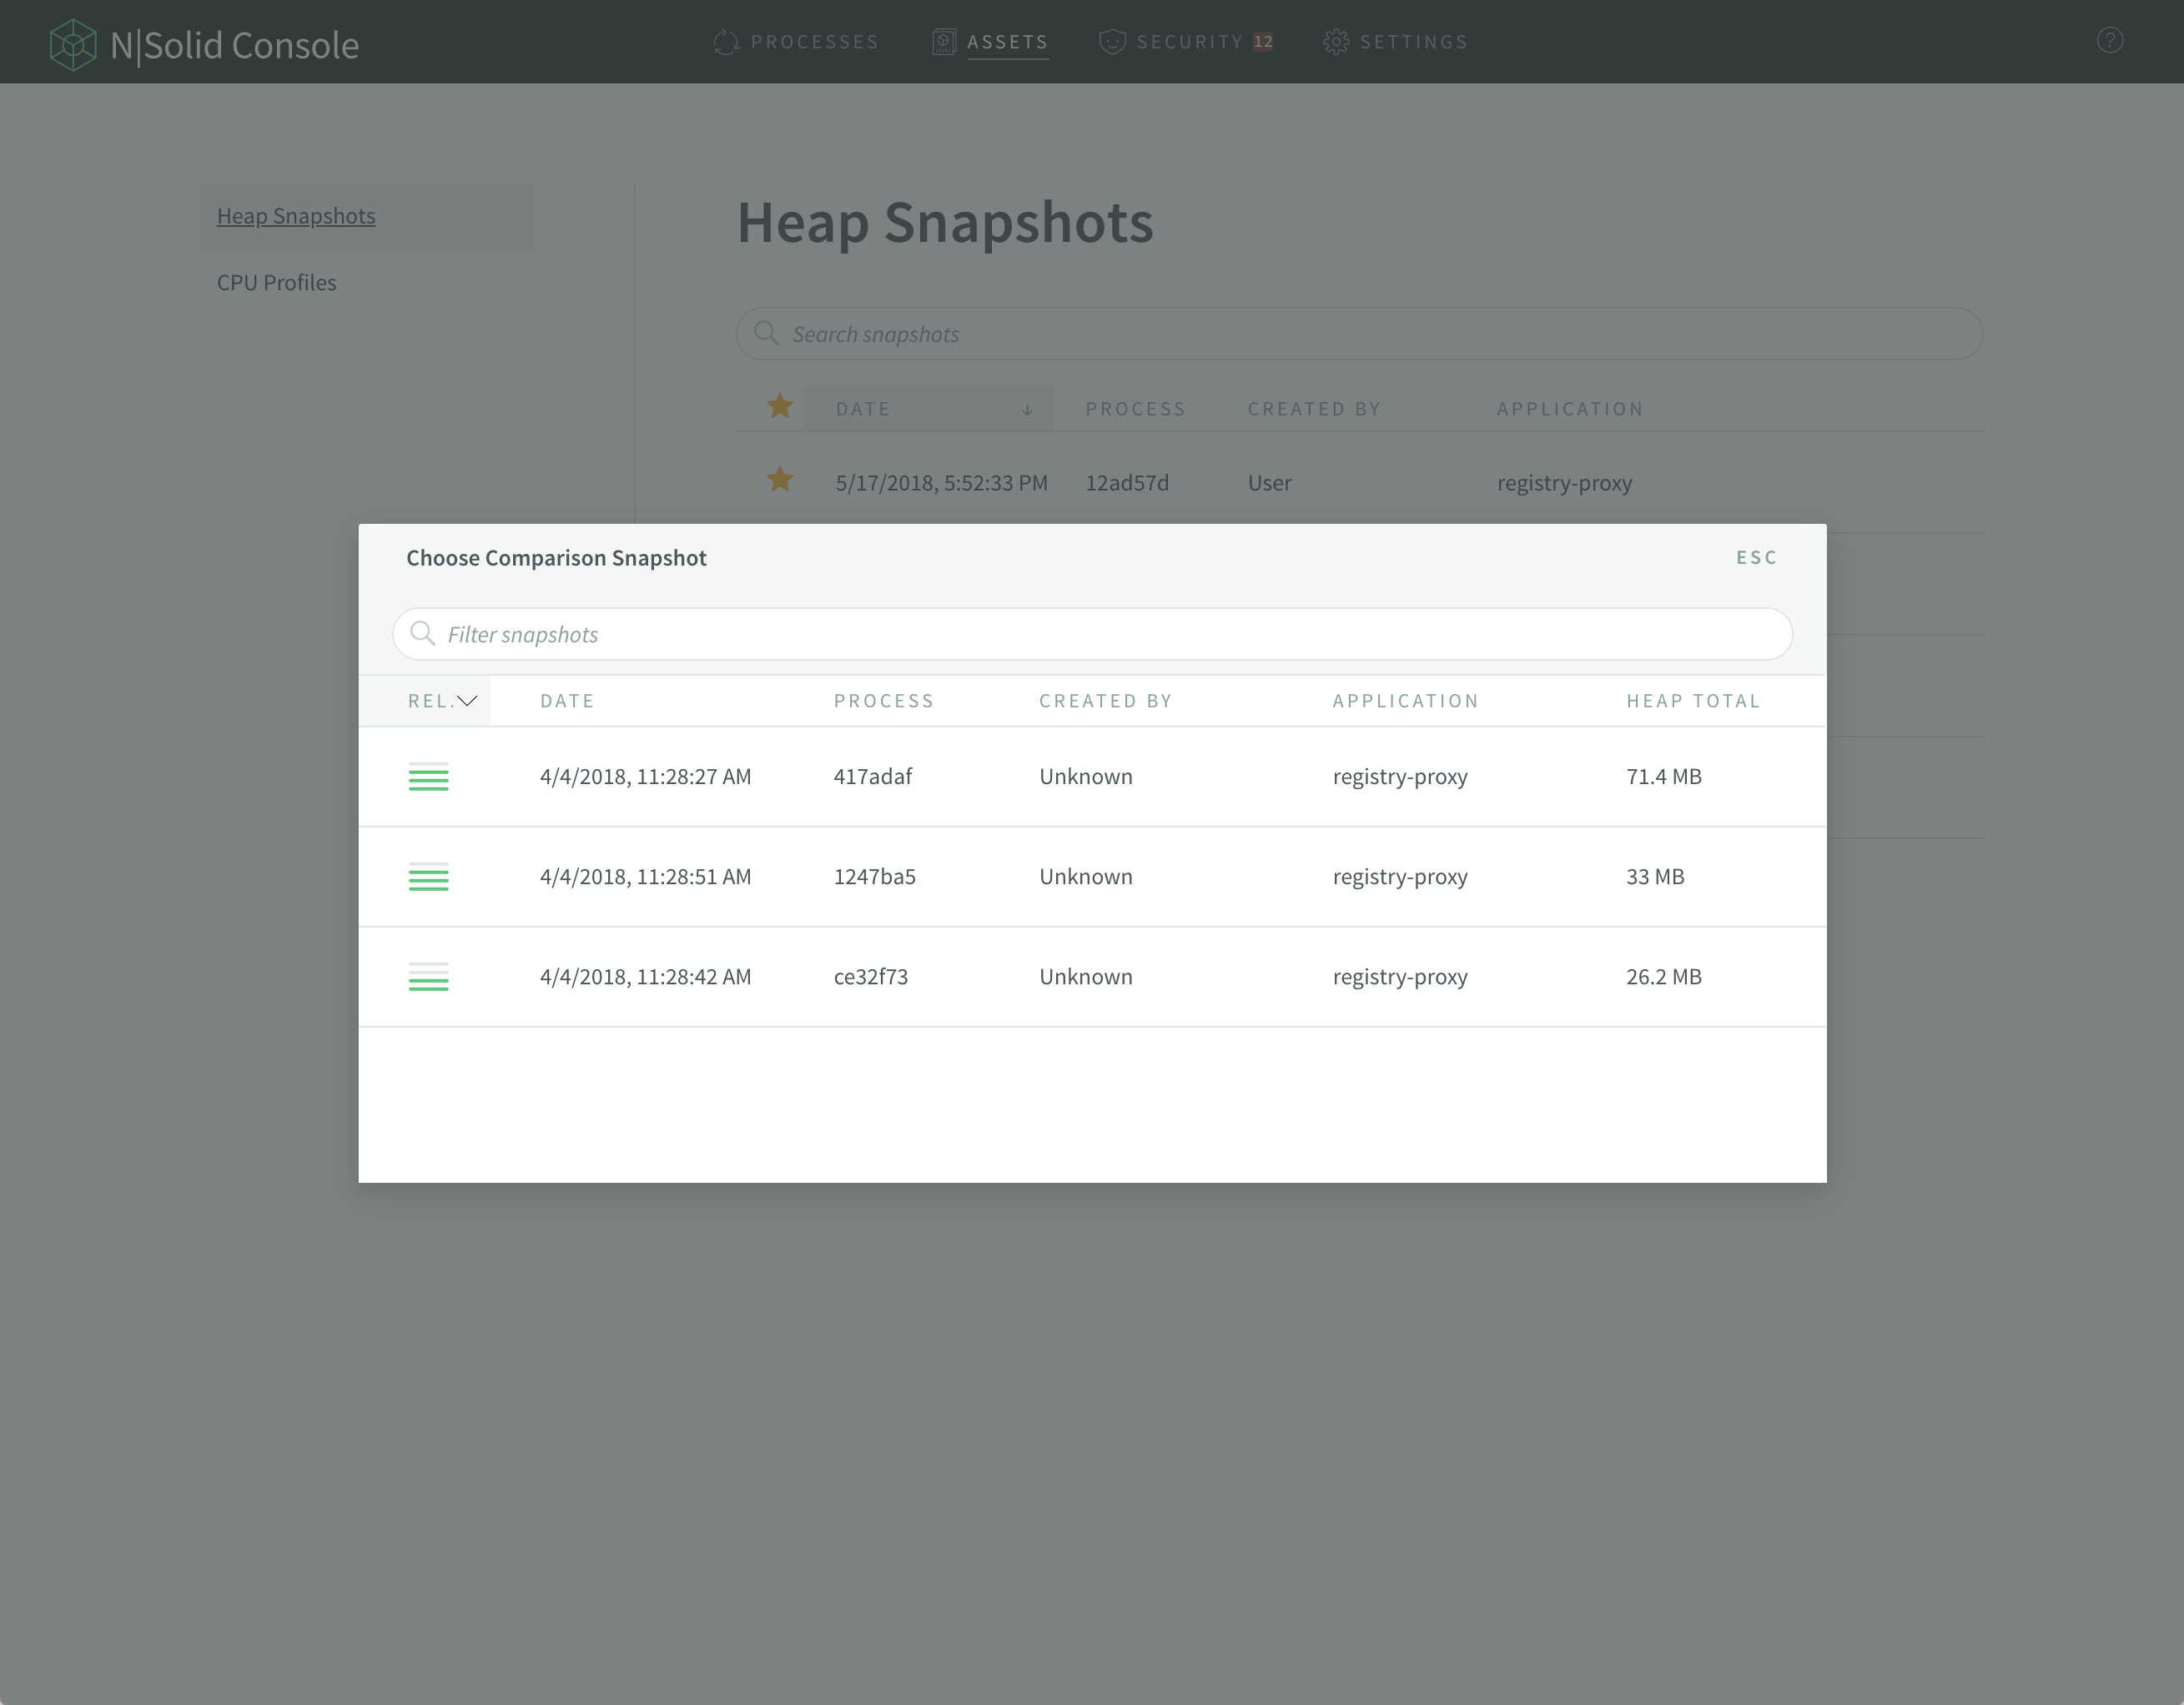
- Hover over a heap snaphot to use as the baseline for the comparison, then click on the snapshot comparison button:

- Filter through the list of comparison snapshots, selecting one taken from the same application after the leak has ballooned the total heap size:
- Both snapshots will be presented side-by-side:
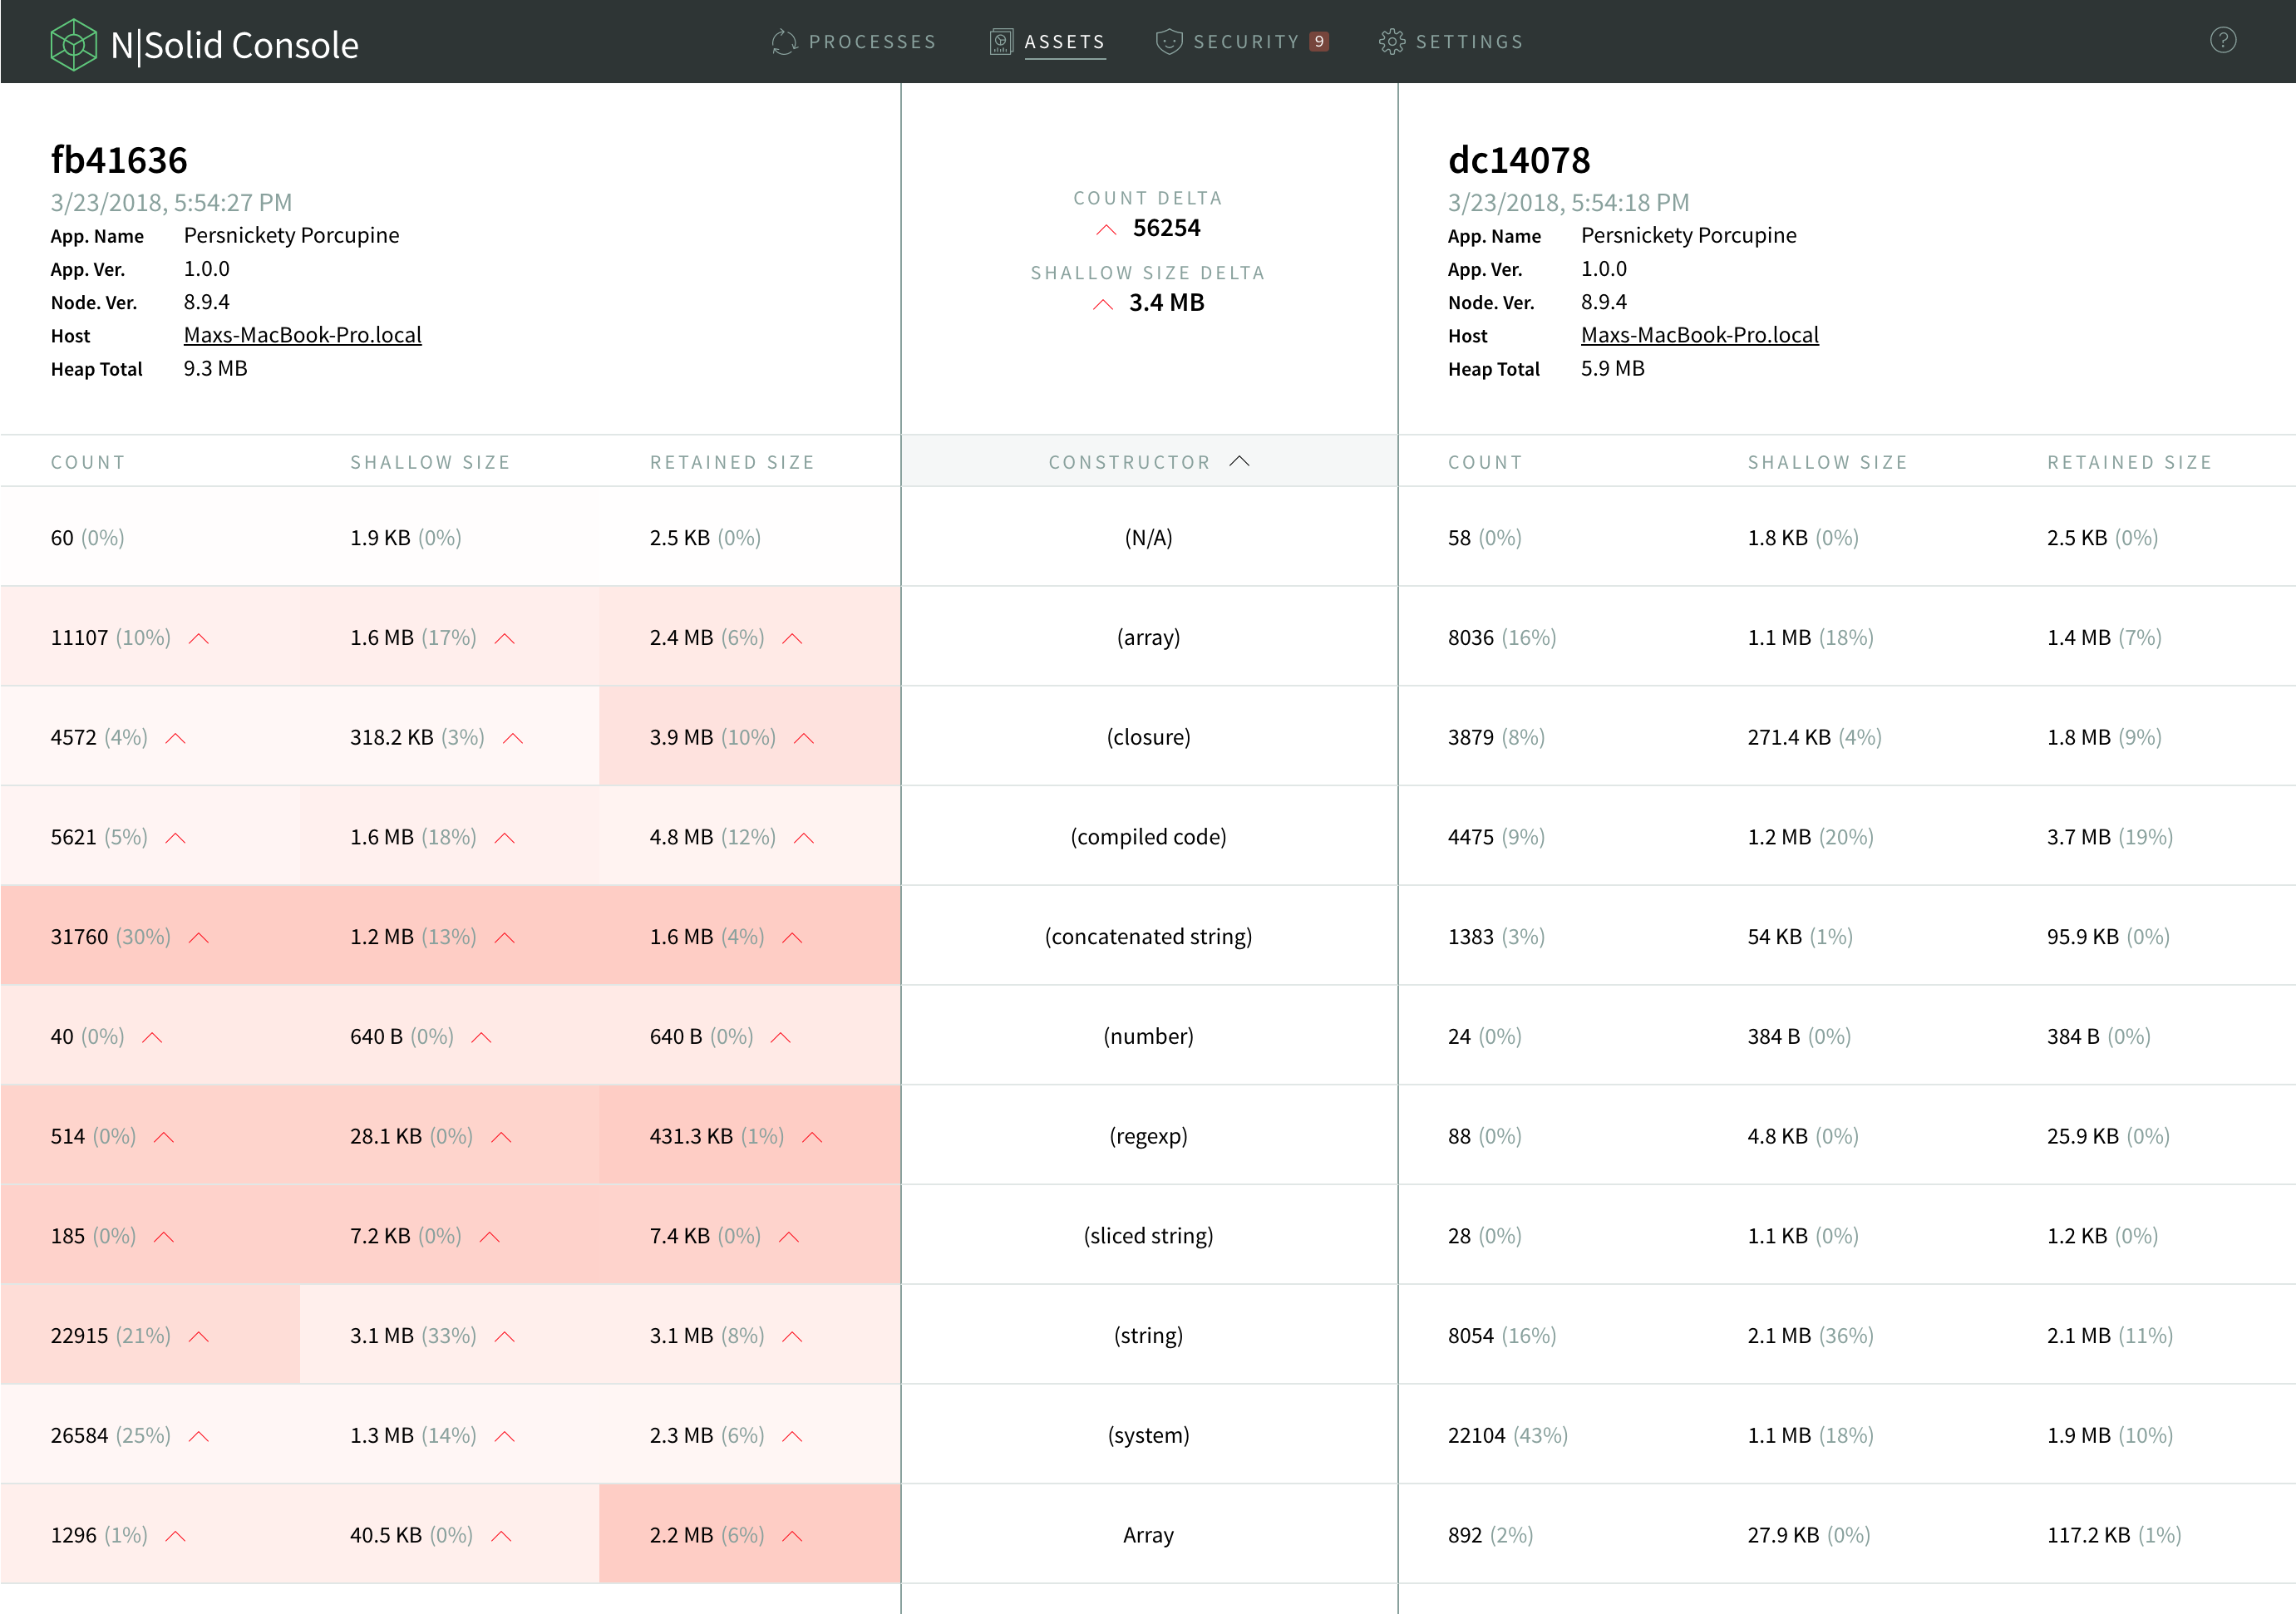
In the area above the tabular data section, summary information for each snapshot is presented. Hovering over a particular row will display calculated differences between the two snapshots in the middle header area (the count, shallow size and retained size deltas.) To view the total snapshot-wide count and shallow size deltas, simply move the mouse pointer so that no rows are hovered.
Detailed differences between the two snapshots are shown in the section below the headers. Cells on the left-hand snapshot will be colored, reflecting the percentage difference within the row.
The redder the cell, the greater the value has increased over the corresponding value in the other snapshot. Greener cells indicate the reverse. When the percentage difference is below 5% of the other snapshot's value, no arrow will be displayed. (NB: this percentage difference is different from the percentage displayed inside the cell.) A double arrow is displayed when the percentage difference is above 20% of the other snapshot's value.
- Sort on
Shallow Size, in descending order, to find the constructor responsible for the largest heap allocation. The constructor of interest is likely to be near the top of this list.
Taking Heap Snapshots from the Command Line Interface (CLI)
N|Solid's Command Line Interface (CLI) is a great way to quickly take heap snapshots from remote processes for local examination. You can learn more about the snapshot command in the N|Solid Command Line Interface (CLI) reference.
Heap Snapshots Using the N|Solid Node API
Use the N|Solid Node API to programmatically create a heap snapshot from within your application. The resulting snapshot(s) can be saved to your N|Solid Console. Heap Snapshots can be taken asynchronously and synchronously.
The following code snippet takes a heap snapshot asynchronously:
const nsolid = require('nsolid')
nsolid.snapshot(err => {
  if (err) {
    // The snapshot could not be created!
  }
})
The following code snippet takes a heap snapshot synchronously:
const nsolid = require('nsolid')
try {
  nsolid.snapshot()
} catch (err) {
  // The snapshot could not be created!
}
Best Practices
Using constructors will show class names in heap snapshots. Since the heap snapshot groups objects by constructor name, if at all possible you should use named constructors for objects you would like to track, as opposed to using literal objects. Literal objects will be aggregated under the Object constructor name.
For instance, the following code snippet creates objects which will be categorized under the Object constructor:
trackableObject = {x: "some value", y: "another value"}
To be able to track trackableObject in a snapshot, make it an instance of a specifically named class:
trackableObject = new TrackableObject()
trackableObject.x = "some value"
trackableObject.y = "another value"
// ...
function TrackableObject() {}
You'll then see these objects grouped by themselves in the heap snapshot.
For more of an "inline" feel, you can enhance your constructor to take initialization values:
trackableObject = new TrackableObject({x: "some value", y: "another value"})
// ...
function TrackableObject(initialValue) {
  this.x = initialValue.x
  this.y = initialValue.y
With EcmaScript 6 parameter destructuring, you can make it a little shorter:
trackableObject = new TrackableObject({x: "some value", y: "another value"})
// ...
function TrackableObject({x, y}) {
  this.x = x
  this.y = y
}
You can also make the constructor open-ended regarding the properties:
trackableObject = new TrackableObject({x: "some value", y: "another value"})
// ...
function TrackableObject(initialValue) {
  for (var key in initialValue) {
    this[key] = initialValue[key]
  }
}
