CPU Profiling
Analyzing Profiles Using the N|Solid Console
The N|Solid Console allows you to generate and analyze profiles in one action. This is particularly useful if you need to take a series of profiles, as it avoids the overhead of switching between environments. The console also saves a profile history, simplifying navigation between profiles when troubleshooting.
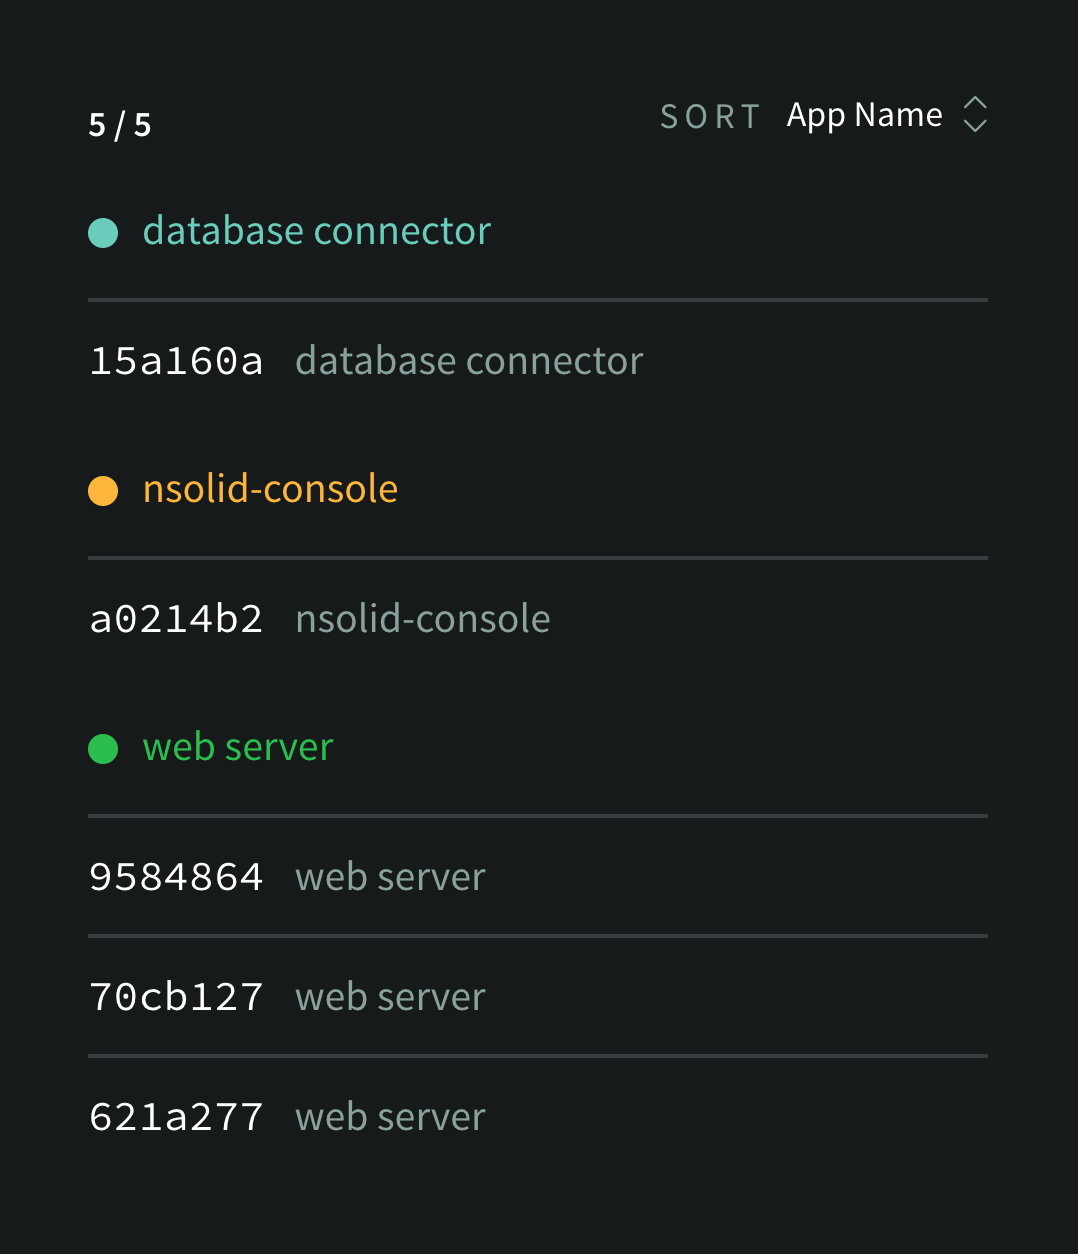
- Launch the console and select the process of interest.

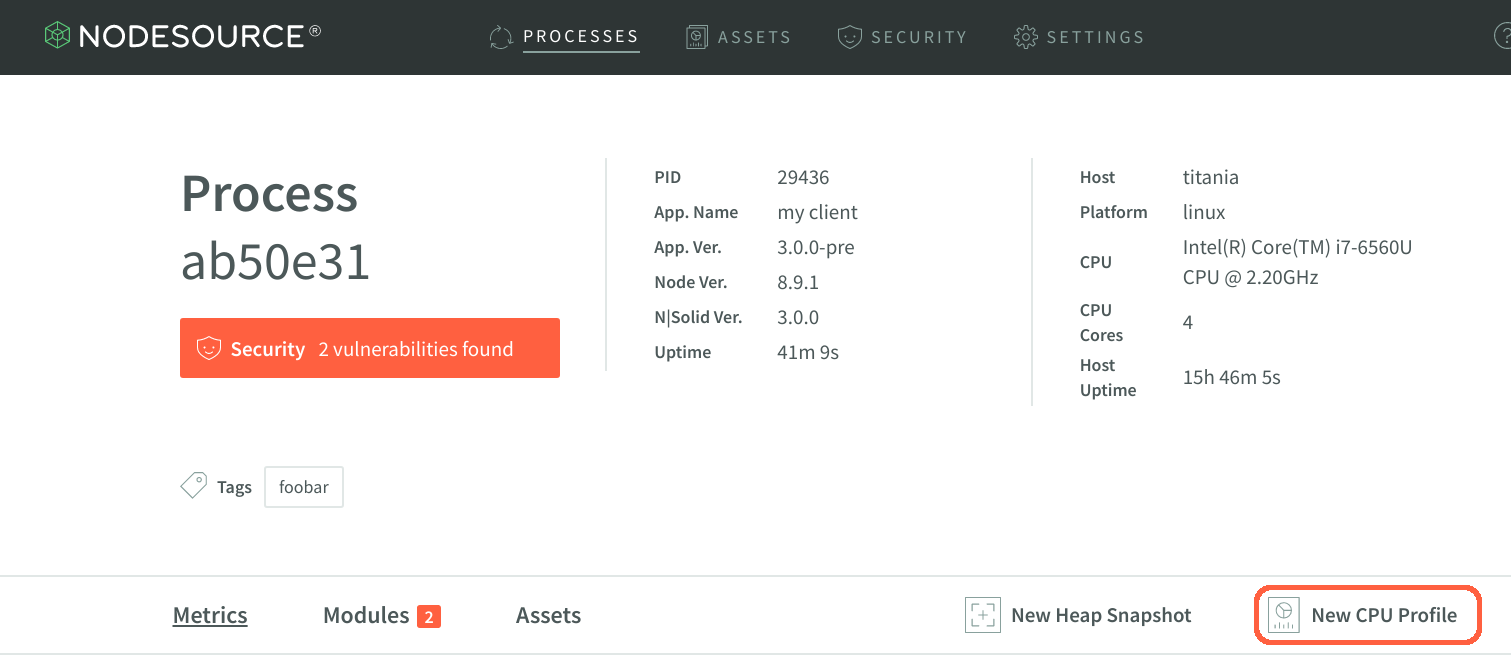
- On the process details page, click the New CPU Profile button.

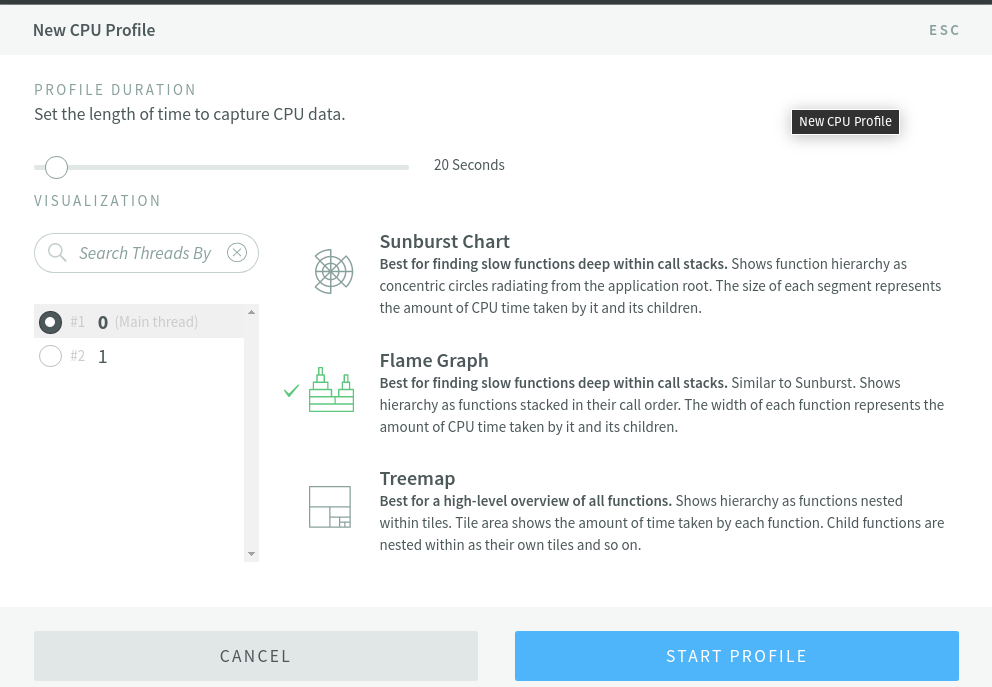
- Select your profile window (5 to 60 seconds), the thread you want to profile (0 is the main thread, the rest of them are worker threads) and desired visualization style and run profile.

- N|Solid Console will pop up a green notification bar across the top of the screen when the profile is complete. Click it to view your new CPU profile.

For convenience, profiles are saved in your console session so you can easily flip between profiles. If your application ends before the profile is complete, N|Solid will try to save the profile data generated so far. If it is able to do so, your profile will be viewable under the Assets tab of the process detail page.
Visualizations Explained
Visualizations
All of the visualizations available for profile data show the unique set of stack traces captured during the profile, with the "area" of the stack indicating the proportional time spent in a function compared to that of its parent.
The Flame Graph visualization shows the time along the x-axis. The y-axis is used to show the function calls that make up a particular stack trace.
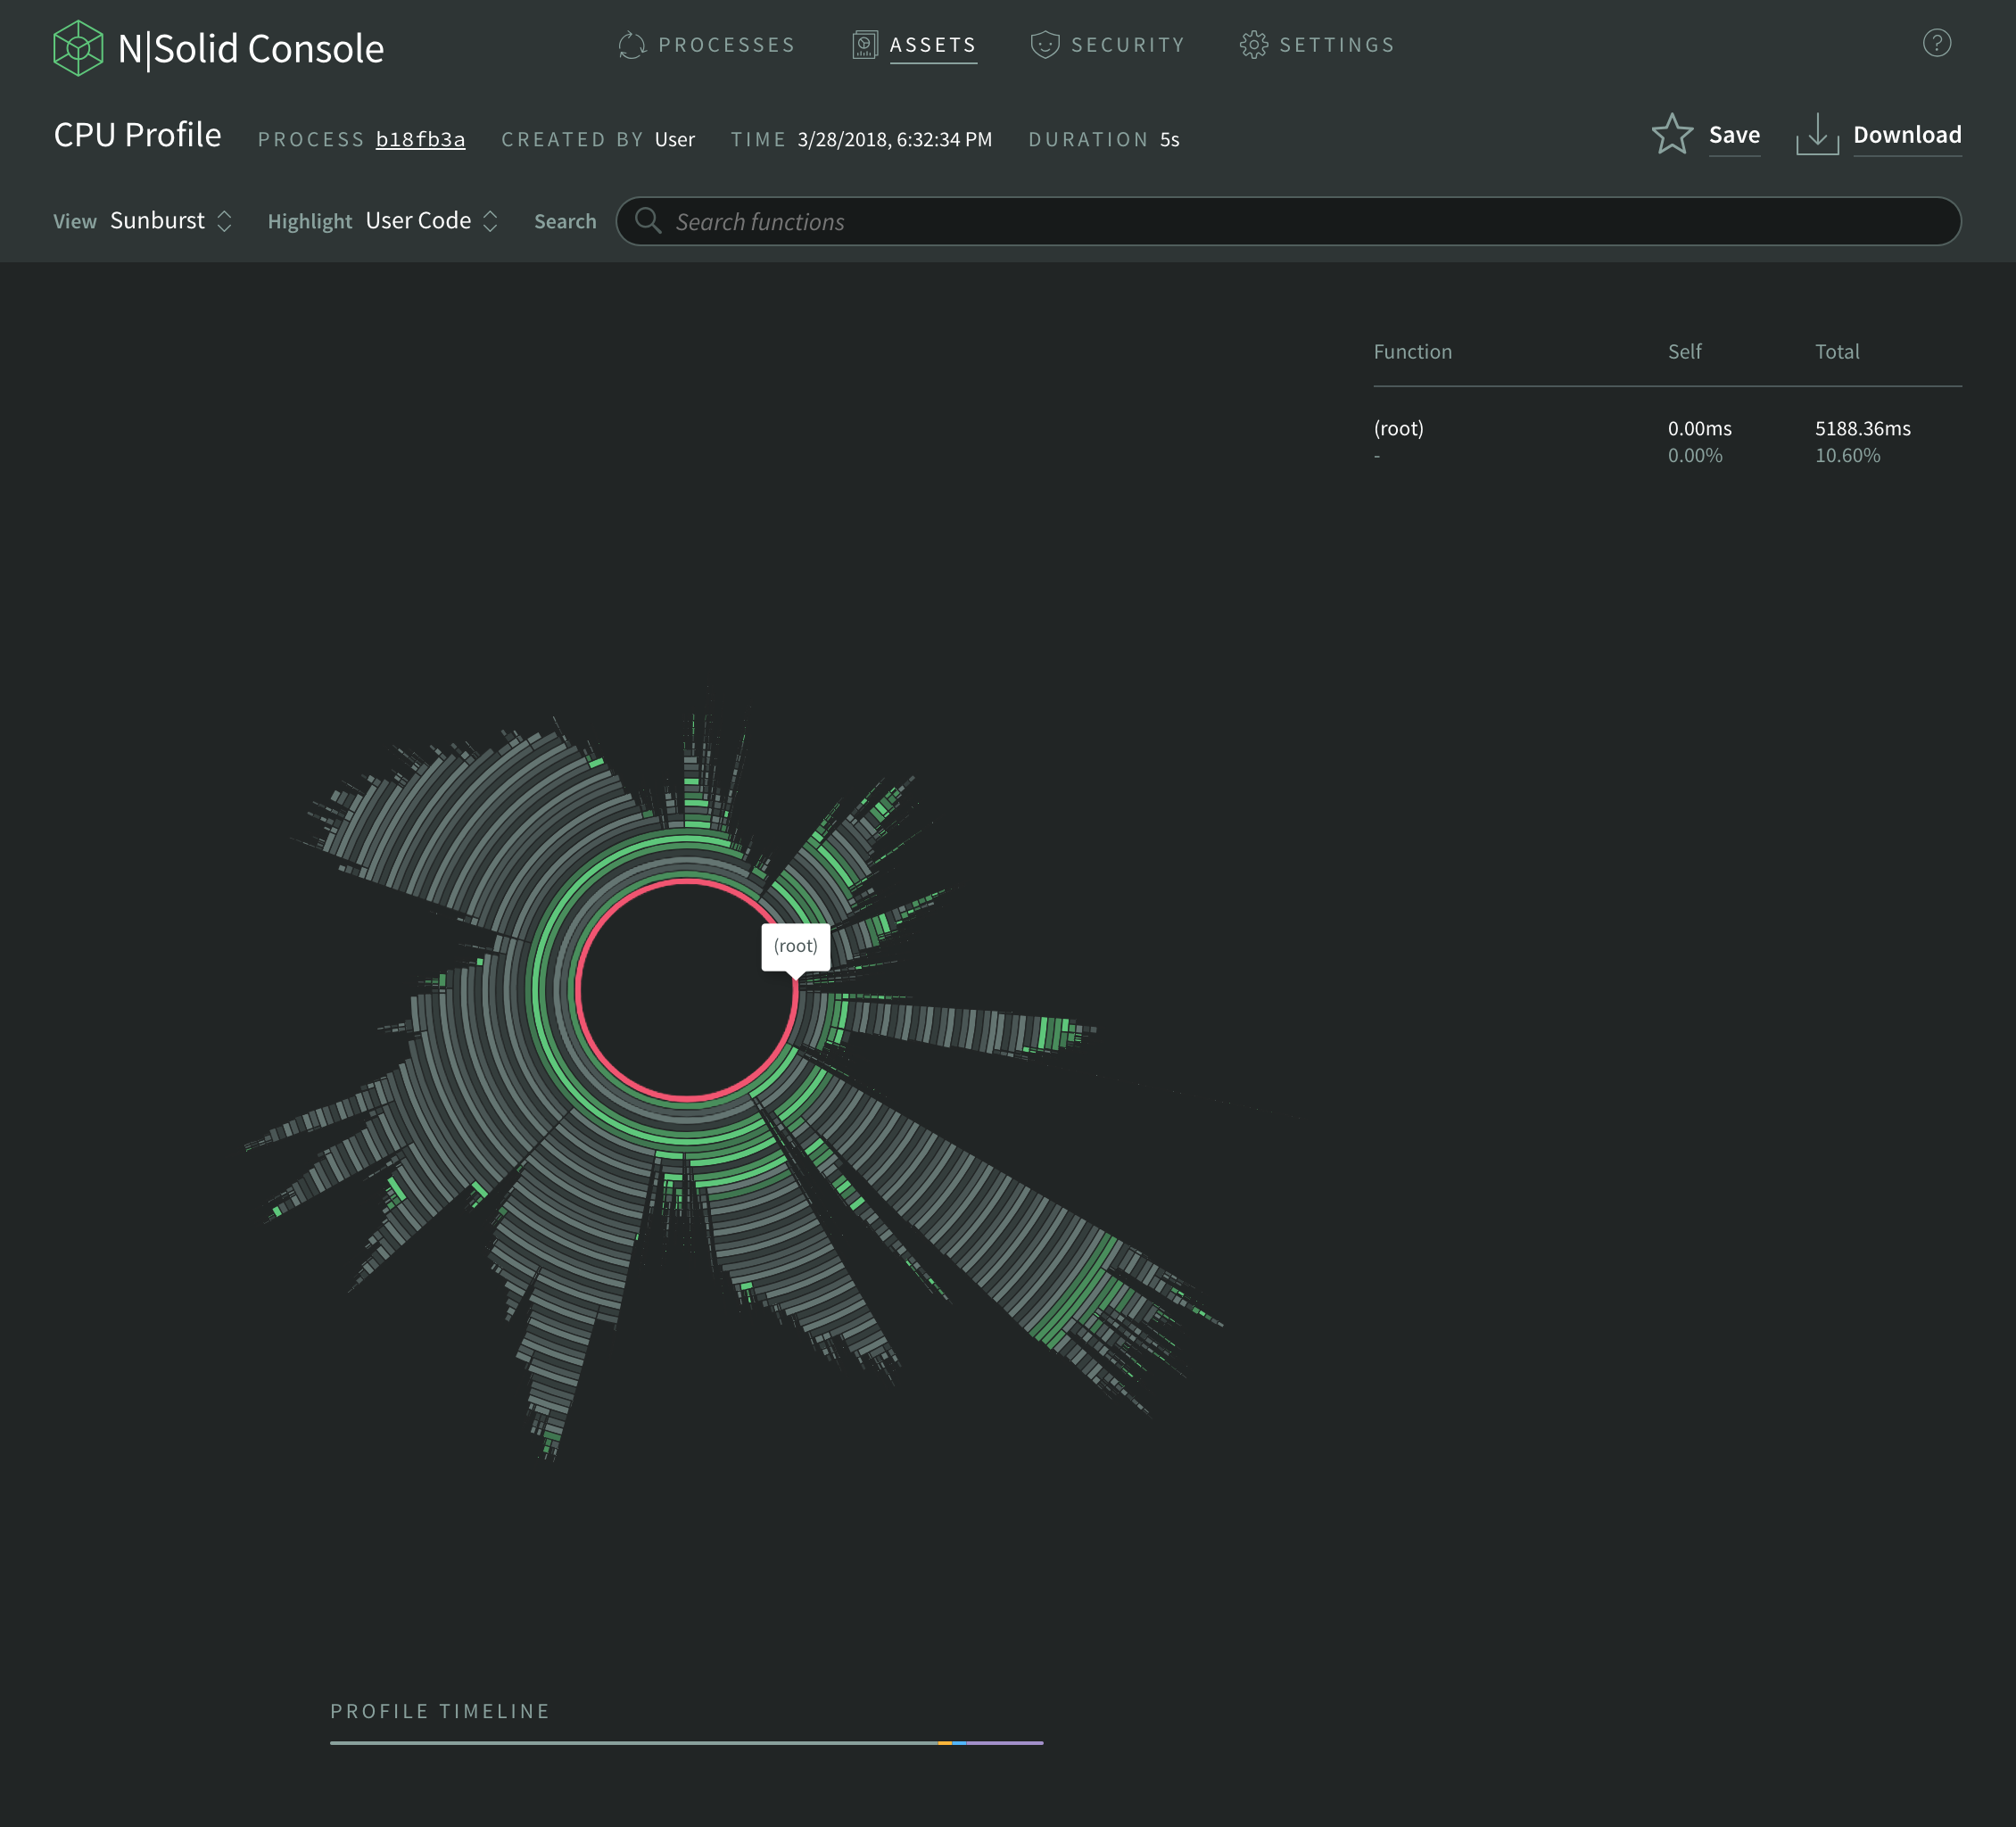
The Sunburst visualization is like the Flame Graph, where the x-axis is curved into a circle. Stack traces grow from the center to the outer parts of the graph.
The Treemap visualization shows time by area. The larger the rectangle, the more time a function took. The stack traces grow from the outer boxes into the inner boxes.
You can use the visualizations to find long-running functions. These can be identified by:
- wide rectangles in the Flame Graph
- long radial sections in the Sunburst
- large areas in the Treemap
The stack trace height - how many functions deep a particular stack trace went - does not necessarily indicate a time issue. Focus on interpreting the time values as discussed above.
As you hover over the visualization itself, the function represented by the visualization will be shown. Clicking will show a stack trace to the right of the visualization.
When analyzing CPU profiles with the N|Solid Console visualizations, pay careful attention to stack trace entries that take up the most area. This is displayed as a factor of width in the Flame Graph, circumference in the Sunburst, and area in the Treemap.
Code Highlighting
Code highlighting shows the origin of each function. This makes it easier to determine the source of performance issues by selectively highlighting only one of the following categories of functions at a time:
- None: don't highlight anything.
- User Code: your application code. Selected by default.
- Core Code: any module compiled into the Node.js/N|Solid core, e.g.,
fs,http,net. - 3rd Party Code: any module installed into
node_modules/, including those authored by you and/or the organization you belong to.
Search
The search field allows you to search for nodes with matching function names and paths across the entire profile. It is case-sensitive, and only the first 500 matching results will be displayed.
Analyzing Profiles Using N|Solid and the Chrome Profiler
You can also view the generated CPU profile in Chrome Dev Tools:
- Click the Download Profile button on the left side of the screen
- Open the Chrome web browser
- Open Chrome Dev Tools from the overflow menu (the three dots in the right-hand side of the browser), hover
More toolsoption, and click onDeveloper tools(or pressctrl + shift + i,cmd + alt +ion macOS) - You will see the
Performancetab come up. Click theLoad profilebutton (up arrow logo) that appears in the left-hand pane under this tab. - Find the .cpuprofile file that was downloaded, and click the Open button
- A CPU profile chart will appear in the Performance tab
- Below it you will be able to see the Chart, Heavy (Bottom Up), and Tree (Top Down) views by selecting the respective entry in the dropdown menu located immediately above the CPU profile chart.
In addition to function execution times, the CPU profile chart also shows what functions were on the stack at the time the process was sampled.
Profiling Using the Command Line Interface (CLI)
N|Solid's Command Line Interface (CLI) is a great way to quickly pull profiles from remote processes for local examination. You can learn more about the profile command in the N|Solid Command Line Interface (CLI) reference.
Profiling Using the N|Solid Node API
The N|Solid Node API provides an efficient way to trigger a CPU Profile programmatically from within your application and have the resulting profile saved to your N|Solid console. The profile duration can be up to 600000 milliseconds, which is the default if none is specified.
const nsolid = require('nsolid')
nsolid.profile(durationMilliseconds, err => {
  if (err) {
    // The profile could not be started!
  }
})
To complete your profile before the duration expires, call profileEnd:
nsolid.profileEnd(err => {
  if (err) {
    // Error stopping profile (was one running?)
  }
})
