Serverless
NodeSource offers Serverless support to collect data during a request in serverless settings. This data aids in debugging latency and other issues, making it ideal for those keen on addressing such problems in a serverless context.
AWS Setup
For using AWS resources, you need to configure the AWS SDK credentials. Check the AWS documentation to do this. After following the guide, your AWS CLI should be set up correctly for smooth AWS interactions.
Make sure you have all AWS credentials envs configured in your machine.
| Env |
|---|
| AWS_SECRET_ACCESS_KEY |
| AWS_DEFAULT_REGION |
| AWS_ACCESS_KEY_ID |
Configuration
Using nsolid-serverless, you can create the necessary infra resources and configure your serverless application to send telemetry data to the N|Solid Console.
Install
> npm i -g @nodesource/nsolid-serverless
Cratting basic infra to collect data
The first step is to create a SQS Queue where we will send the telemetry data.
> nsolid-serverless infra --install
Collecting telemetry data
We need to setup some environment variables and layers in your lambdas to send data to our SQS queue created in the previous step.
> nsolid-serverless functions --install
Help
> nsolid-serverless --help
Adding Integration
After all the functions are set up, you need to configure the N|Solid Console.
Navigate to Settings > Integration. On the right side, there is a section called AWS SQS INTEGRATION as below:
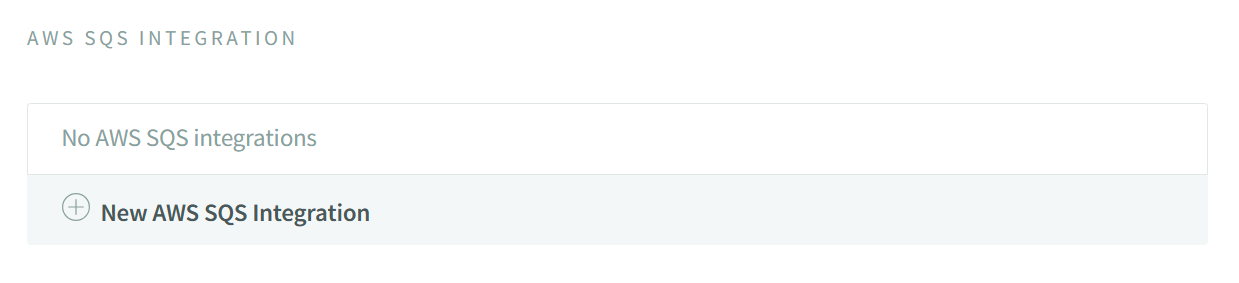
Click on the New AWS SQS Integration button to add the integration. The following form will be displayed:
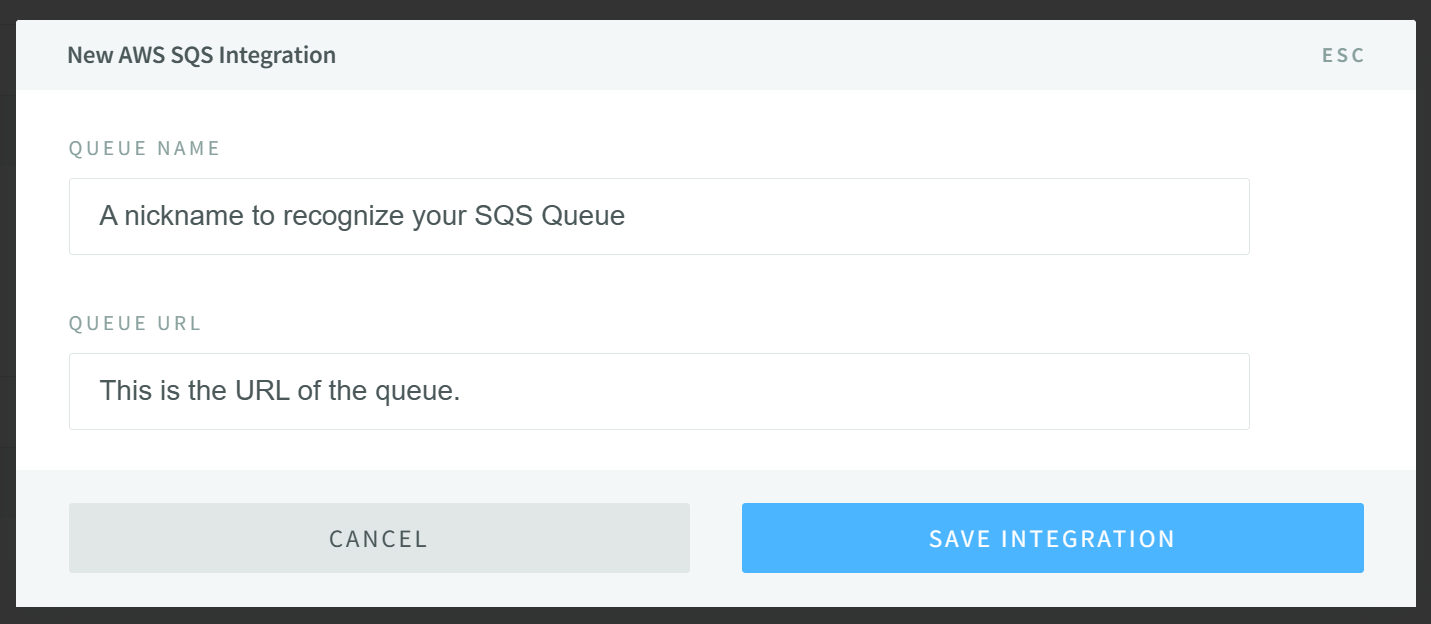
Fill in the form with the following information:
- Queue Name: The name of the integration.
- Queue URL: https://sqs.\{region}.amazonaws.com/\{account-id}/nsolid-serverless-metrics
Click on the Save Integration button to save the integration.
Monitoring Serverless via N|S Console UI
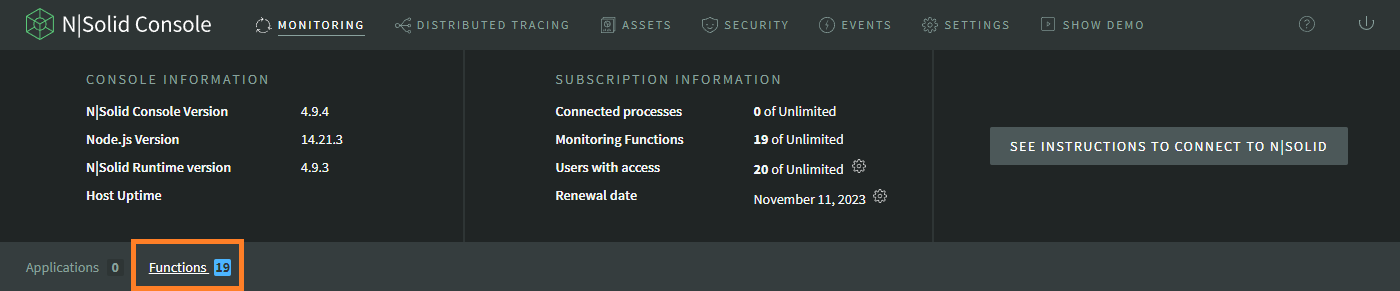
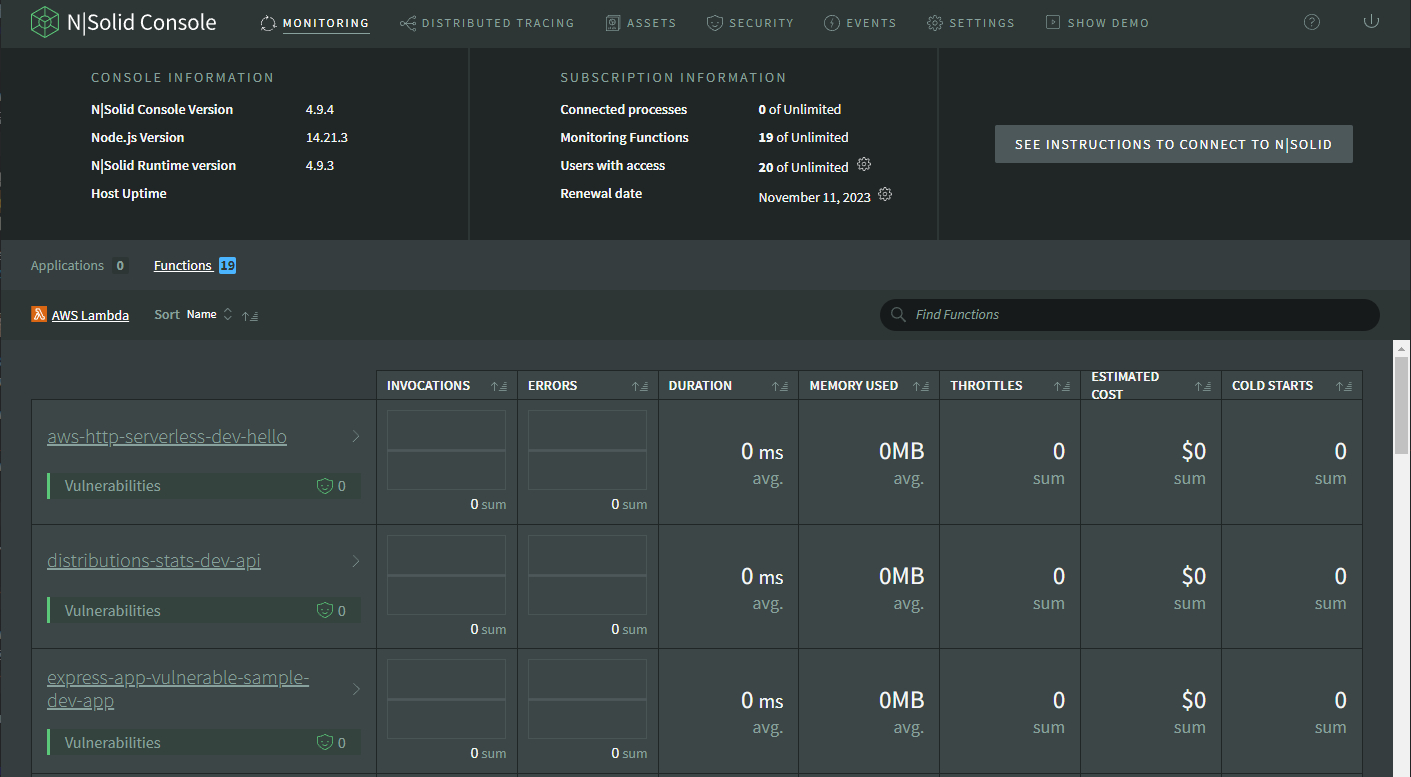
In the N|Solid Console, go to the the applications dashboard and tab the Functions on the left side.
The dashboard for the functions connected will be displayed as below:
FUNCTION DETAIL VIEW
Select a function from the list to see the details of the function. The detail view will be displayed as below:
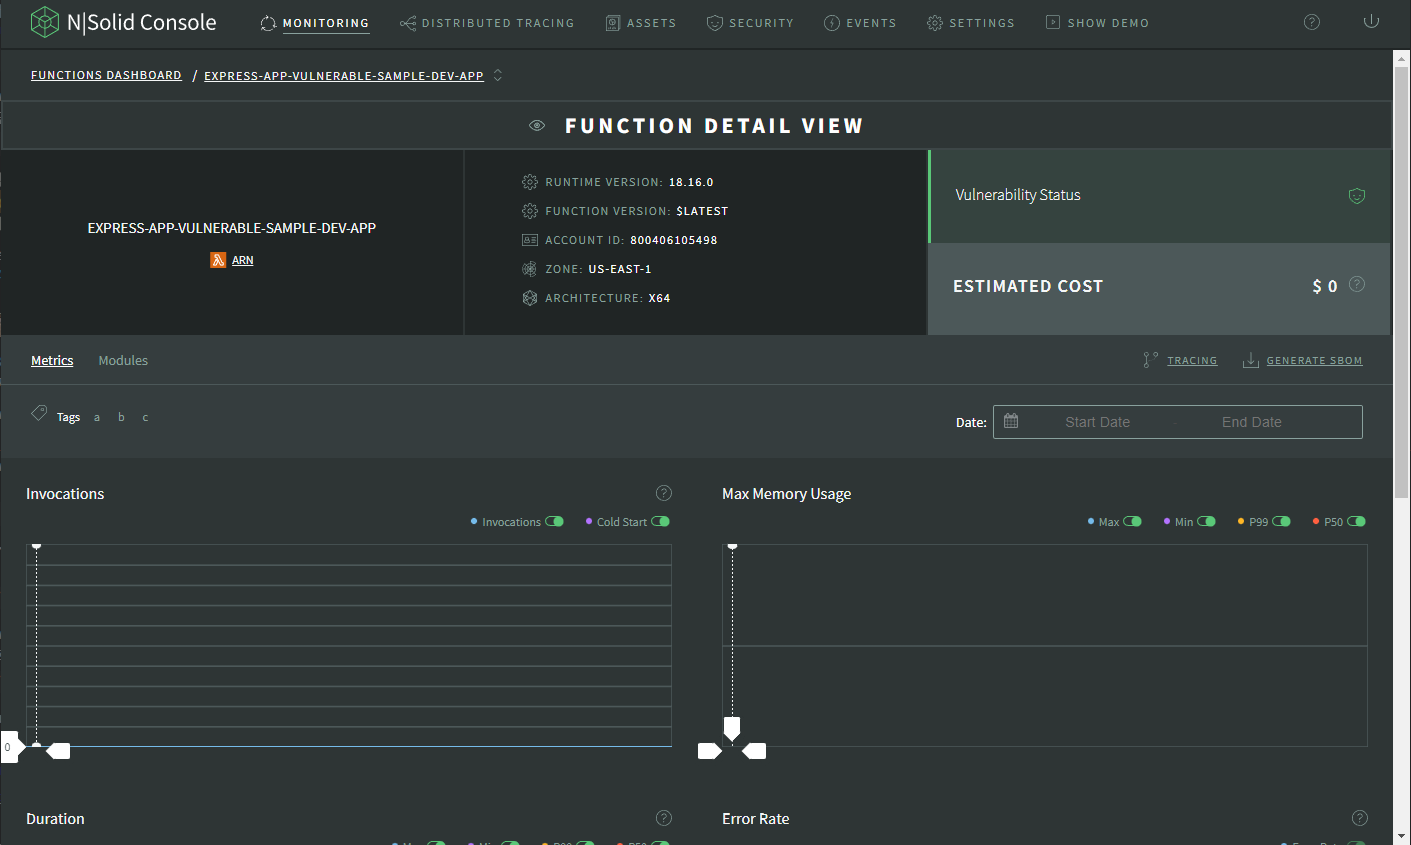
The detail view will display the following information:
- RUNTIME VERSION: The version of the Node.js runtime used by the function.
- FUNCTION VERSION: The version of the function.
- ACCOUNT ID: The account ID of the function.
- ZONE: The zone of the function.
- ARCHITECTURE: The architecture of the function.
- ESTIMATED COST: The estimated cost of the function.
Metrics
The metrics tab will display the metrics of the function. The metrics will display the following information:
Telemetry API Metrics
This is the list of metrics we will be generating that come from the Telemetry API. These metrics are real-time and associated to specific functions. Their corresponding aggregations are to be performed in the Telemetry Aggregator.
- duration: The duration of the function in milliseconds.
- initDuration: The duration of the function initialization in milliseconds.
- billedDuration: The duration of the function billed in milliseconds.
- invocations: The number of invocations of the function.
- maxMemoryUsed: The maximum memory used by the function in megabytes.
- errors: The number of errors of the function.
- responseDuration: The duration of the response of the function in milliseconds.
- responseLatency: The latency of the response of the function in milliseconds.
- producedBytes: The number of bytes produced by the function.
- timeouts: The number of timeouts of the function.
- estimatedCost: The estimated cost of the function.
Cloudwatch Metrics
These metrics are extracted directly from the Cloudwatch API by the Lambda Metrics Forwarder and are not real-time as the ones from the Telemetry API. The list is:
- Invocations: The number of invocations of the function.
- Errors: The number of errors of the function.
- DeadLetterErrors: The number of dead letter errors of the function.
- DestinationDeliveryFailures: The number of destination delivery failures of the function.
- Throttles: The number of throttles of the function.
- ProvisionedConcurrencyInvocations: The number of provisioned concurrency invocations of the function.
- ProvisionedConcurrencySpillOverInvocations: The number of provisioned concurrency spill over invocations of the function.
- ConcurrentExecutions: The number of concurrent executions of the function.
- ProvisionedConcurrentExecutions: The number of provisioned concurrent executions of the function.
- ProvisionedConcurrencyUtilization: The utilization of the provisioned concurrency of the function.
- UnreservedConcurrentExecutions: The number of unreserved concurrent executions of the function.
- Duration: The duration of the function in milliseconds.
- PostRuntimeExtensionsDuration: The duration of the post runtime extensions of the function in milliseconds.
- IteratorAge: The age of the iterator of the function.
Loading Opentelemetry Instrumentation Modules
The NSOLID_INSTRUMENTATION environment variable is used to specify and load the opentelemetry instrumentation modules that you want to utilize within your application. To enable instrumentation for specific modules, follow these steps:
-
For HTTP requests using the
httpmodule, set theNSOLID_INSTRUMENTATIONenvironment variable tohttp. -
If you're also performing PostgreSQL queries using the
pgmodule, include it in theNSOLID_INSTRUMENTATIONenvironment variable like this:http,pg. -
Make sure to list all the relevant instrumentation modules required for your application. This will enable tracing and monitoring for the specified modules, providing valuable insights into their performance and behavior.
Tracing
To enable the Tracing using N|Solid, set the env var NSOLID_TRACING_ENABLED=1. By enabling this feature, you can troubleshoot HTTP, DNS and other network request problems that you might encounter using the N|Solid Console.
The view will be shown as below:
Tracing is consists of three key components below:
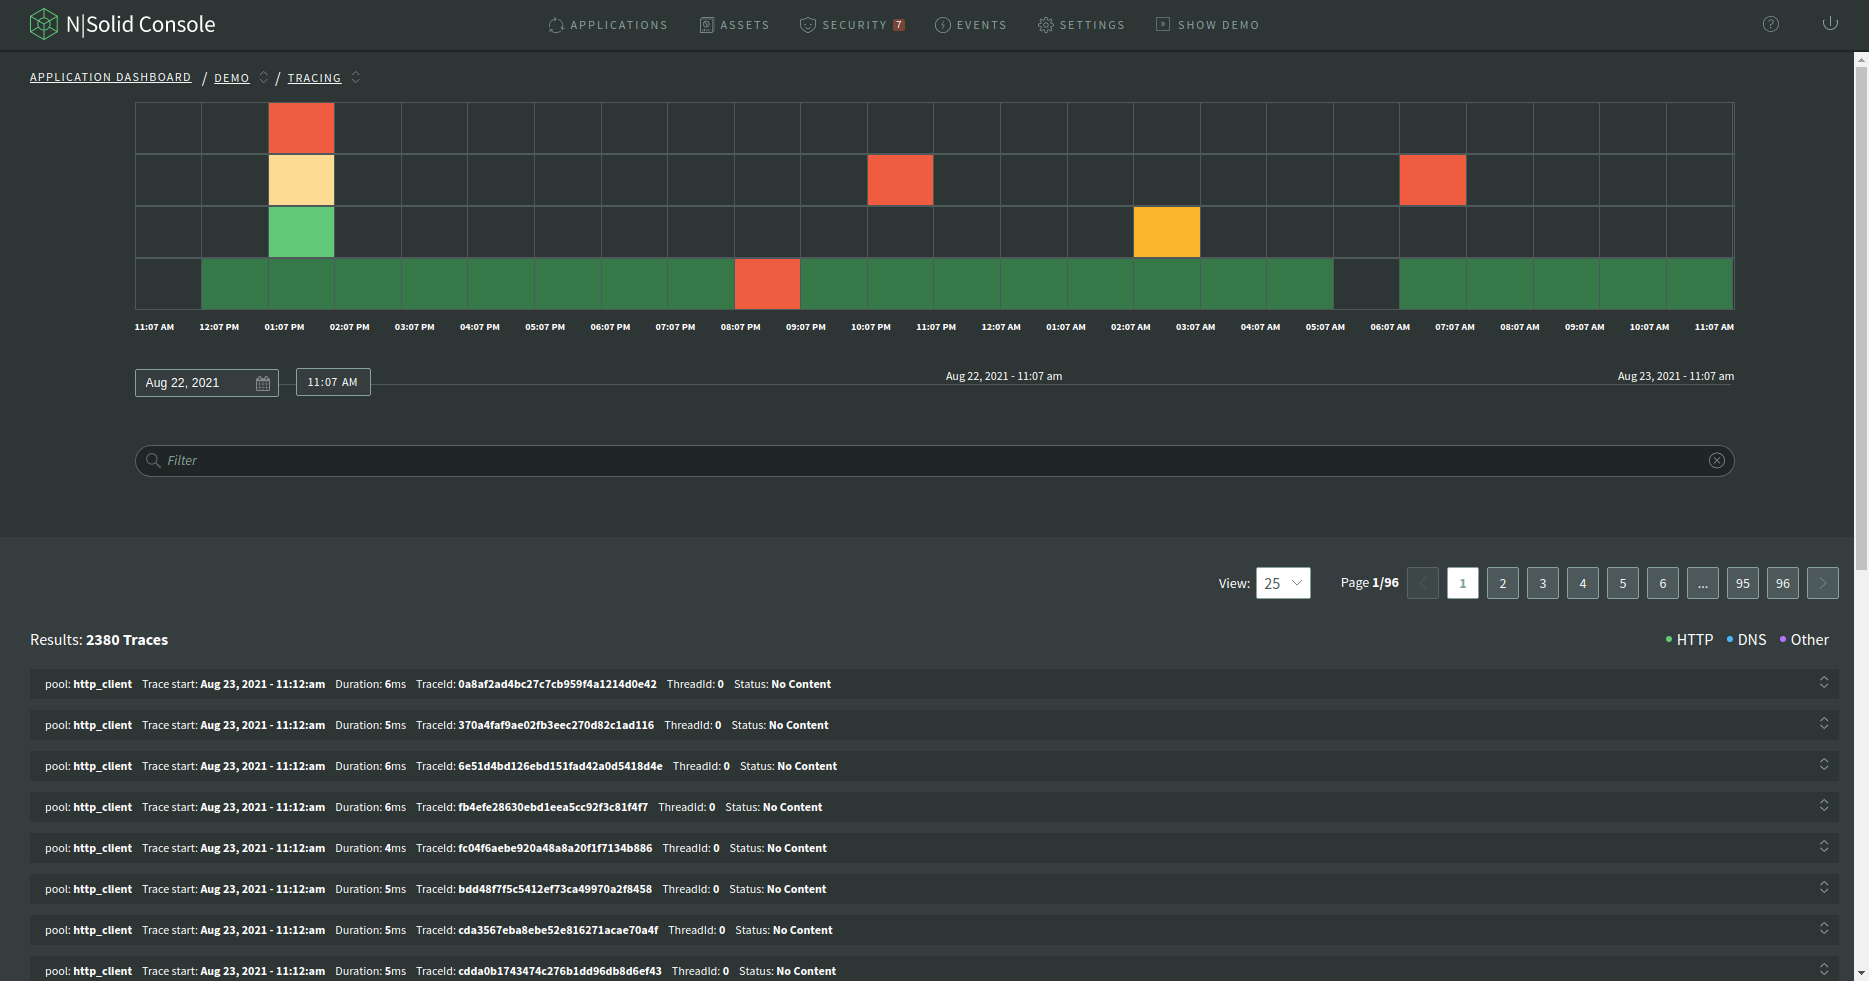
- Timeline Graph: a timeline graph of Tracing data showing the density of the number of tracing spans.
- Filter: a filter input area to filter the results by attributes of the span.
- Spans(Results): a span is the building block of a trace and is a named, timed operation that represents a piece of the workflow in the distributed system. multiple spans are pieced together to create a trace.
Note: The default behavior only generates traces related to the lambda invocation. If you require tracing for additional operations, set the NSOLID_INSTRUMENTATION environment variable.
Available modules for tracing are as follows:
- aws:
AwsInstrumentation - dns:
DnsInstrumentation - graphql:
GraphQLInstrumentation - grpc:
GrpcInstrumentation - http:
HttpInstrumentation - ioredis:
IORedisInstrumentation - mongodb:
MongoDBInstrumentation - mysql:
MySQLInstrumentation - net:
NetInstrumentation - pg:
PgInstrumentation - redis:
RedisInstrumentation
Please ensure you have the necessary modules enabled to trace all the operations you require.
Timeline Graph
A timeline graph displays the density of the number of tracing spans. Below is the description of the color of a slot on the timeline graph:
| Color | Description |
|---|---|
| green | everything is ok |
| yellow | maybe you should look at this |
| red | definitely you should look at this |
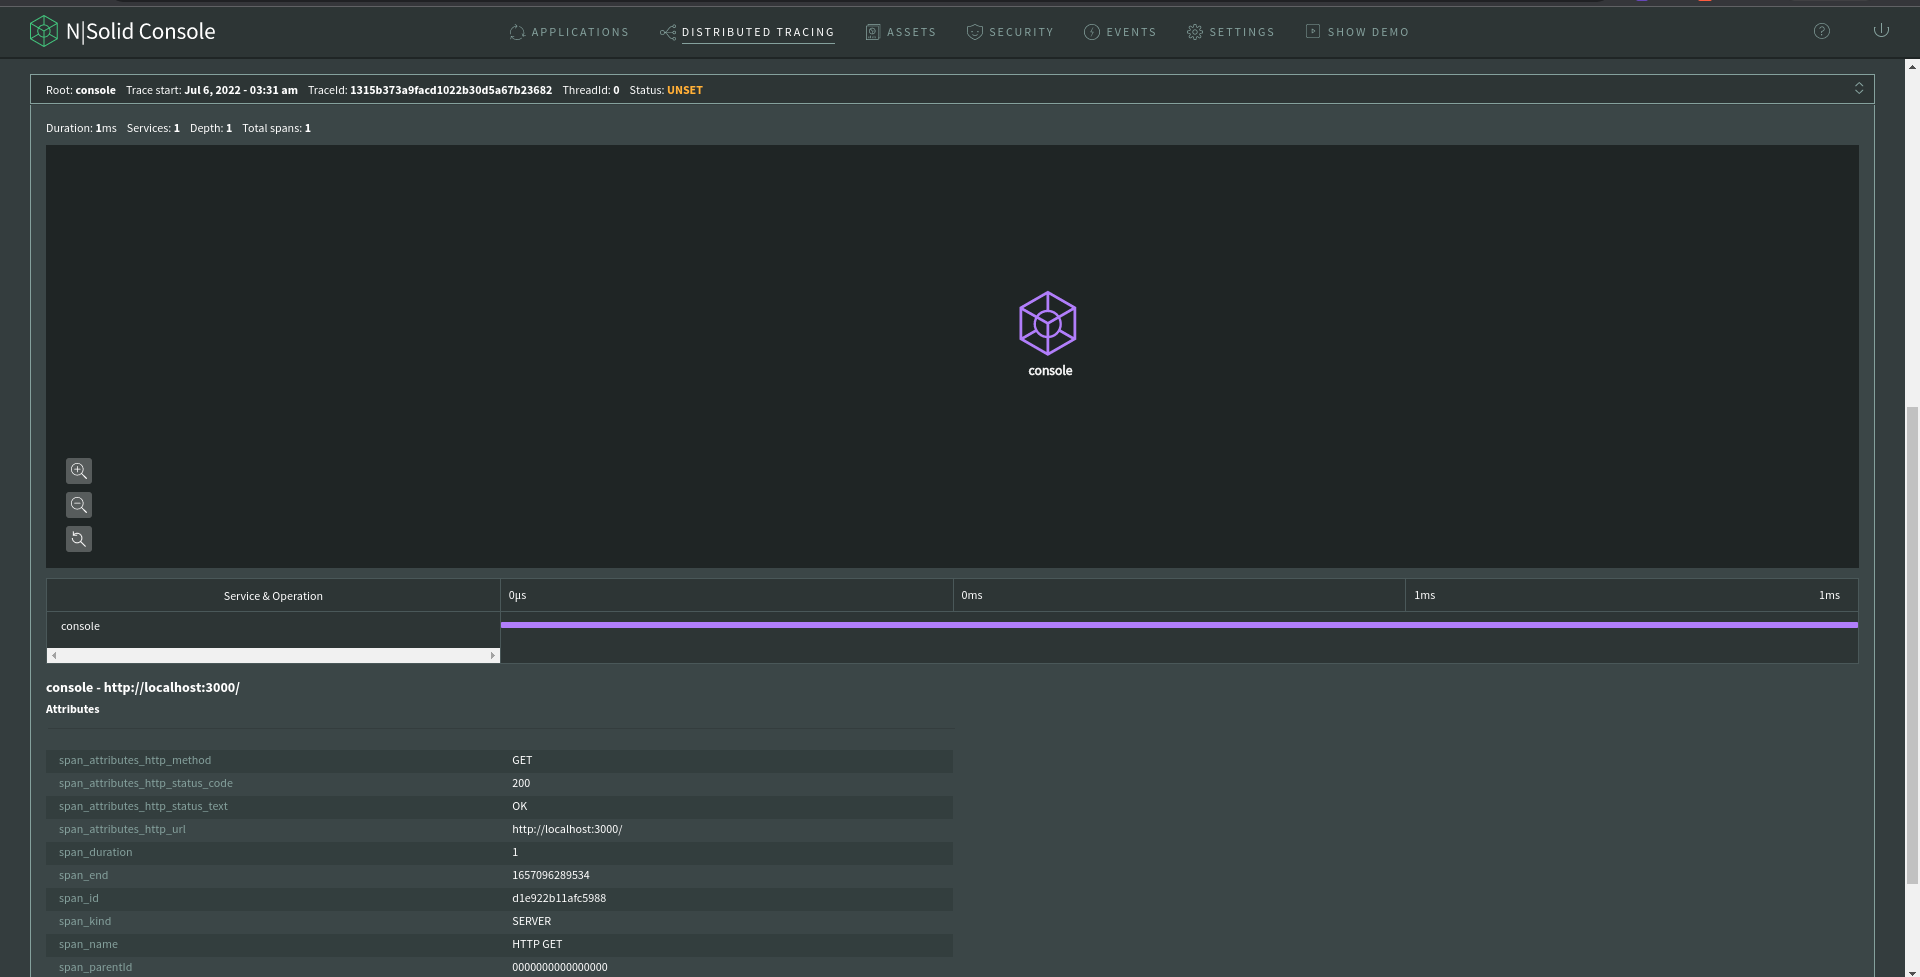
Assume that a simple request was made to the “console” service to monitor traces:
As a result, the Console displays the whole “span” information.
Span
A span is the building block of a trace and is a named, timed operation that represents a piece of the workflow in the distributed system. Multiple spans are pieced together to create a trace.
Traces are often viewed as a tree of spans that reflects the time that each span started and completed. It also shows you the relationship between spans. A trace starts with a root span where the request starts. This root span can have one or more child spans, and each one of those child spans can have child spans.
Inspecting Span Details
To inspect the span details of a span, click on the title Service & Operation:
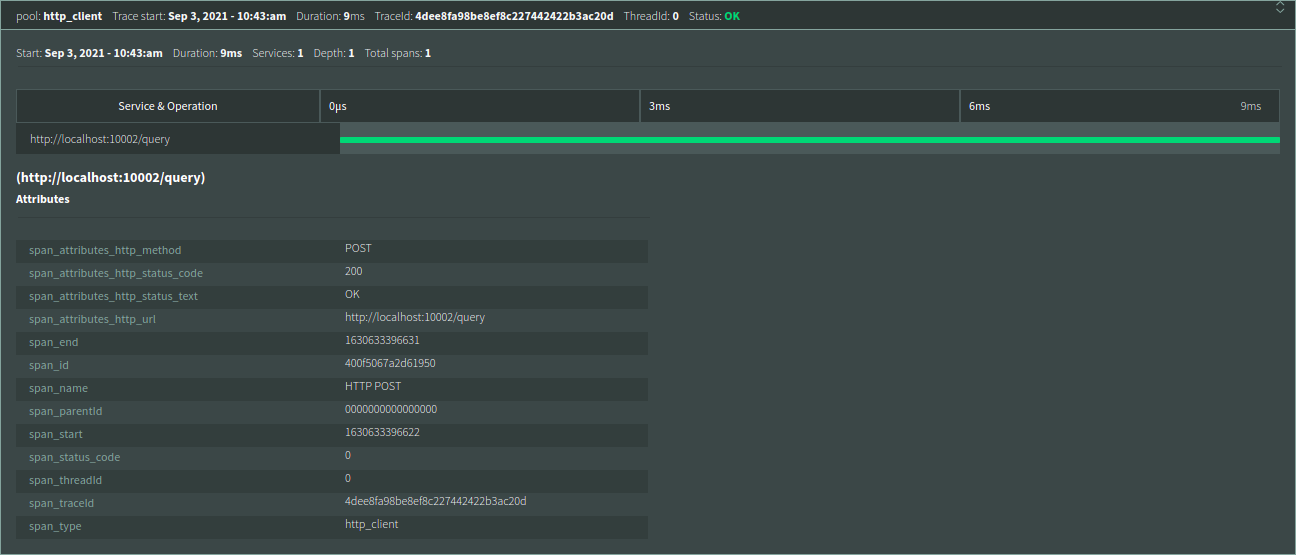
Below are the attributes of the span:
| Attribute | Description |
|---|---|
| id | the id of the application |
| app | the name of application |
| hostname | the name of the host machine |
| tags | the tags of the application |
| span_attributes_http_method | the http method of span attributes |
| duration | the duration of the span |
| span_attributes_http_status_code | the http status code of the span attributes |
| span_attributes_http_status_text | the http status text of the span attributes |
| span_attributes_http_url | the http url of the span attributes |
| span_end | the end time of the span |
| span_id | the id of the span |
| span_name | the name of the span |
| span_parentId | the parent ID of the span |
| span_start | the start time of the span |
| span_status_code | the status code of the span |
| span_threadId | the thread ID of the span |
| span_traceId | the trace ID of the span |
| span_type | the type of the span |
| resourceSpans | an array of resource spans |
| attributes | an array of attributes |
| key | the key of the attribute |
| value | the value of the attribute |
| stringValue | the string value of the attribute |
| telemetry.sdk.language | the language of the telemetry SDK |
| telemetry.sdk.name | the name of the telemetry SDK |
| telemetry.sdk.version | the version of the telemetry SDK |
| cloud.provider | the cloud provider |
| cloud.platform | the cloud platform |
| cloud.region | the cloud region |
| faas.name | the name of the function as a service |
| faas.version | the version of the function as a service |
| process.pid | the process ID |
| process.executable.name | the name of the executable |
| process.command | the command |
| process.command_line | the command line |
| process.runtime.version | the version of the runtime |
| process.runtime.name | the name of the runtime |
| process.runtime.description | the description of the runtime |
| droppedAttributesCount | the number of dropped attributes |
| MessageAttributes | the message attributes |
| eventType | the event type |
| StringValue | the string value |
| DataType | the data type |
| instanceId | the instance ID |
| functionArn | the Amazon Resource Name (ARN) of the function |
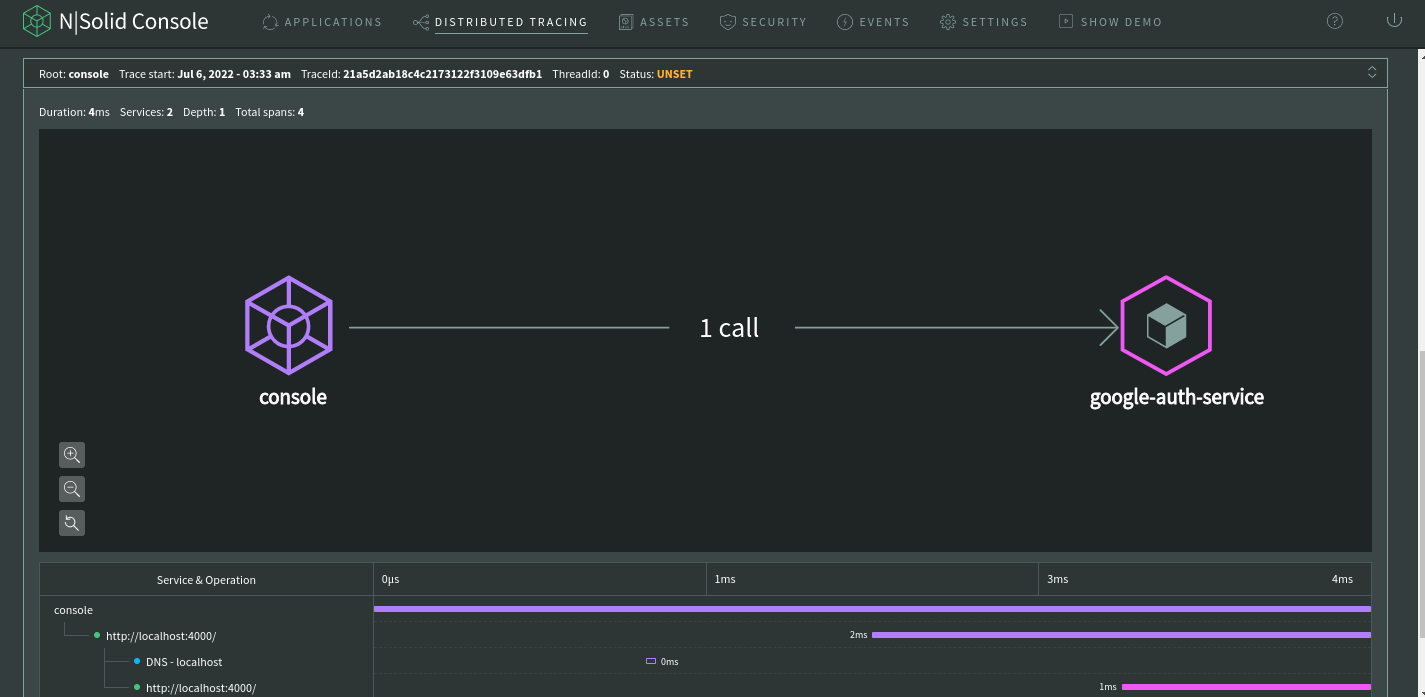
Let's authenticate using the console service, which is going to perform a request to the google-auth-service to authenticate the user.
The graph below represents a “path”, from the console service to the authentication service, N|Solid will monitor the HTTP traces in this distributed system.
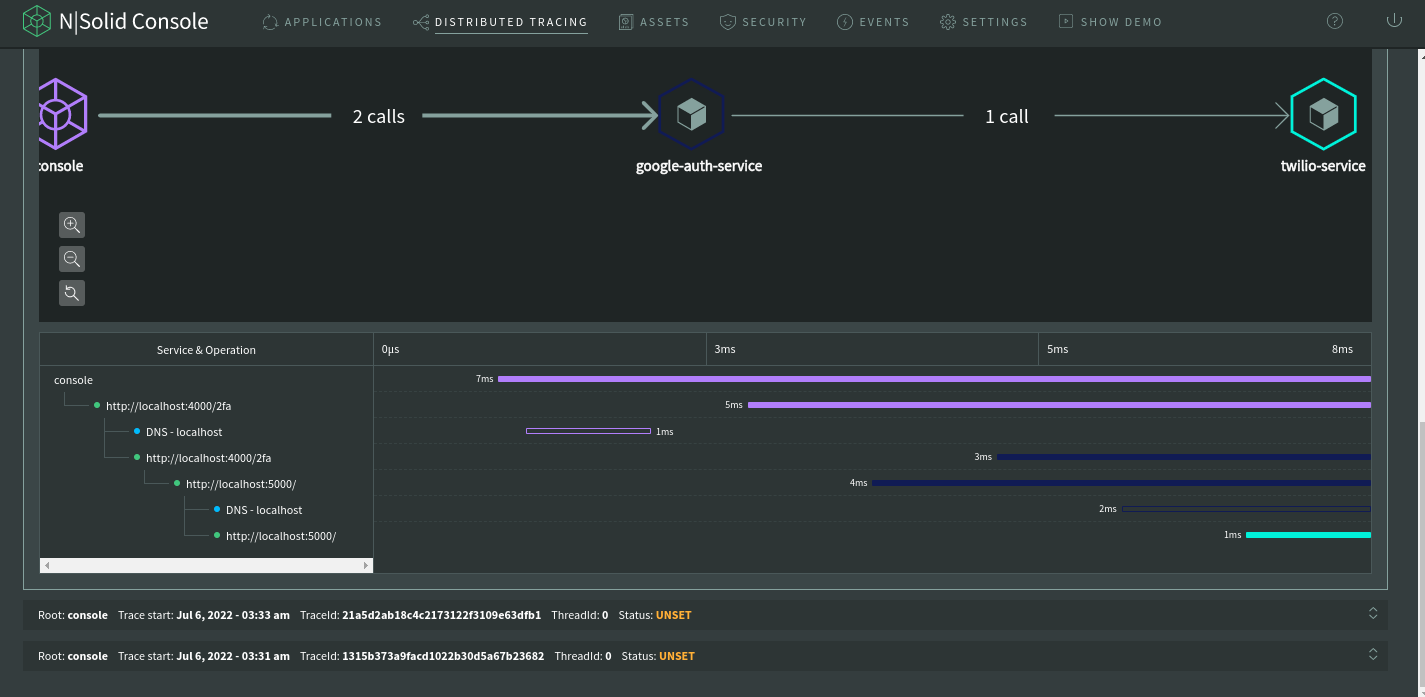
As such, graph is showing the whole “path”, starting from the console and finishing with the sms service. This is how distributed tracing works using N|Solid managed systems.
The collected information can be used for debugging latency issues, service monitoring, and more. This is a valuable addition to users for those who are interested in debugging a request latency. Tracing traces of user requests through multiple Node applications, and collecting data that can help find the cause of latency issues, errors, and other problems in a distributed system.
SBOM
The SBOM tab will display the SBOM(Software Bill of Materials) of the function. The SBOM will display the following information:
- Name: The name of the package.
- Version: The version of the package.
- Risk: The level of risk associated with using this package.
- License: The license under which the package is distributed.
- Author: The author of the package.
- Number of CVEs / CWEs: The number of known Common Vulnerabilities and Exposures (CVEs) or Common Weakness Enumerations (CWEs) associated with the package.
- Path: The path to the package within the application.
Changing Time Range
To change the time range, click the calendar icon above the graphs:
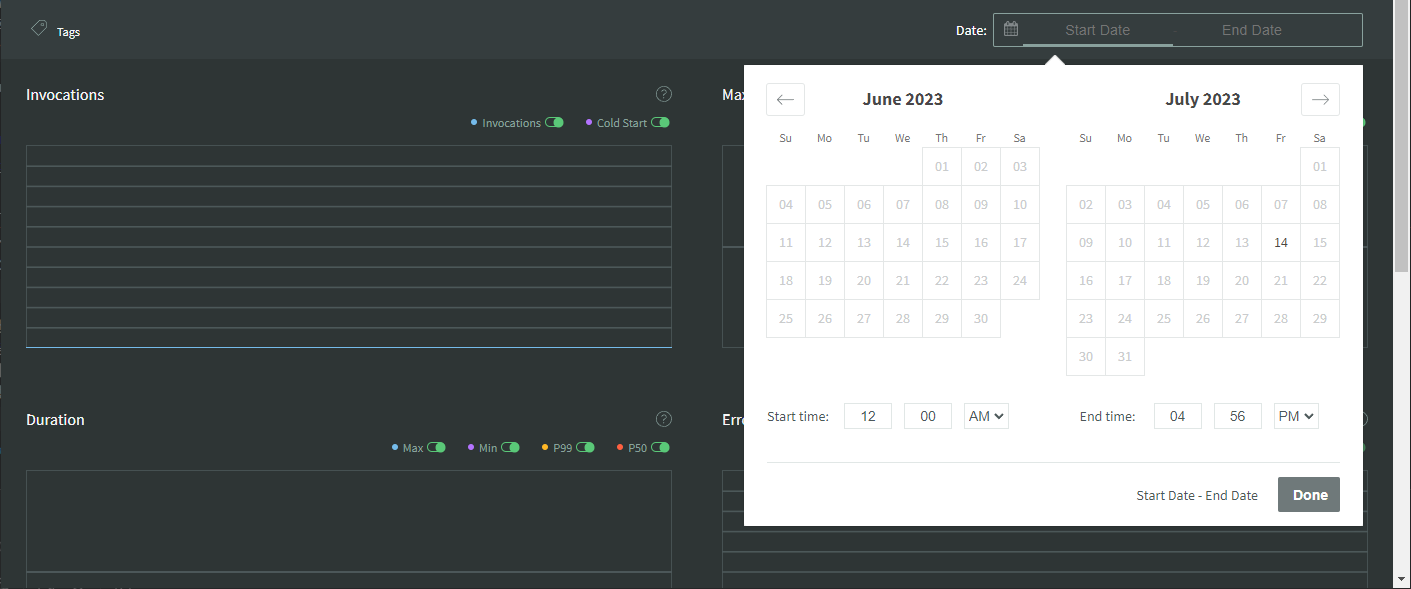
This will show a calendar from which users can select the time range. The timeline graph range is updated every 1 minute, with an option to change the date range every 1 minute. In summary, with NodeSource's Serverless monitoring, users can gain more insight into the performance of their serverless functions and quickly identify and debug any issues.
Uninstall
> nsolid-serverless infra --uninstall
