Send an alert by email
Set up a custom filter in the N|Solid Console that sends an email whenever a process's CPU usage goes above 40%.
Performance problems in production often happen unpredictably, and the only diagnostics available may be an error log or a stack trace. With custom filters (also called saved views) in the N|Solid Console, you can run actions automatically when processes match criteria you consider critical, such as CPU spikes, memory leaks, or a blocked event loop.
Create the alert
-
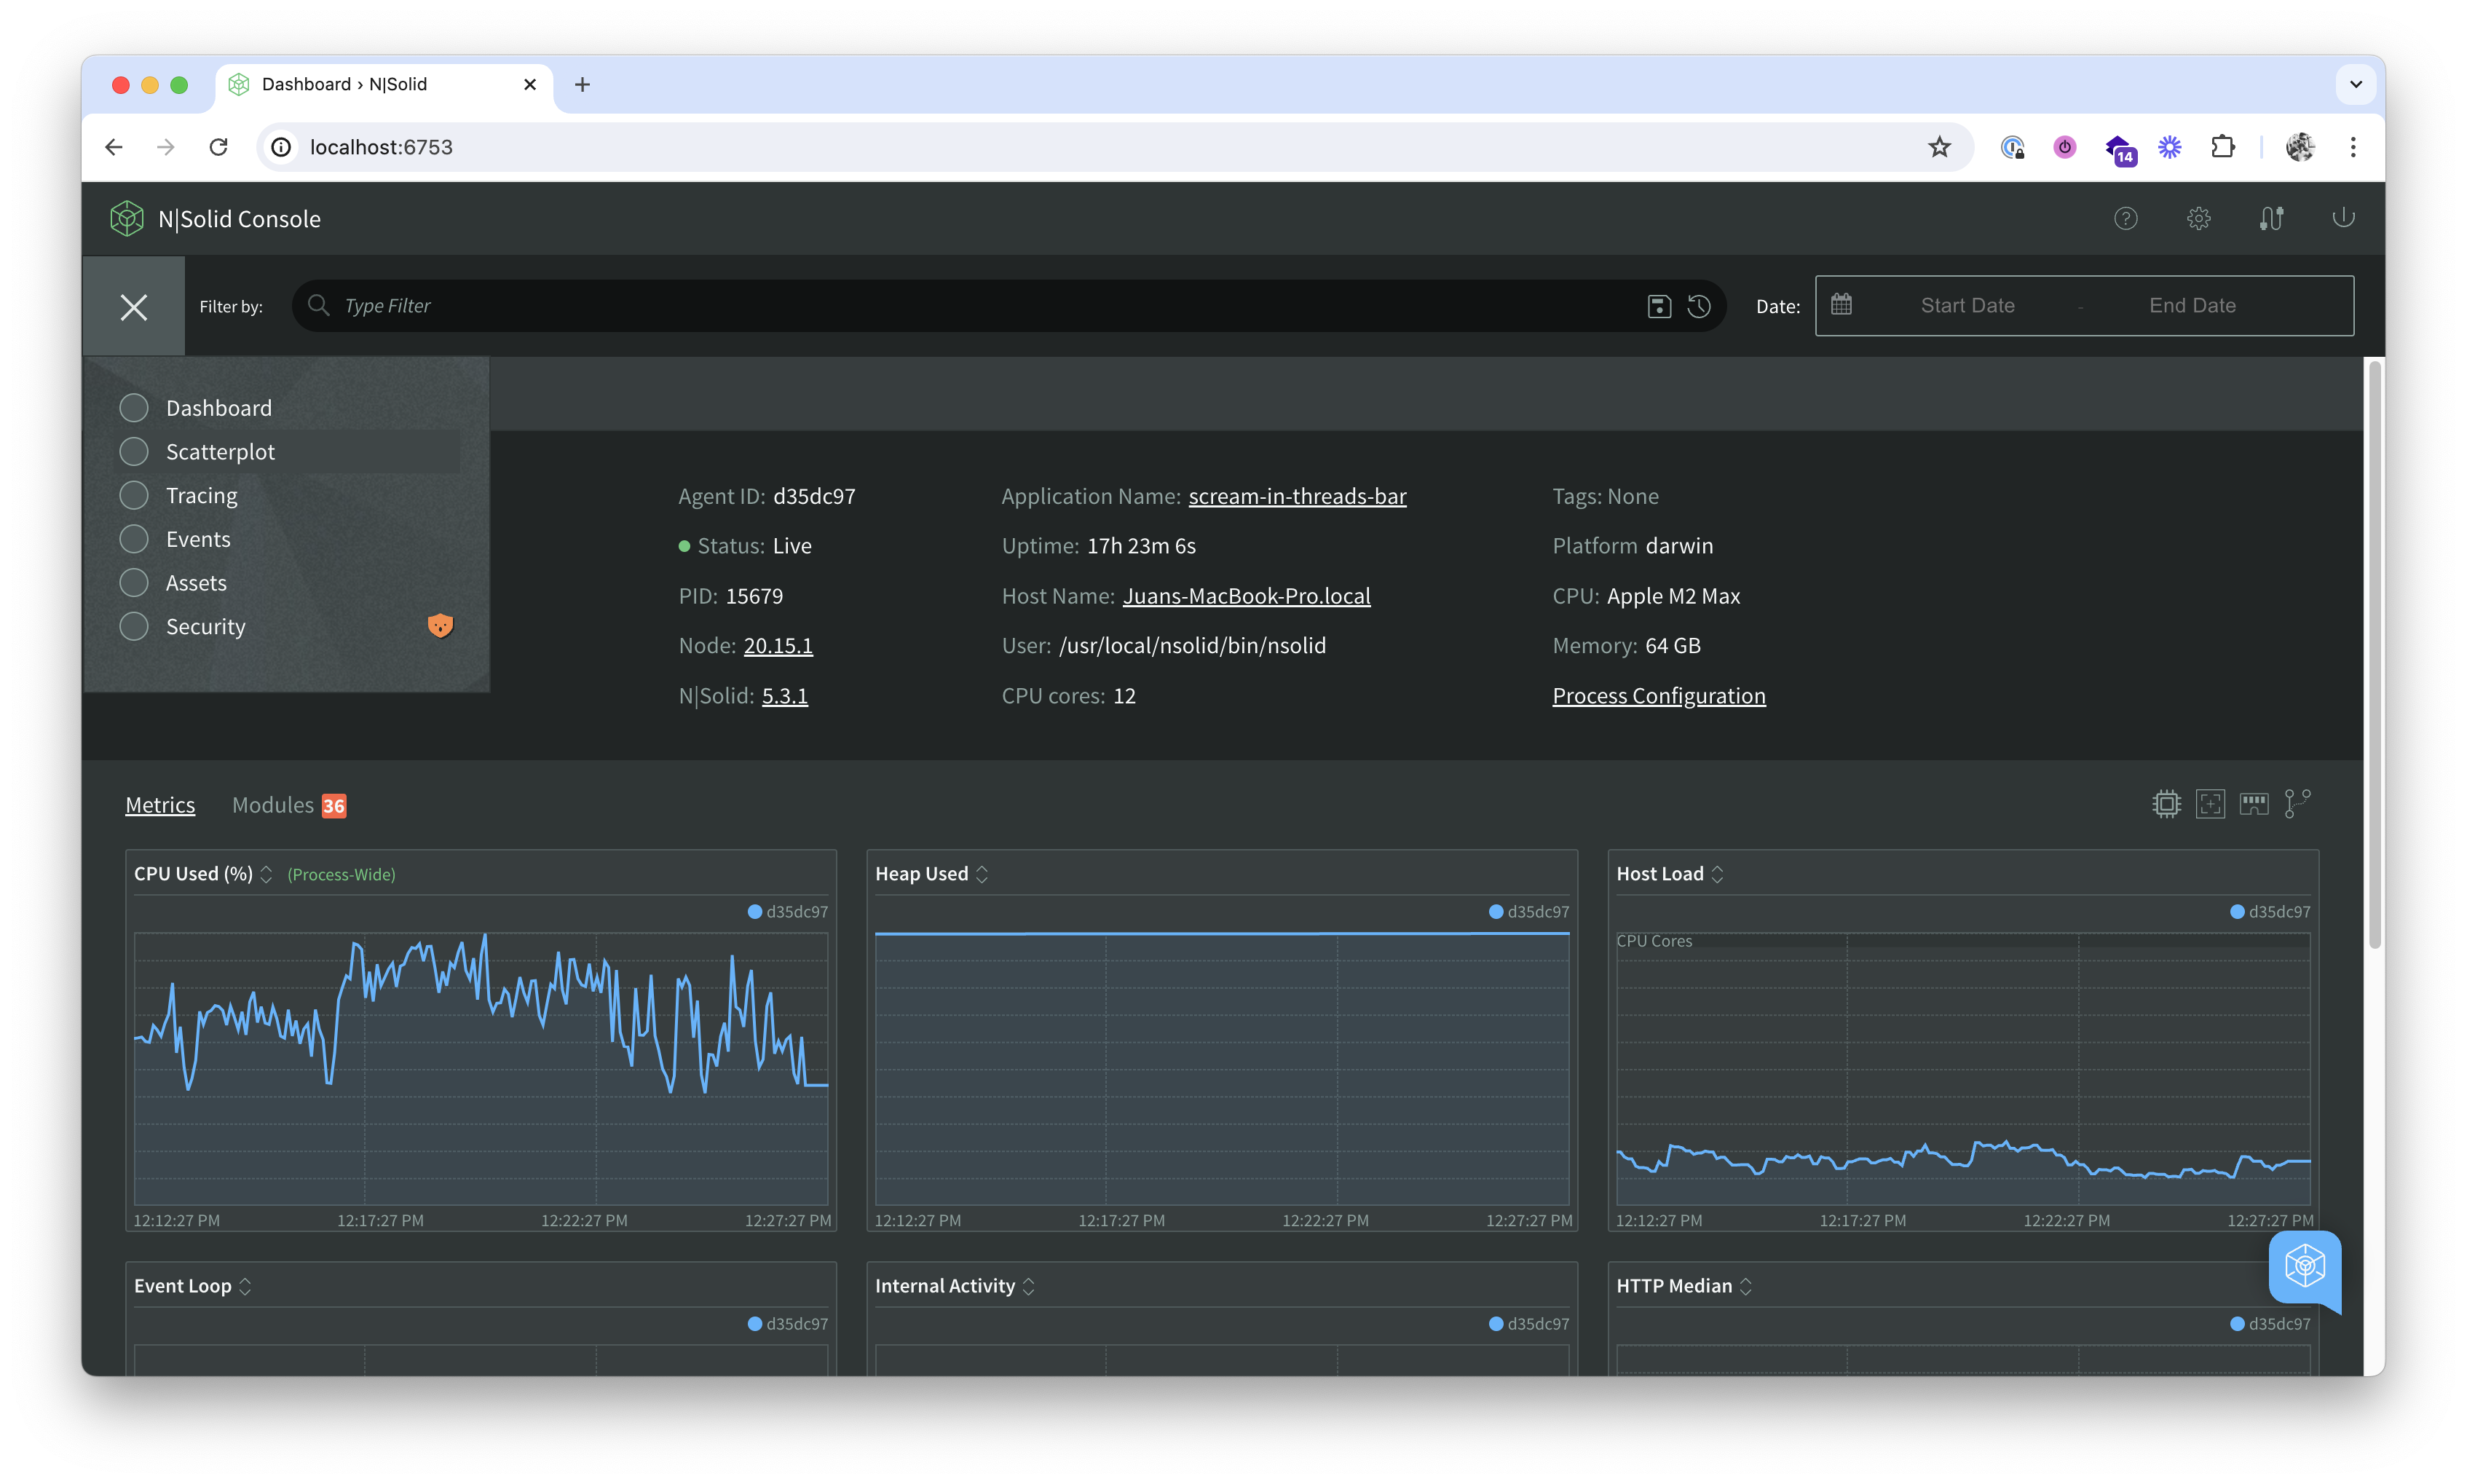
Open the navigation menu (☰) and select Scatterplot.
-
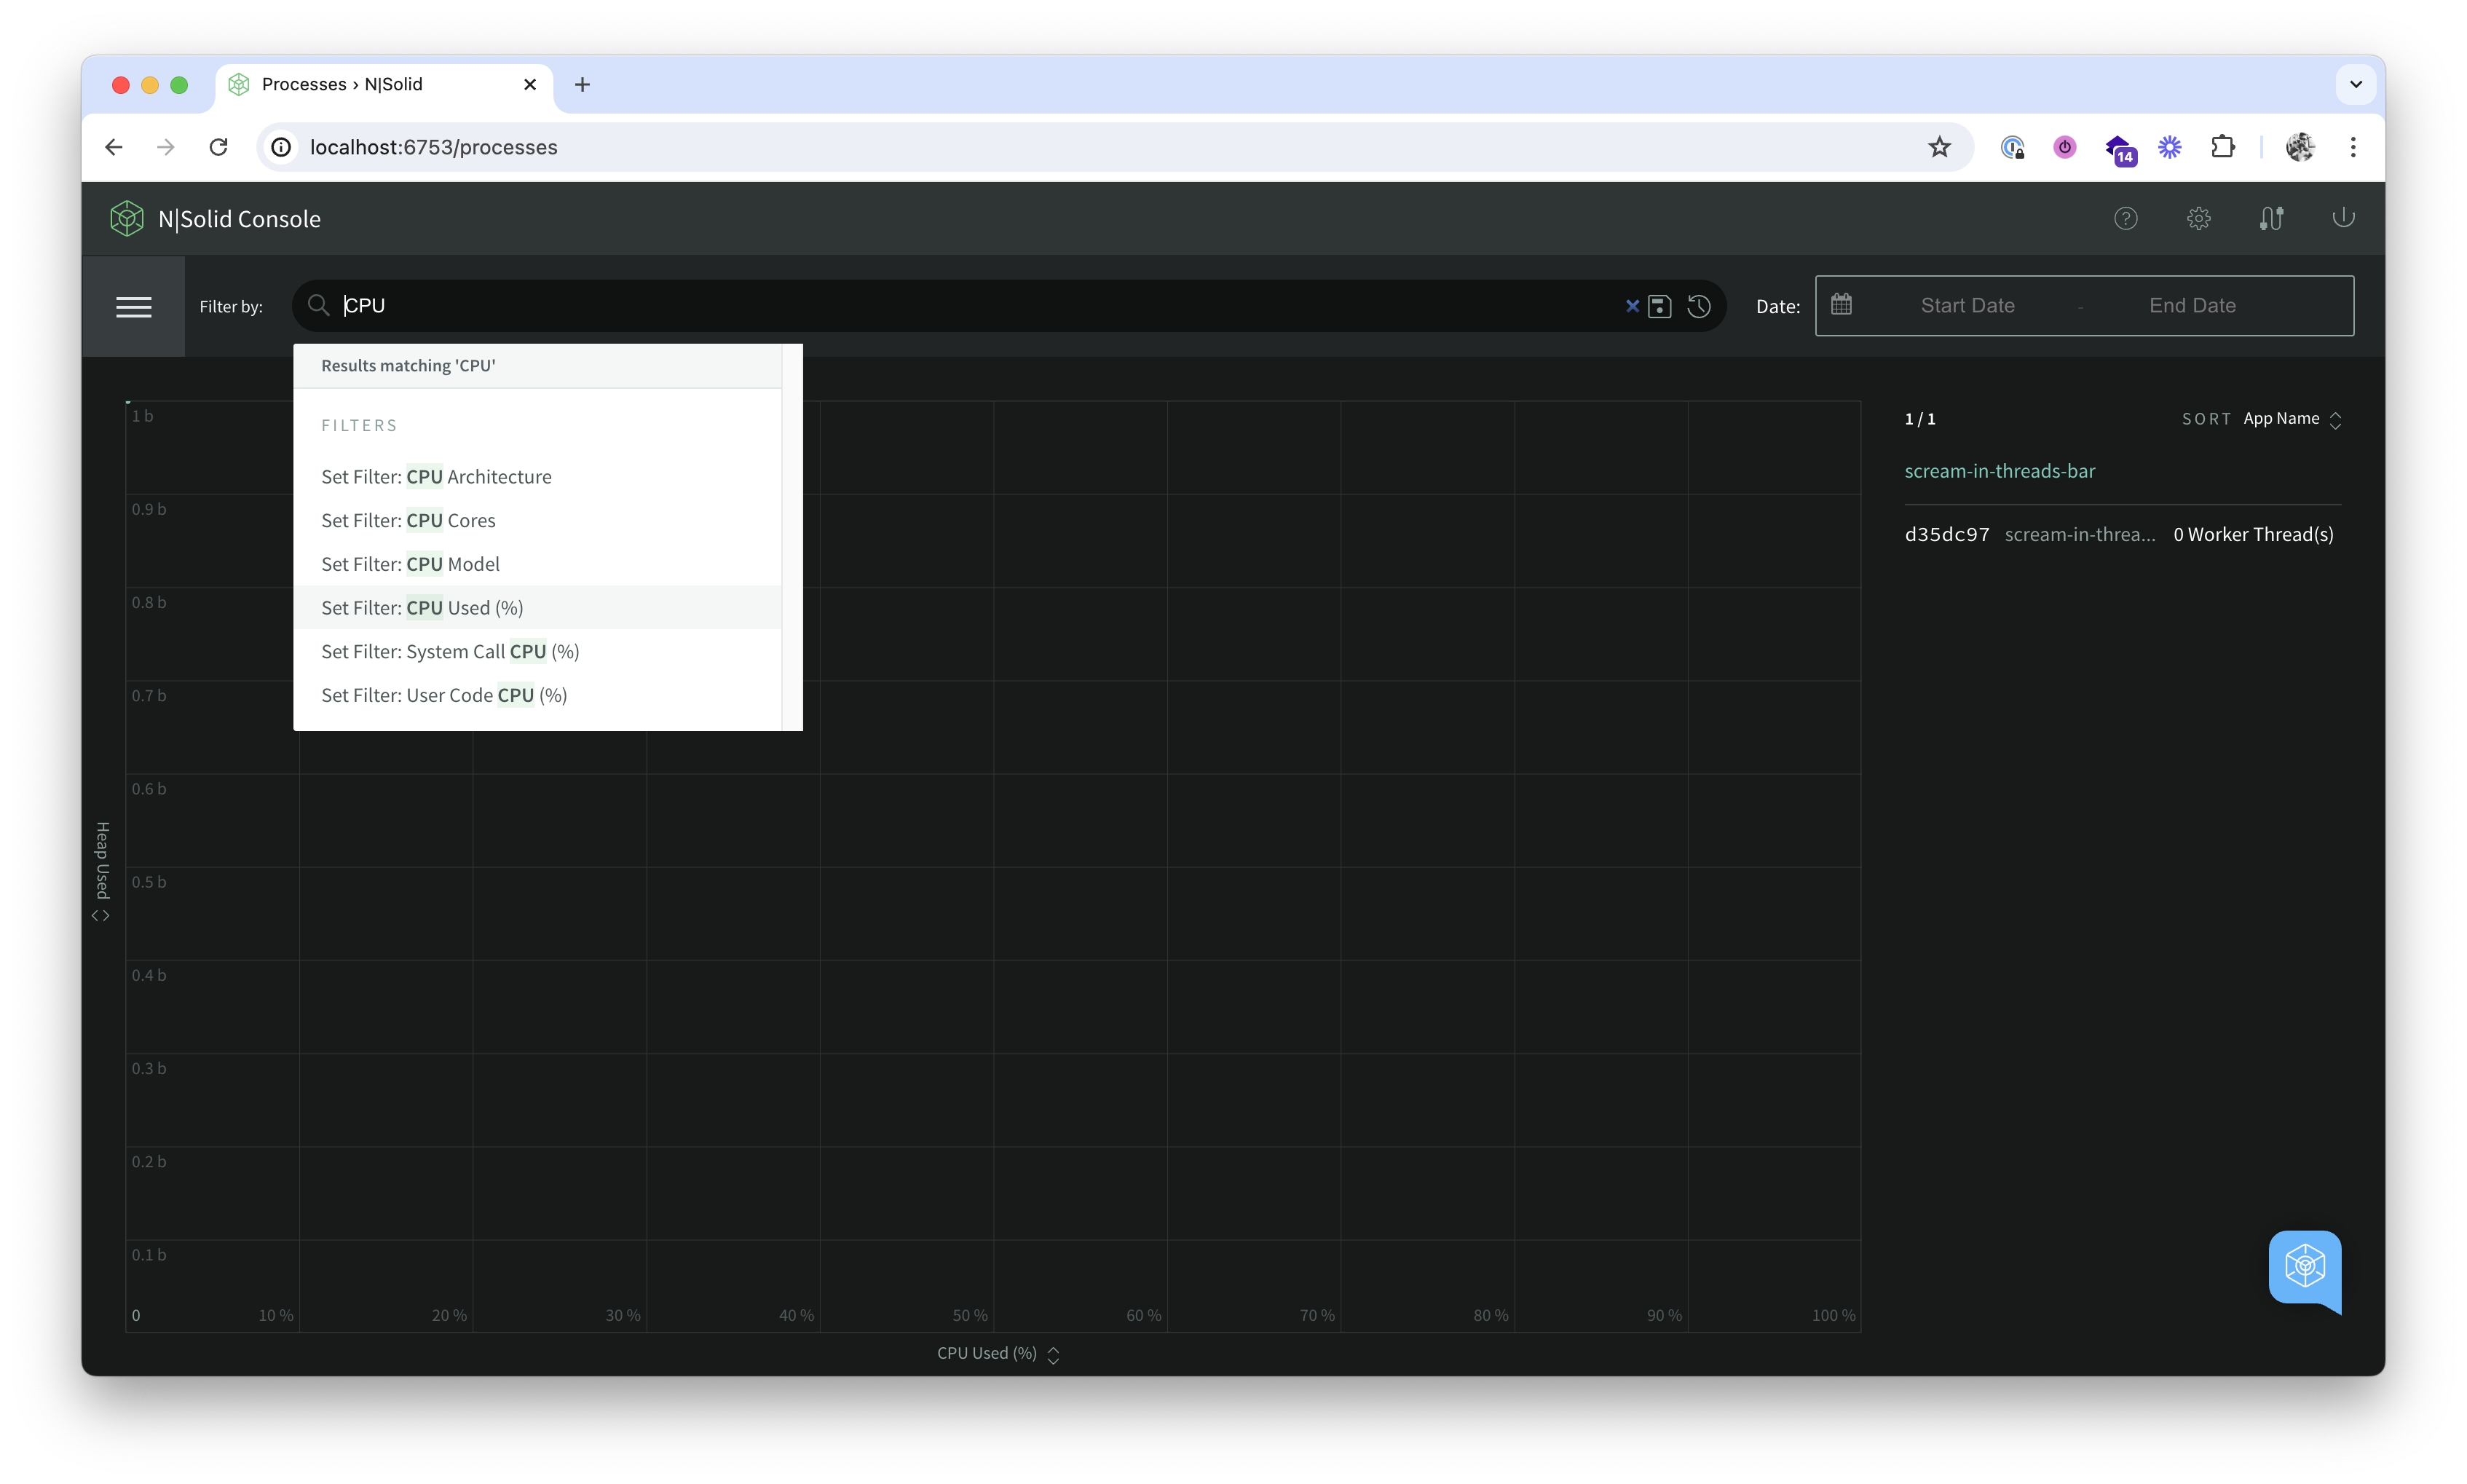
Click the filter bar and choose the criteria for your action. In this example, the criterion is CPU above 40%.
-
Save the filter and give it a name, for example
CPU over 40%.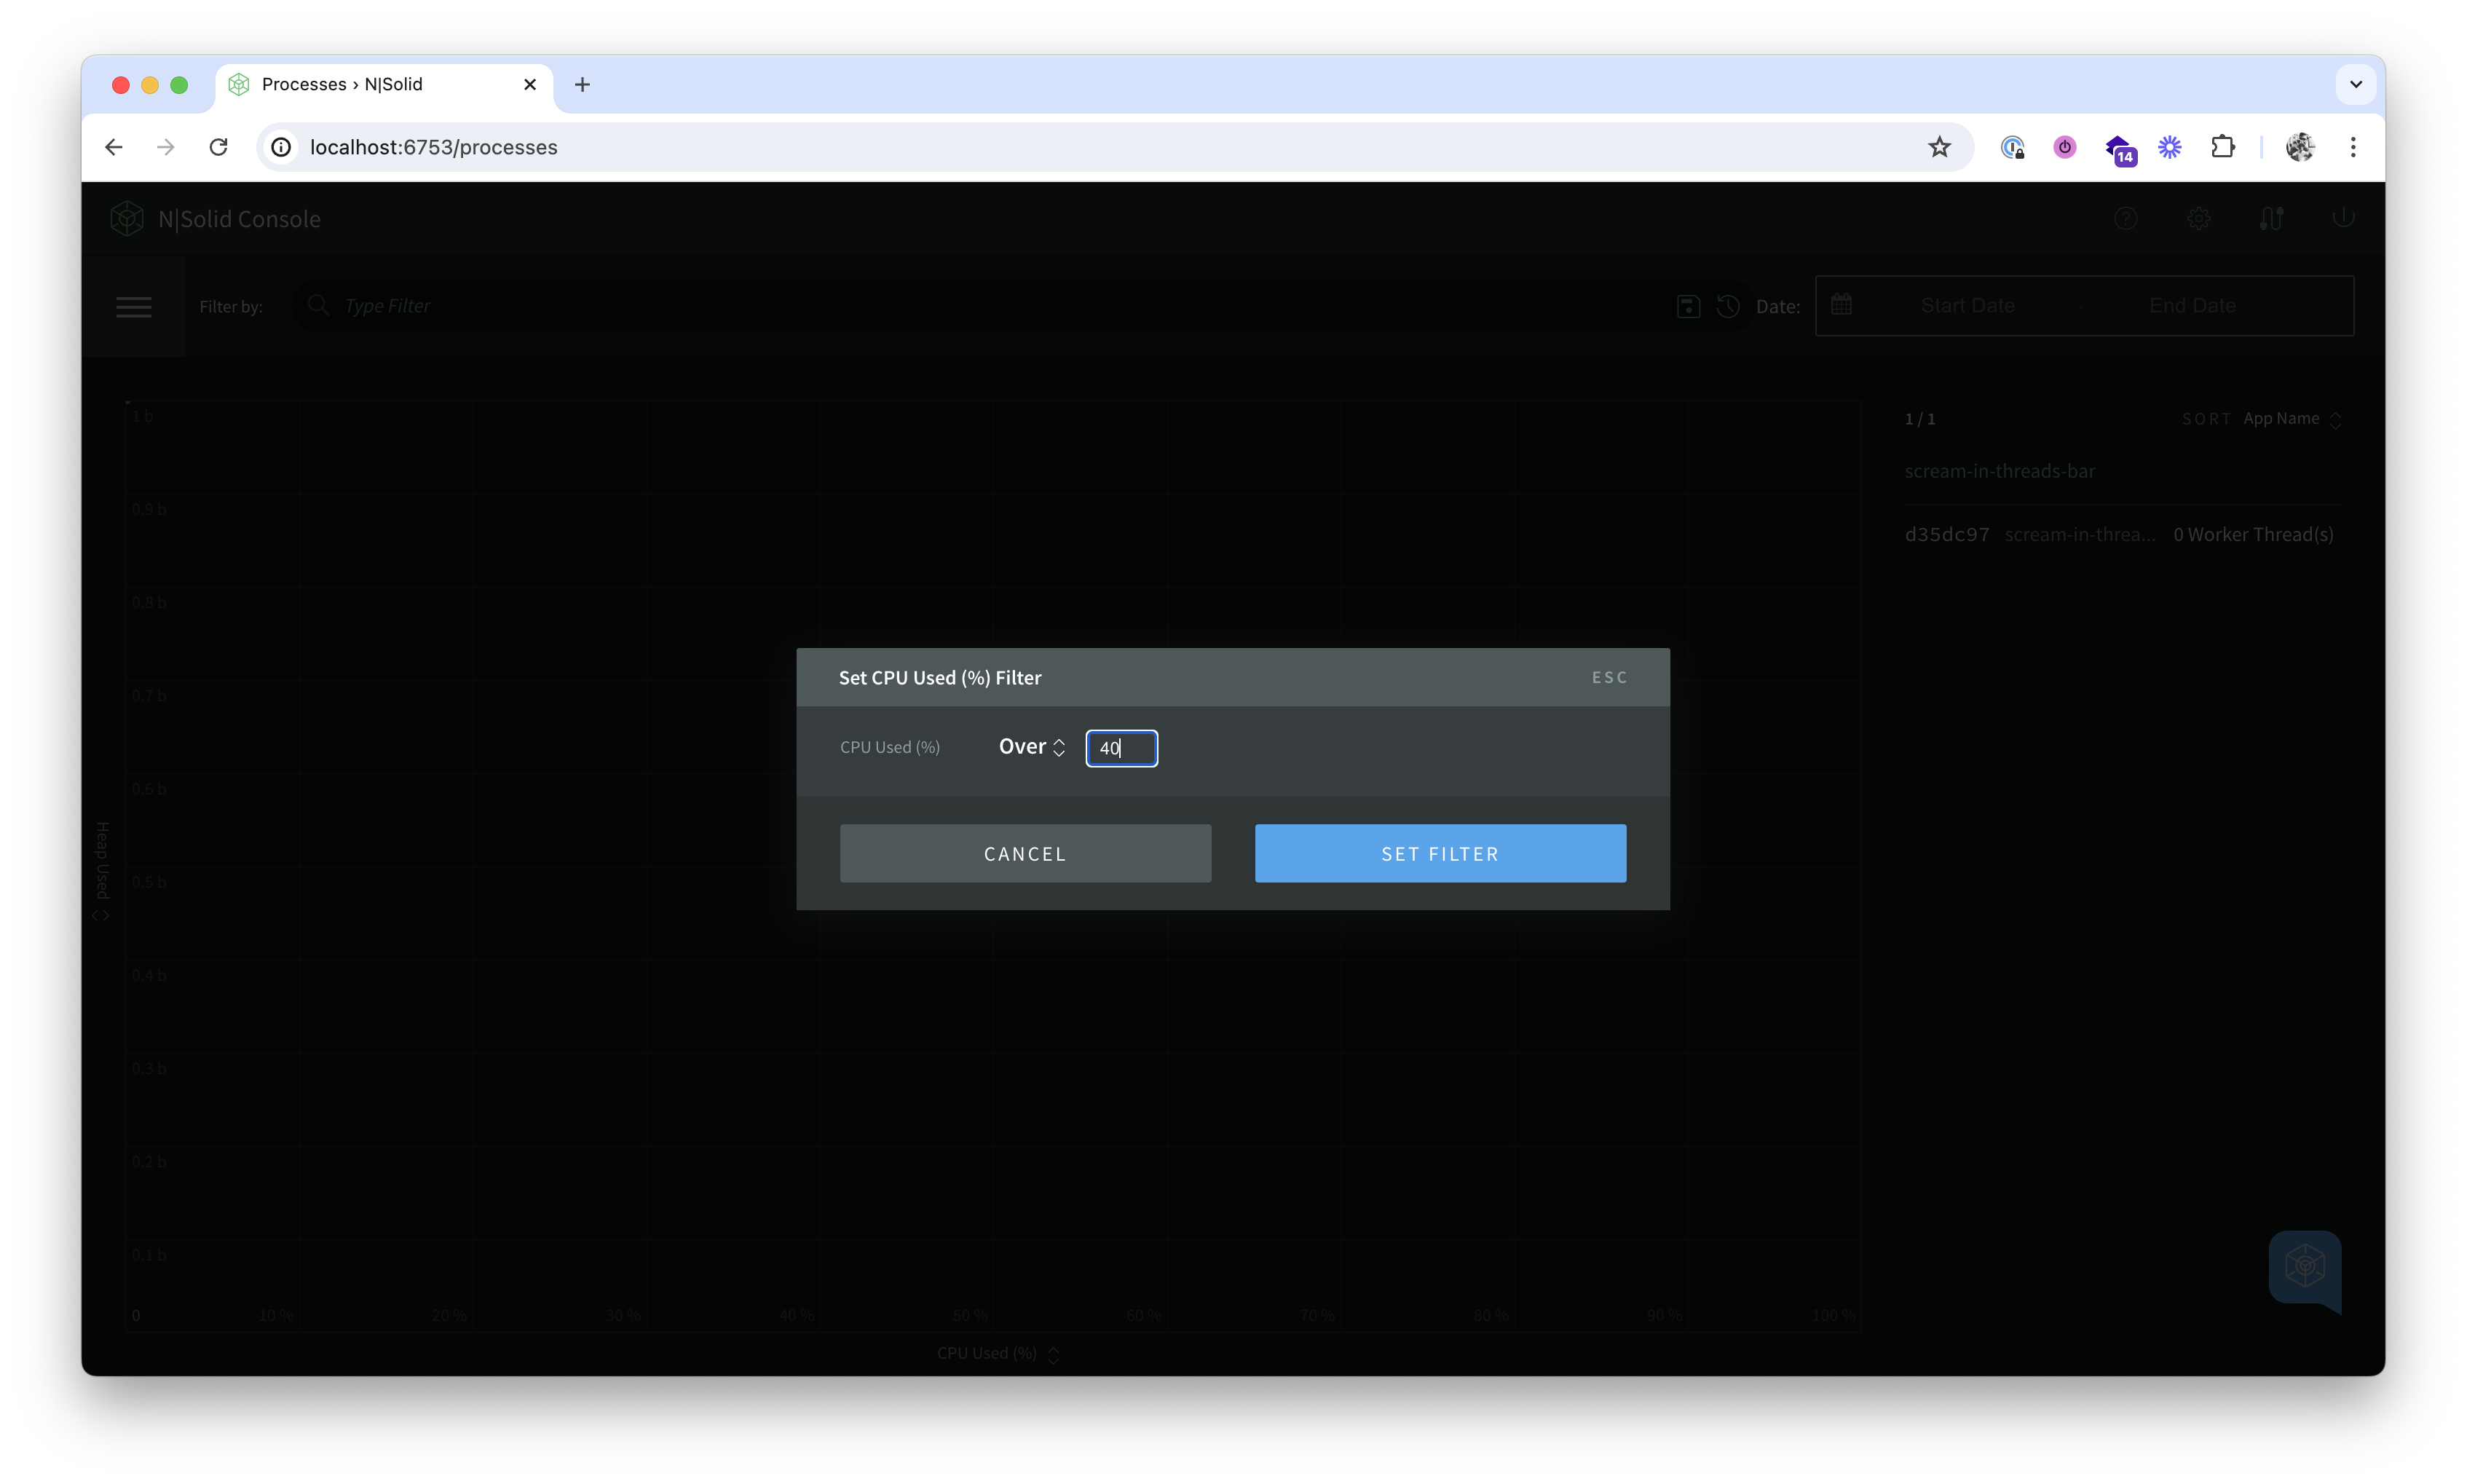
-
In the Custom Filters list, click the actions icon next to the trash-can icon to open the Actions dialog.
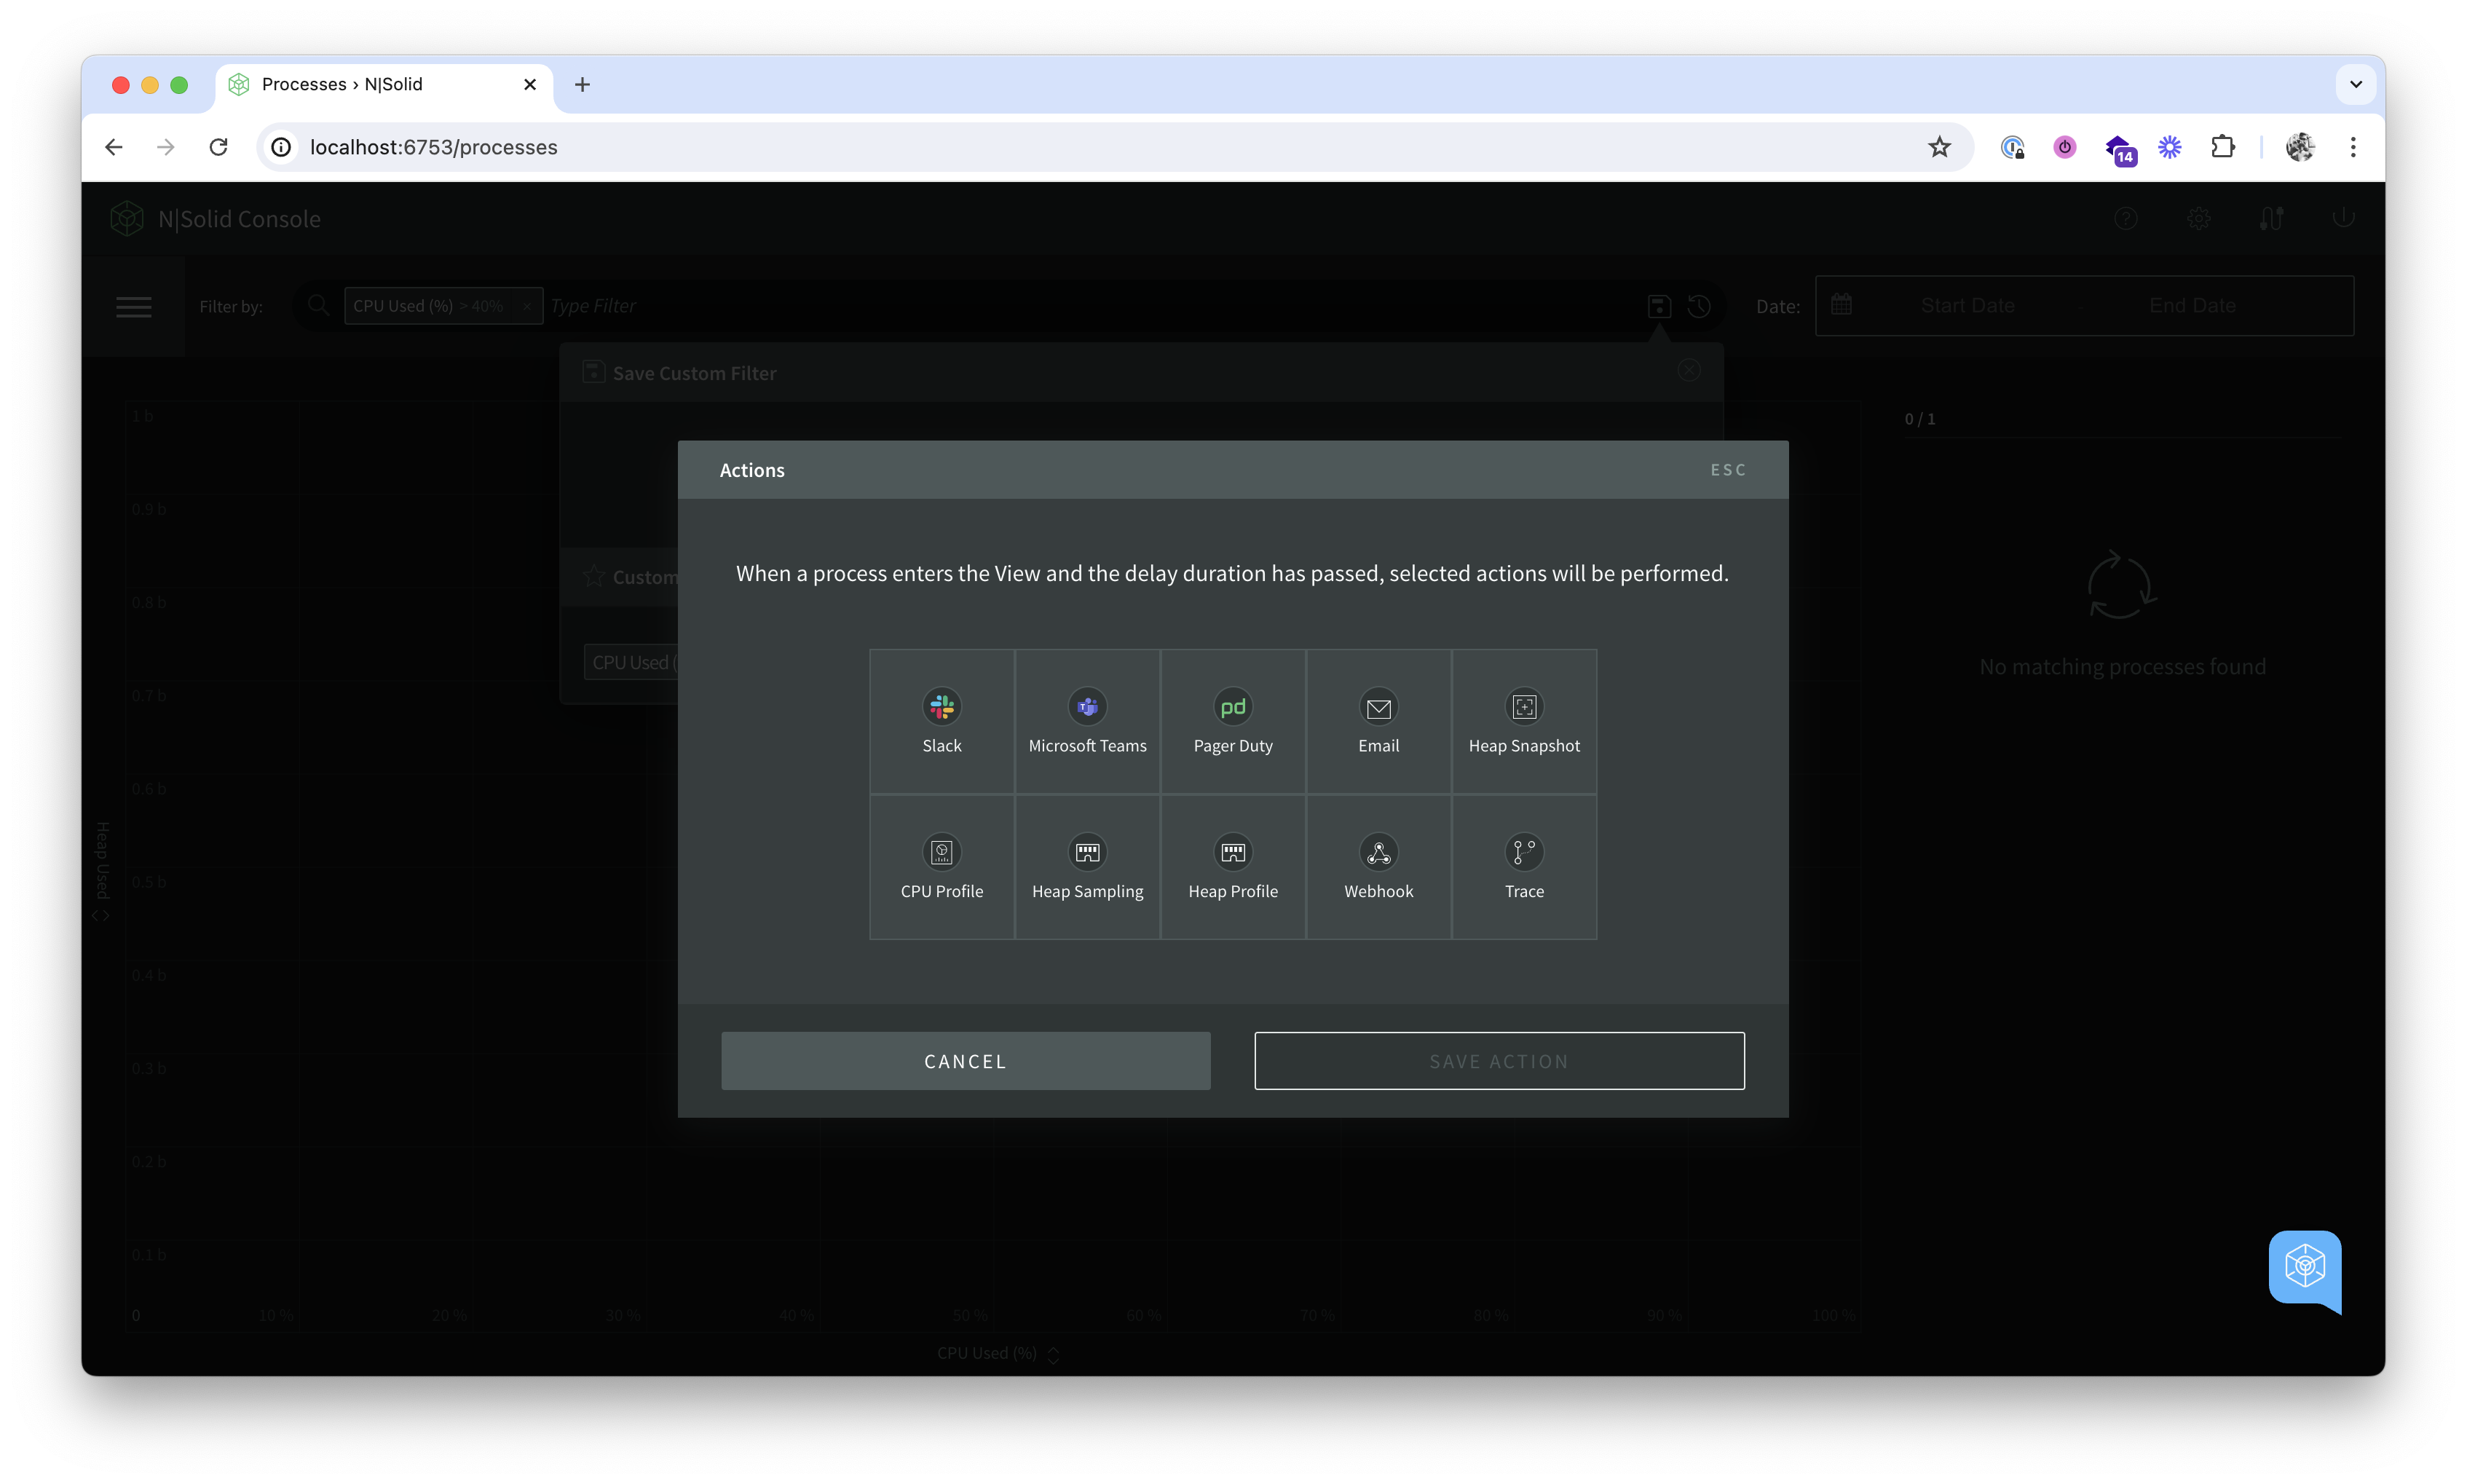
-
Select Email, and enter one email address or a comma-separated list of addresses to notify.
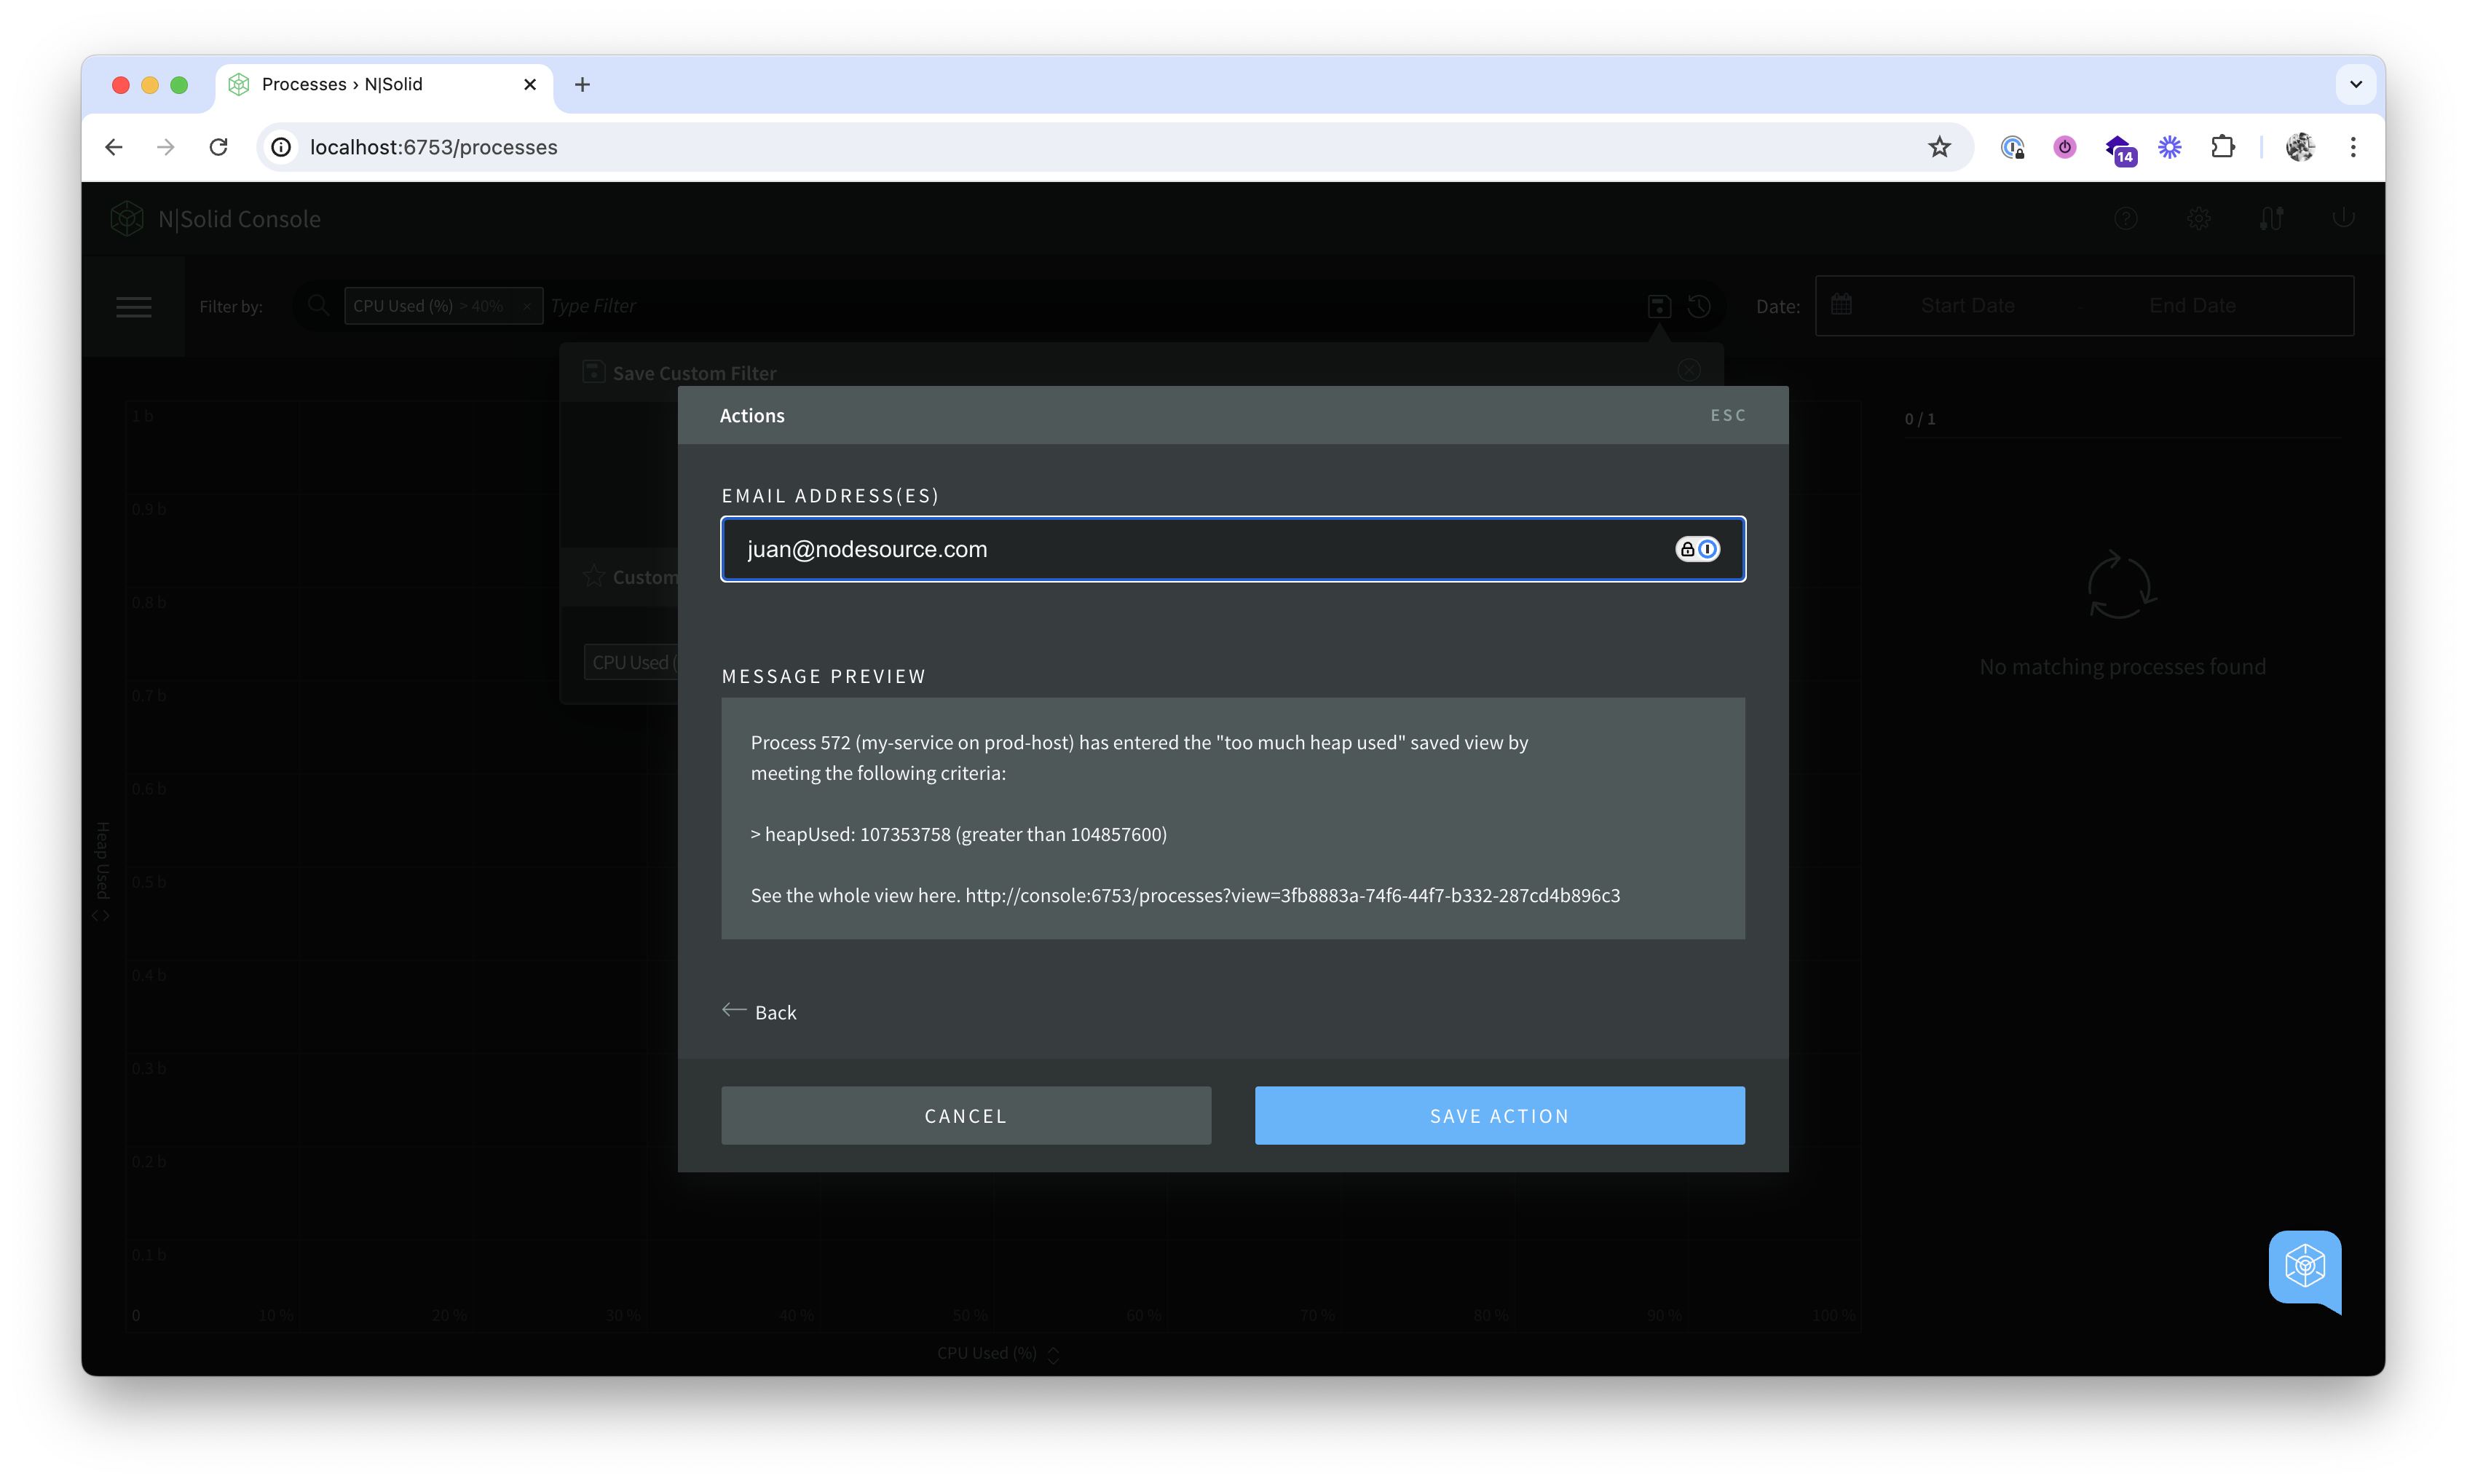
-
Choose the Action Delay: how long a process must match the filter before the action runs (15 seconds, 30 seconds, 45 seconds, or 1 minute).
-
Click Save Action.
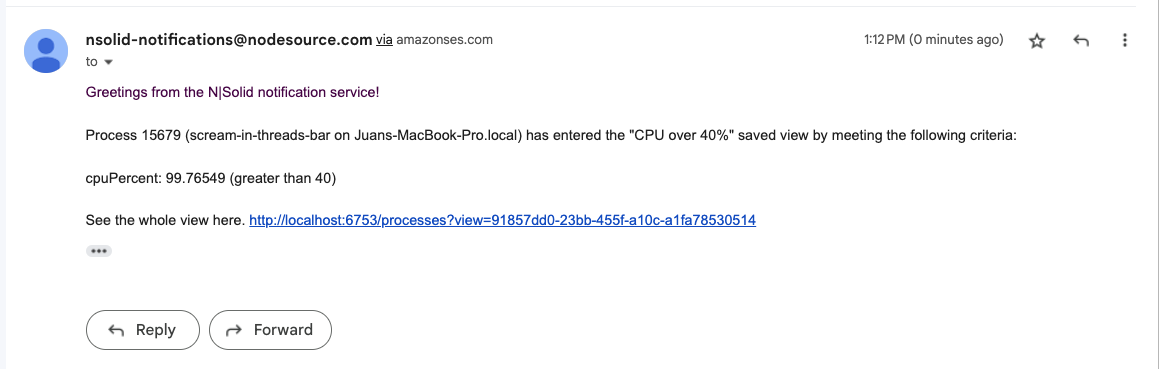
You and your team now receive an email whenever a process's CPU usage stays above 40% for the selected delay.
Other actions
Besides Email, you can attach these actions to a custom filter: Slack, Microsoft Teams, Pager Duty, Webhook, Heap Snapshot, CPU Profile, Heap Sampling, Heap Profile, and Trace. Slack, Microsoft Teams, PagerDuty, and webhook actions need an integration first; see Integrations.
The Console sends email through the NodeSource notification service. A self-hosted N|Solid Console needs a valid license and outbound HTTPS access to services.nodesource.io to send email alerts.
