The N|Solid UI
The N|Solid UI is a unified dashboard for all N|Solid Runtimes configured to send data to the same N|Solid Console Server. With it you can see you entire Node.js installation at a 10000 foot view to spot outliers and then dive straight into that process itself for diagnosis.
It is designed to give you a toolbox for working with large Node.js installations running ongoing production loads with minimal interference or overhead. It's somewhat like having a fully connected DevTools like diagnosis system plugged into each of your production servers, enabling you to collect data and diagnose problems that are not reproducible anywhere other than production.
There are six main sections of the N|Solid UI that can be navigated between by using the primary Navigation menu at the top left of the page:
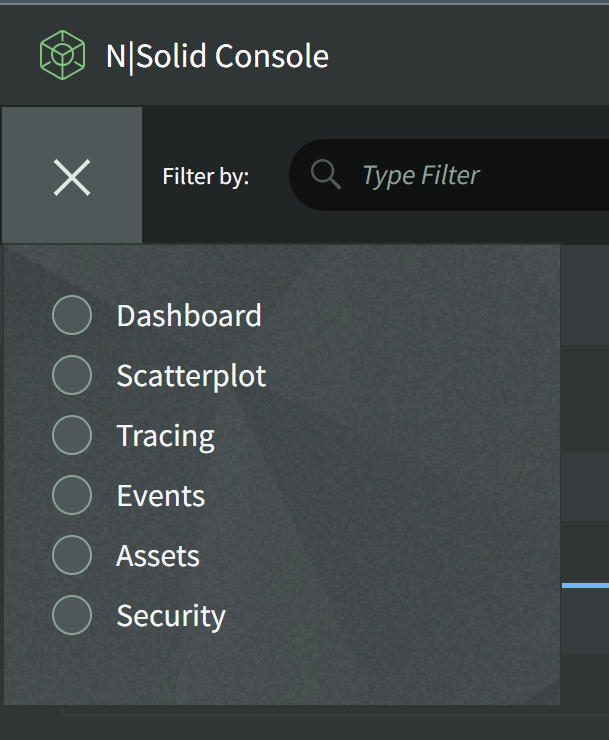
- Dashboard -- View current or past metrics and information.
- Scatterplot -- Track live metrics in an interface designed to identify outliers.
- Tracing -- Our OpenTelemetry trace data viewer.
- Events -- A searchable log of process or system alerts or lifecycle events.
- Assets -- Recent or saved Assets such as CPU Profiles, Memory Profiles, or Heap Snapshots.
- Security -- Vulnerabilities found and known details.
All six main sections share the same Global Filter and Date Range to help you narrow the results.
