Events
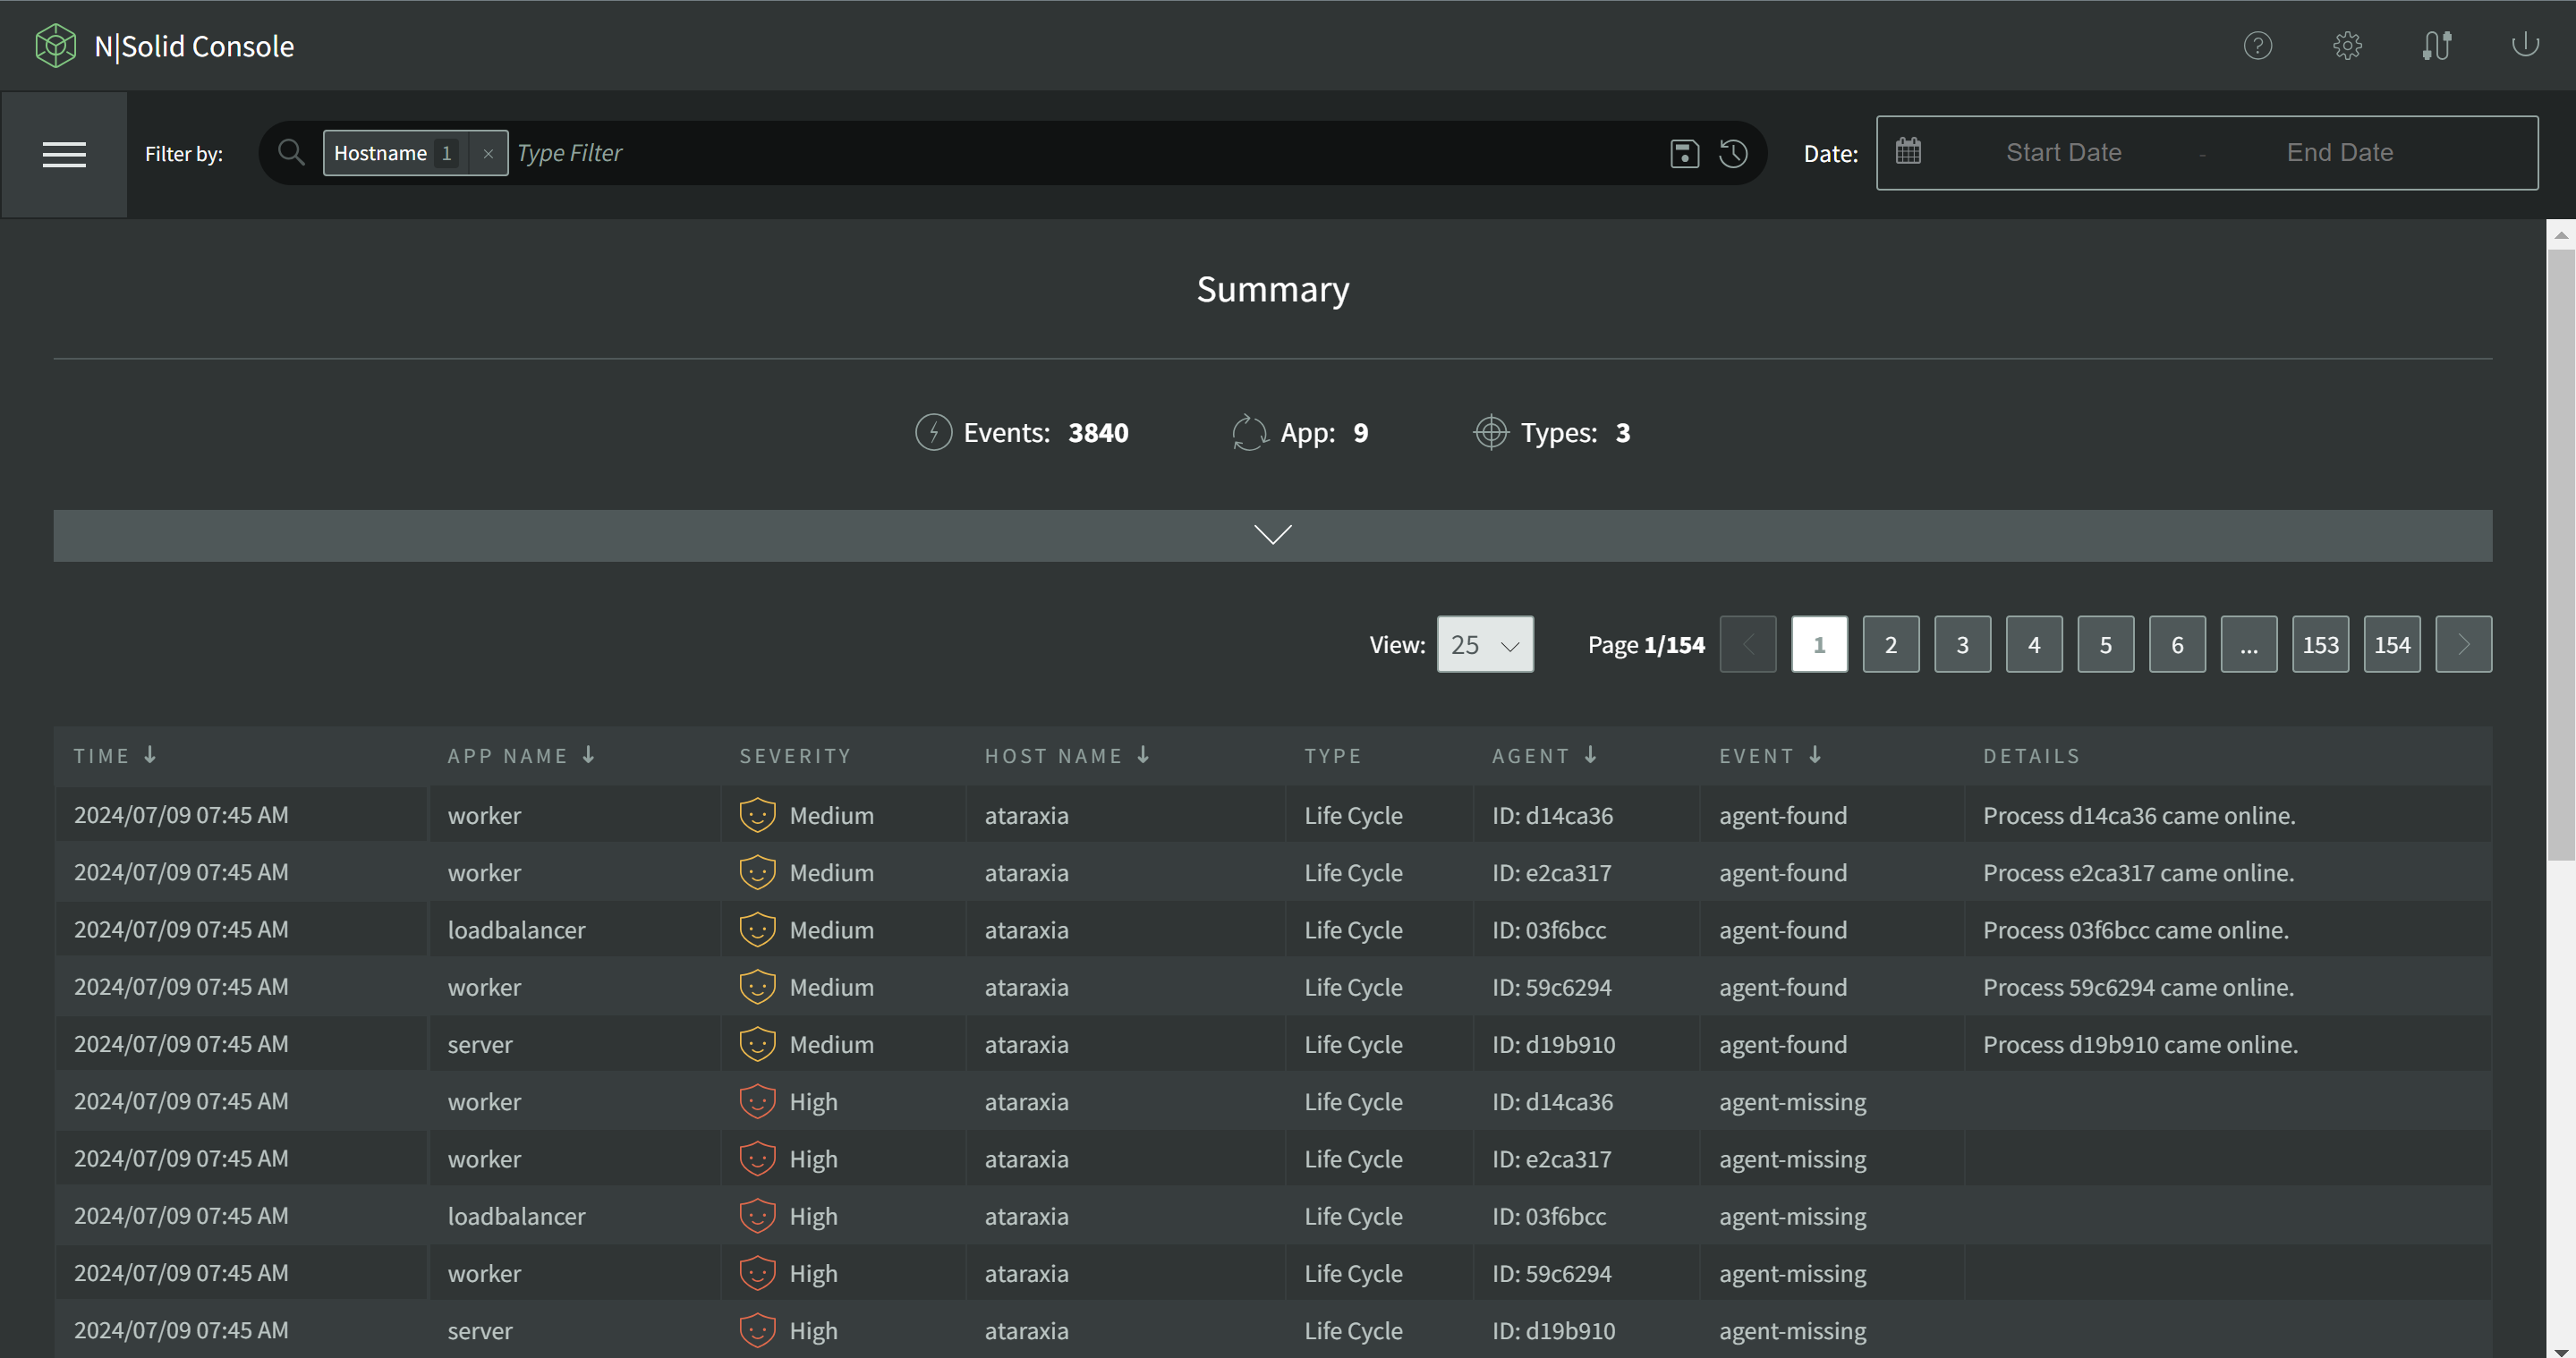
N|Solid tracks events for each process, covering life cycle, performance, security, assets, and the health of the N|Solid Console itself. The Events view lets you search these events for patterns and clues to potential issues. Like every other view, its results are filtered by the global Filter Bar and Date Range.
Summary
The Summary at the top of the view shows the number of Events, Clusters, and Total occurrences, plus the number of apps and event types. Expand it to see the top applications and event types by number of events.
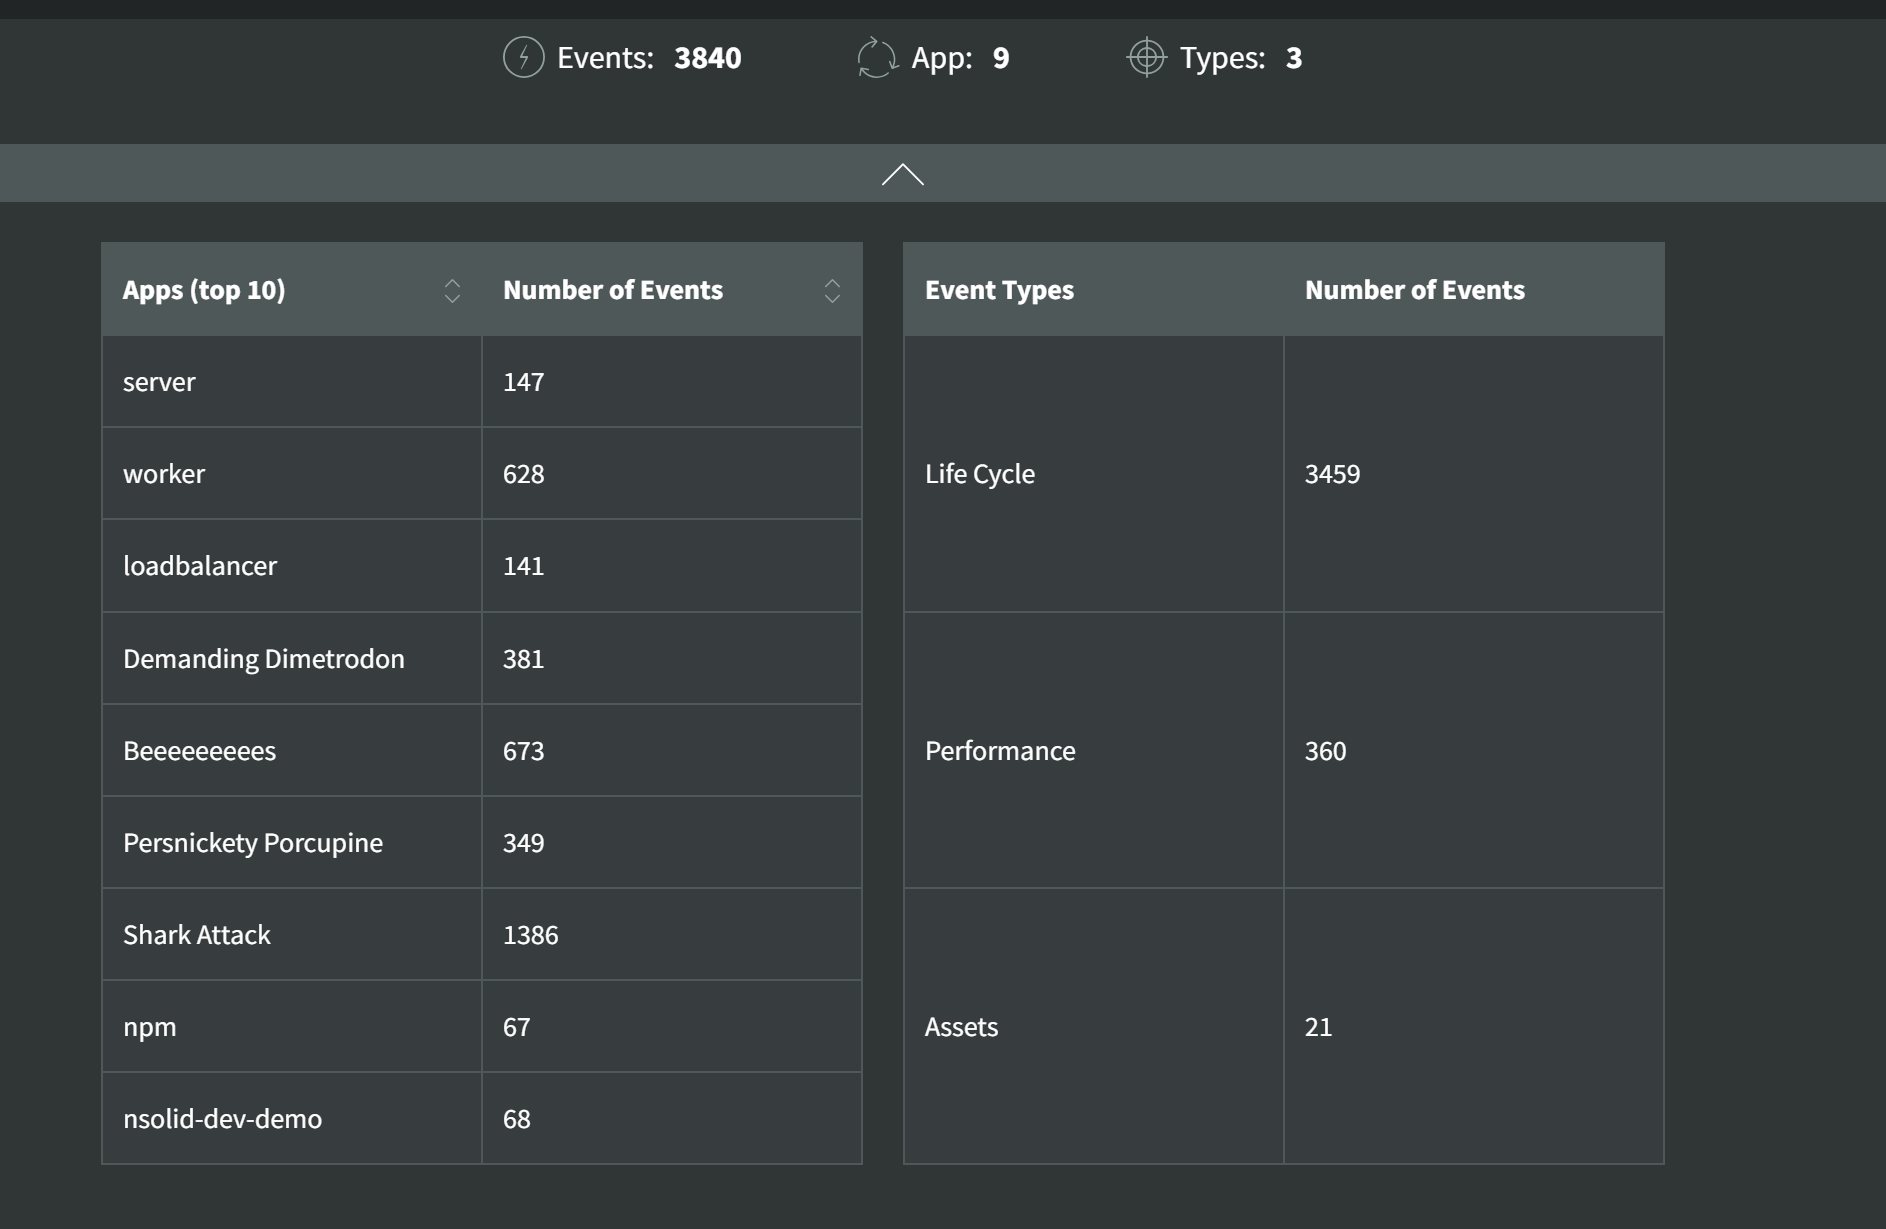
If the selected date range starts before raw event storage was available, the total is marked Partial. In that case the total is an approximation and the application and event type breakdowns are hidden.
Event clustering
The Events view groups repeated, identical events into clusters, so a burst of the same event appears as a single row with an occurrence count. Click a clustered row to open its details:
- Summary & Distribution: when the cluster was First Seen and Last Seen, its frequency, and the hosts and agents affected, with the number of occurrences for each.
- Raw Instances: the individual events in the cluster, one page at a time.
Click View full JSON payload matching criteria to see the full cluster payload.
For process-blocked events, click View Details (or View Stack on a cluster) to see the stack trace captured while the event loop was blocked.
Event types
The following tables describe each event type.
Life Cycle
Life cycle events relate to the life of your connected processes. When a connected N|Solid process starts or stops, it generates a life cycle event.
| Name | Severity | Category | Description |
|---|---|---|---|
agent-found | Medium | Life Cycle | An N|Solid Agent has connected for the first time, or has reconnected after being missing. |
agent-missing | High | Life Cycle | An N|Solid Agent has timed out without an exit event. It may still reconnect. |
agent-exit | Low | Life Cycle | An N|Solid Agent has sent an "exit" event as it stopped. |
Performance
N|Solid can report that a process is blocked while it's still blocked. Set the threshold with Blocked Loop Threshold in the Dashboard's Dynamic Configuration modal, or with the runtime configuration.
| Name | Severity | Category | Description |
|---|---|---|---|
process-blocked | Medium | Performance | An N|Solid process has had its event loop blocked for longer than the configured threshold. |
process-unblocked | Low | Performance | A blocked N|Solid process has become unblocked. |
Security
Events related to vulnerability scans of the third-party packages loaded by your live processes.
| Name | Severity | Category | Description |
|---|---|---|---|
vulnerabilities-database-updated | Low | Security | The vulnerabilities database has been updated to the latest available version. |
package-vulnerabilities-updated | Low | Security | The vulnerability check against the updated vulnerability database has completed, and the data is up to date. |
active-vulns-updated | Low | Security | The list of active vulnerabilities has been updated. |
new-vulnerability-found | High | Security | A new vulnerability has been matched in your package sets. |
Assets
Assets are CPU profiles, heap snapshots, heap profiles, and heap samples.
| Name | Severity | Category | Description |
|---|---|---|---|
asset-initiated | Low | Assets | An asset collection has started. |
asset-created | Low | Assets | An asset has been created. |
asset-canceled | Low | Assets | An asset has been canceled before its scheduled completion. |
asset-corrupted | Medium | Assets | An asset collection has failed, or the asset is corrupted. |
asset-metadata-updated | Low | Assets | An asset's metadata has been updated, for example by renaming or saving it. |
System
System events relate to the health and operation of the N|Solid Console.
| Name | Severity | Category | Description |
|---|---|---|---|
console-server-started | Low | System | The N|Solid Console has started. |
console-server-stopped | High | System | The N|Solid Console has stopped. |
server-connected | Low | System | A subsystem server has connected. |
server-disconnected | High | System | A subsystem server has disconnected, and the Console may not be fully operational. |
influxdb-error | High | System | The Console can't read metrics from or write metrics to InfluxDB. |
influxdb-recovered | Low | System | The connection to InfluxDB has recovered. |
elasticsearch-error | High | System | The Console can't read from or write to Elasticsearch (traces and events). |
integration-error | High | System | An integration (such as a webhook) failed. |
notifications-settings-changed | Low | System | Global Notifications settings have been changed or added. |
integrations-settings-changed | Low | System | Integration settings (webhooks and so on) have been changed or added. |
savedViews-settings-changed | Low | System | A custom filter has been changed or created. |
generalSettings-settings-changed | Low | System | The General Settings have been changed. |
