Metrics Graphs
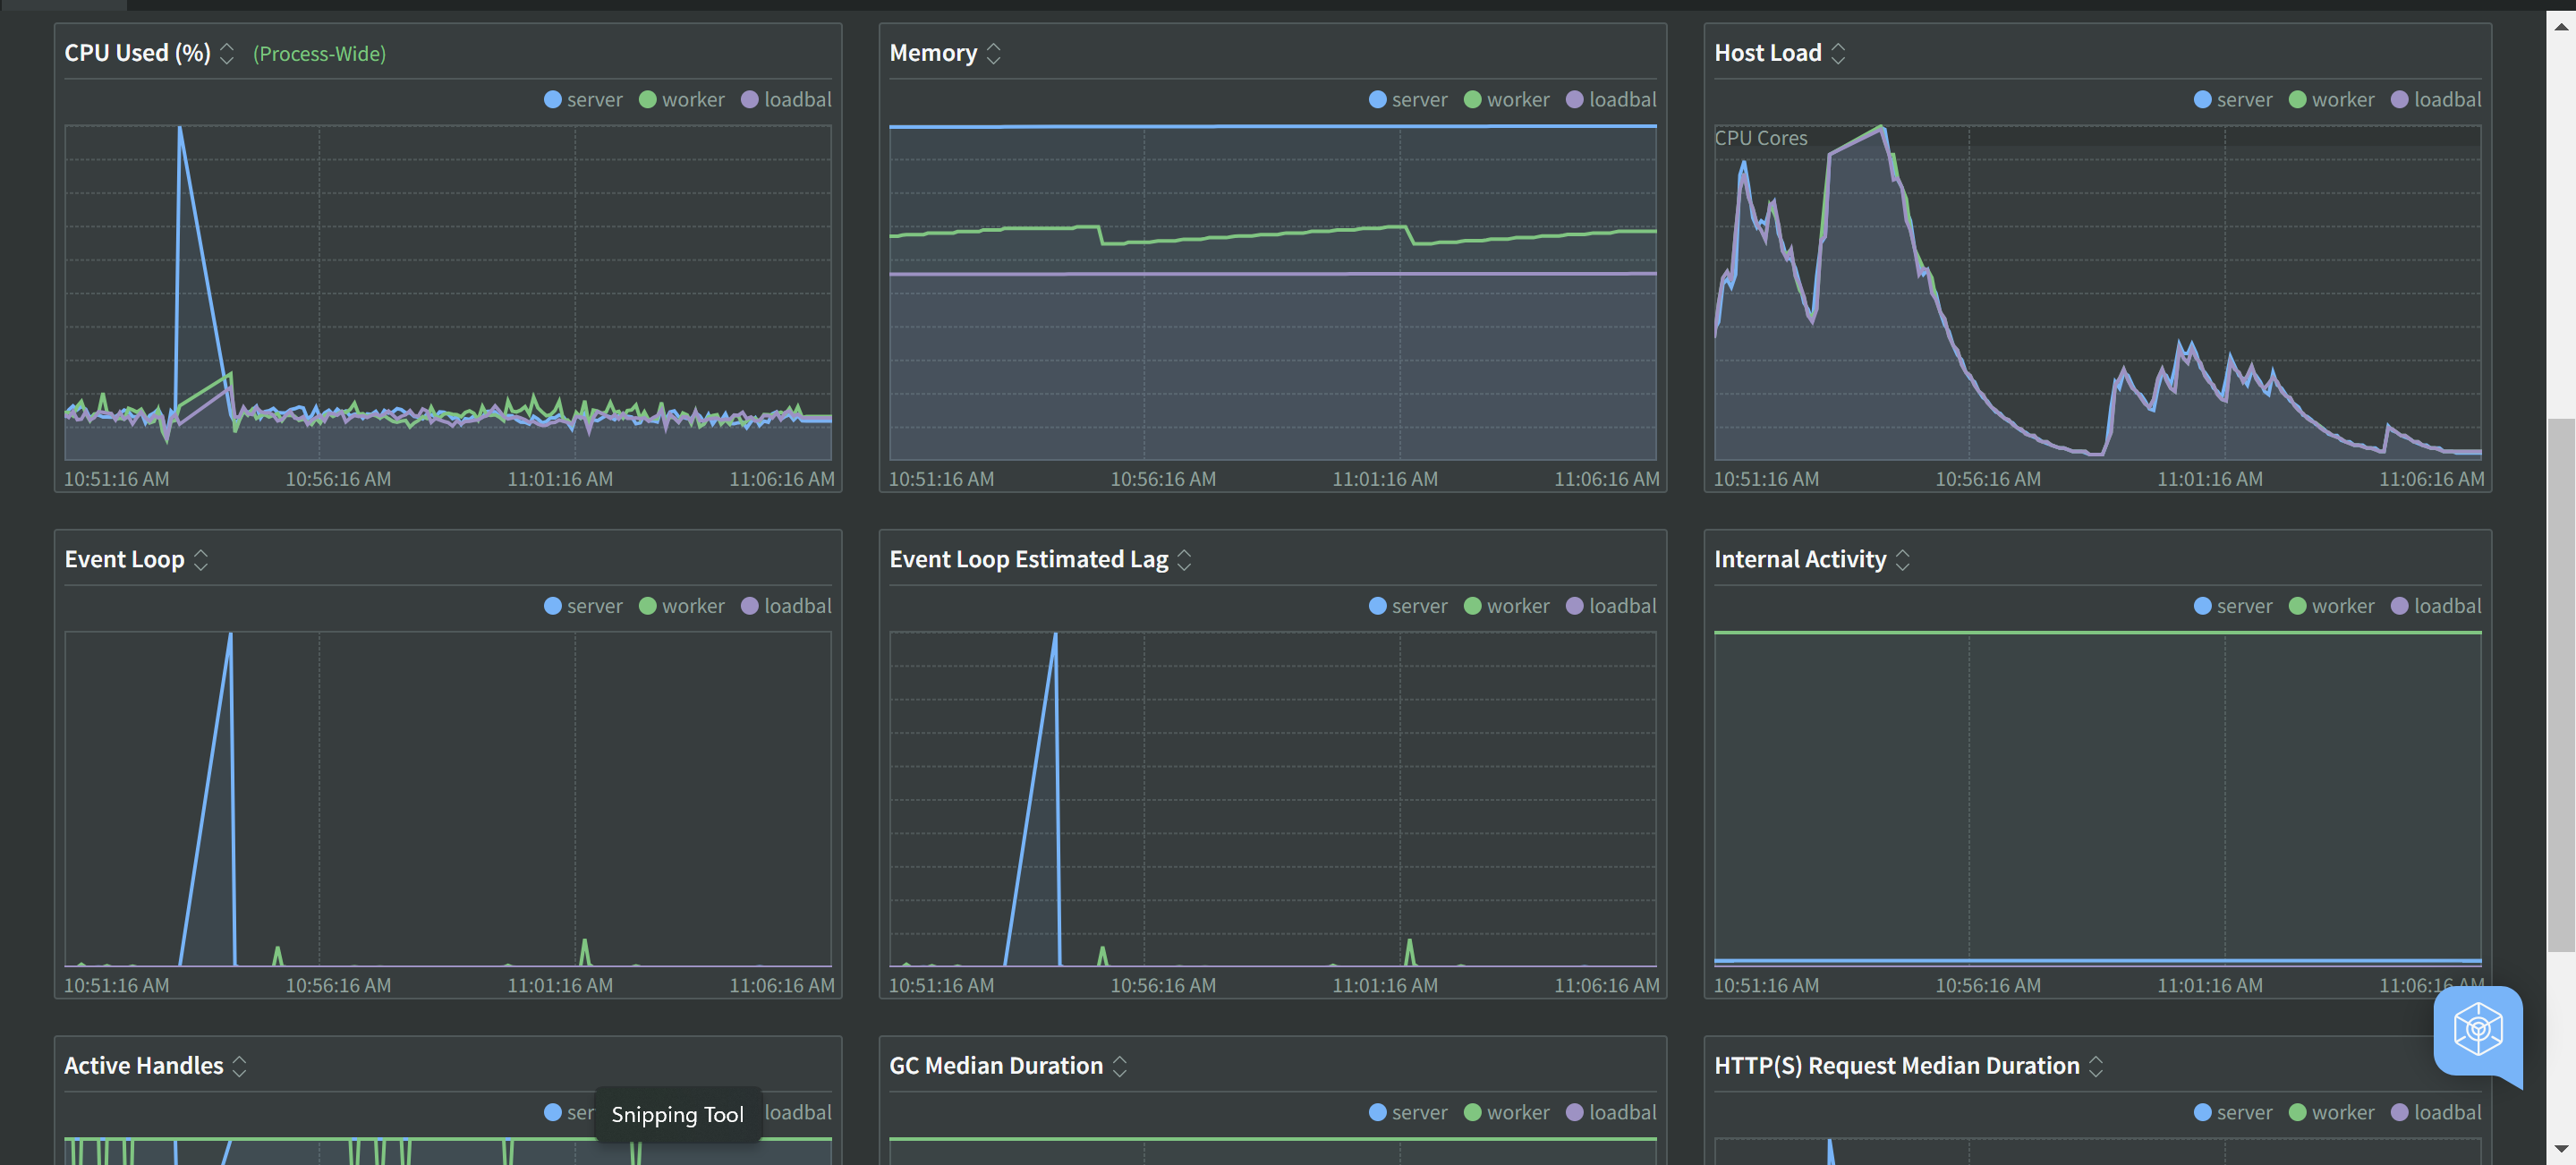
N|Solid UI displays Metrics as a 3x3 grid of graphs with axes able to show any of our many N|Solid Merics. The series selection is managed by the checkboxes in the above Multi Table.
Available series to graph and the time range shown on the graphs are both controlled by the global Filter and Date Range boxes at the top of the N|Solid UI.
How the Metrics Graphs Work
In each of the nine graphs there is a line for each of the up to 4 selectable series in the Table Above and the colors correspond to the list there. The time-frame of each graph will be the same, and any mouseover interactions will show the same point in time on each graph.
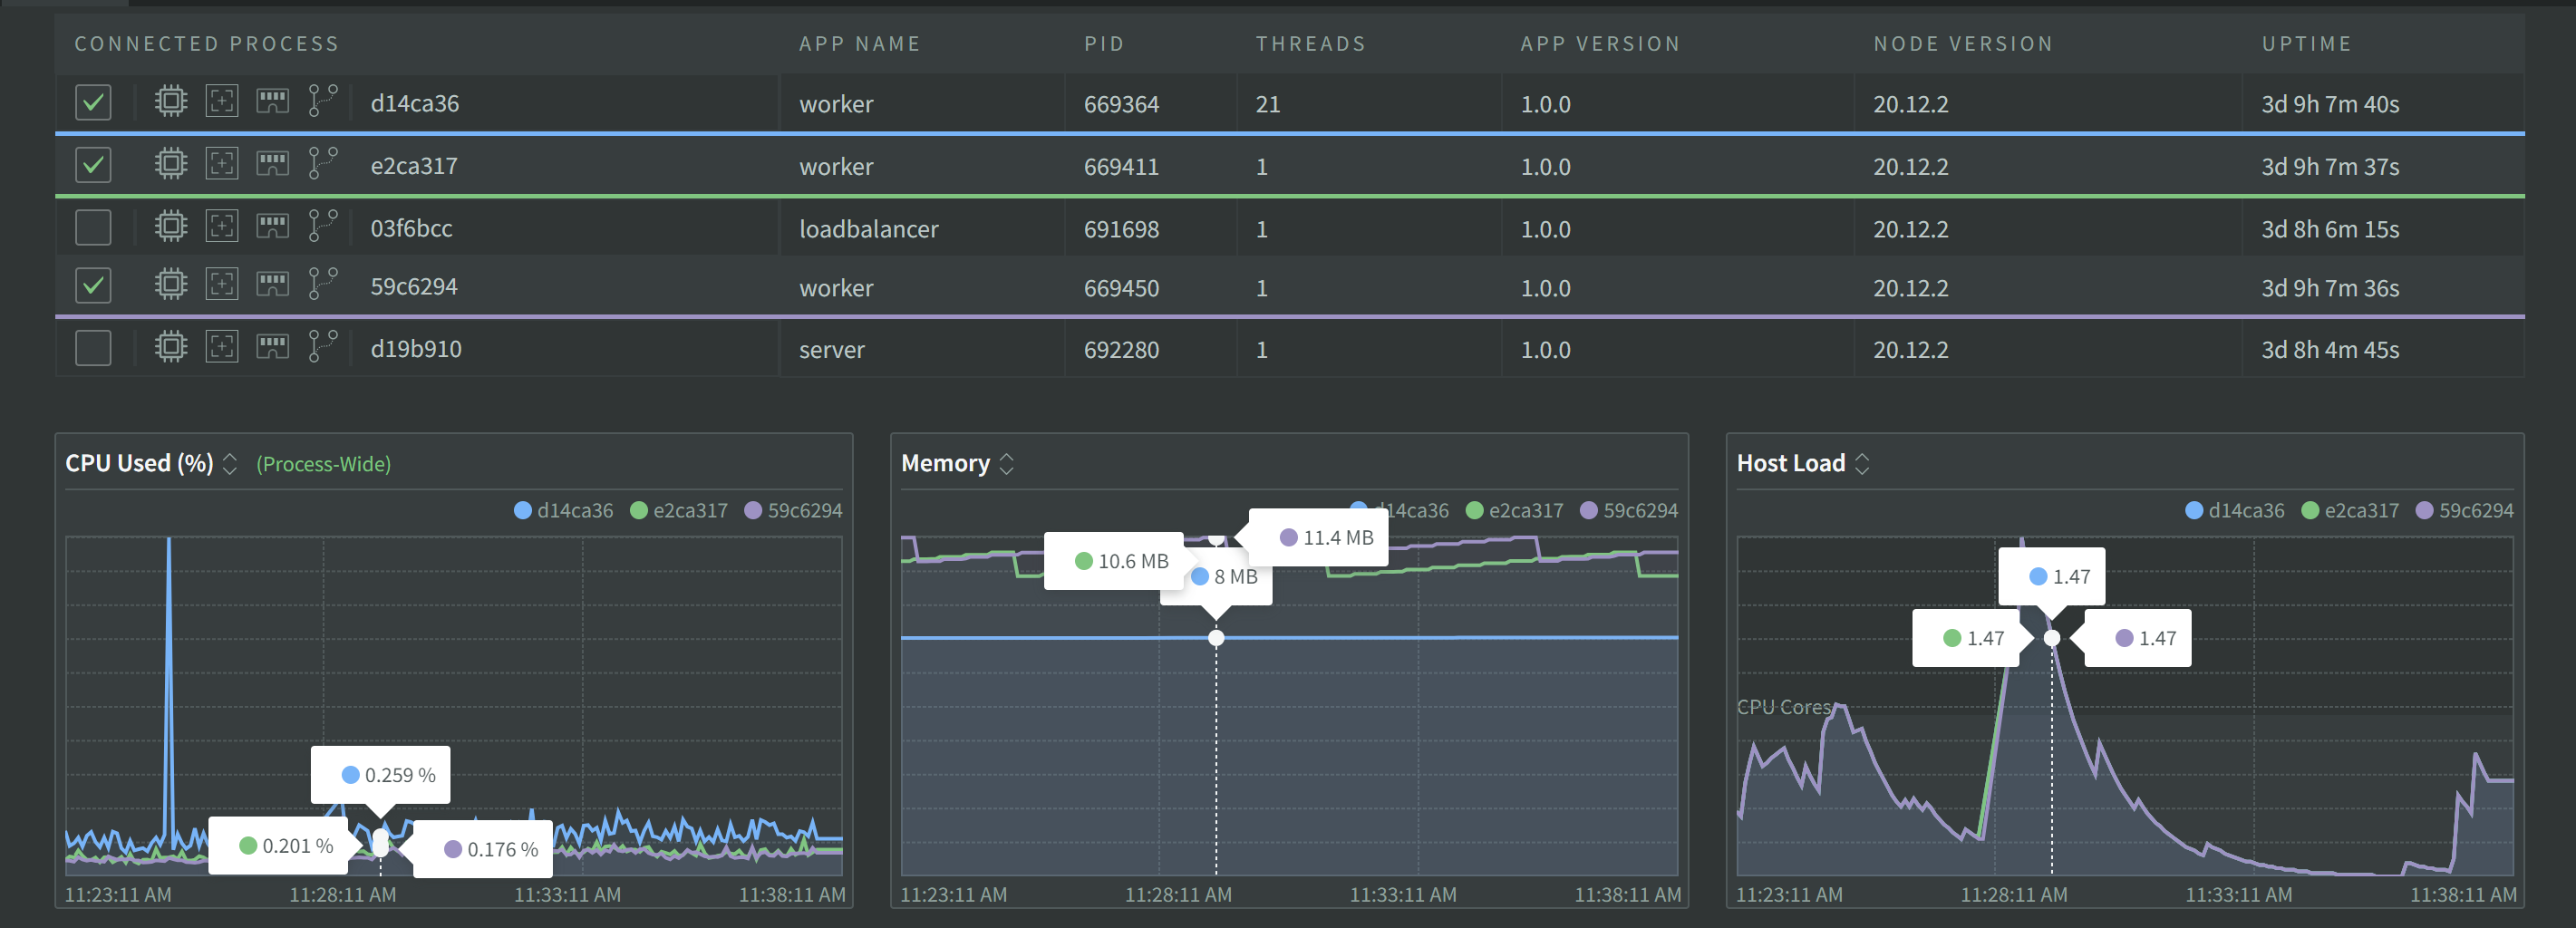
Graph Closeup
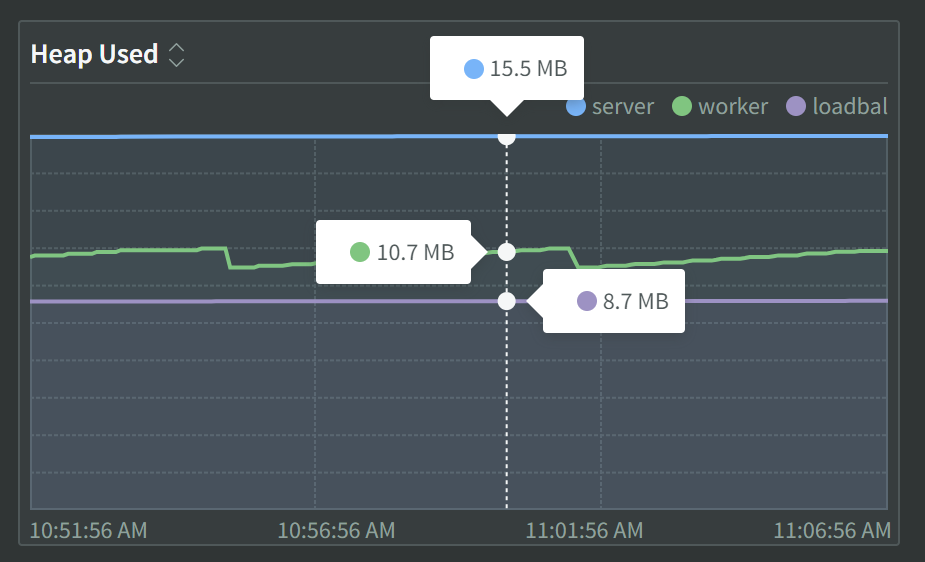
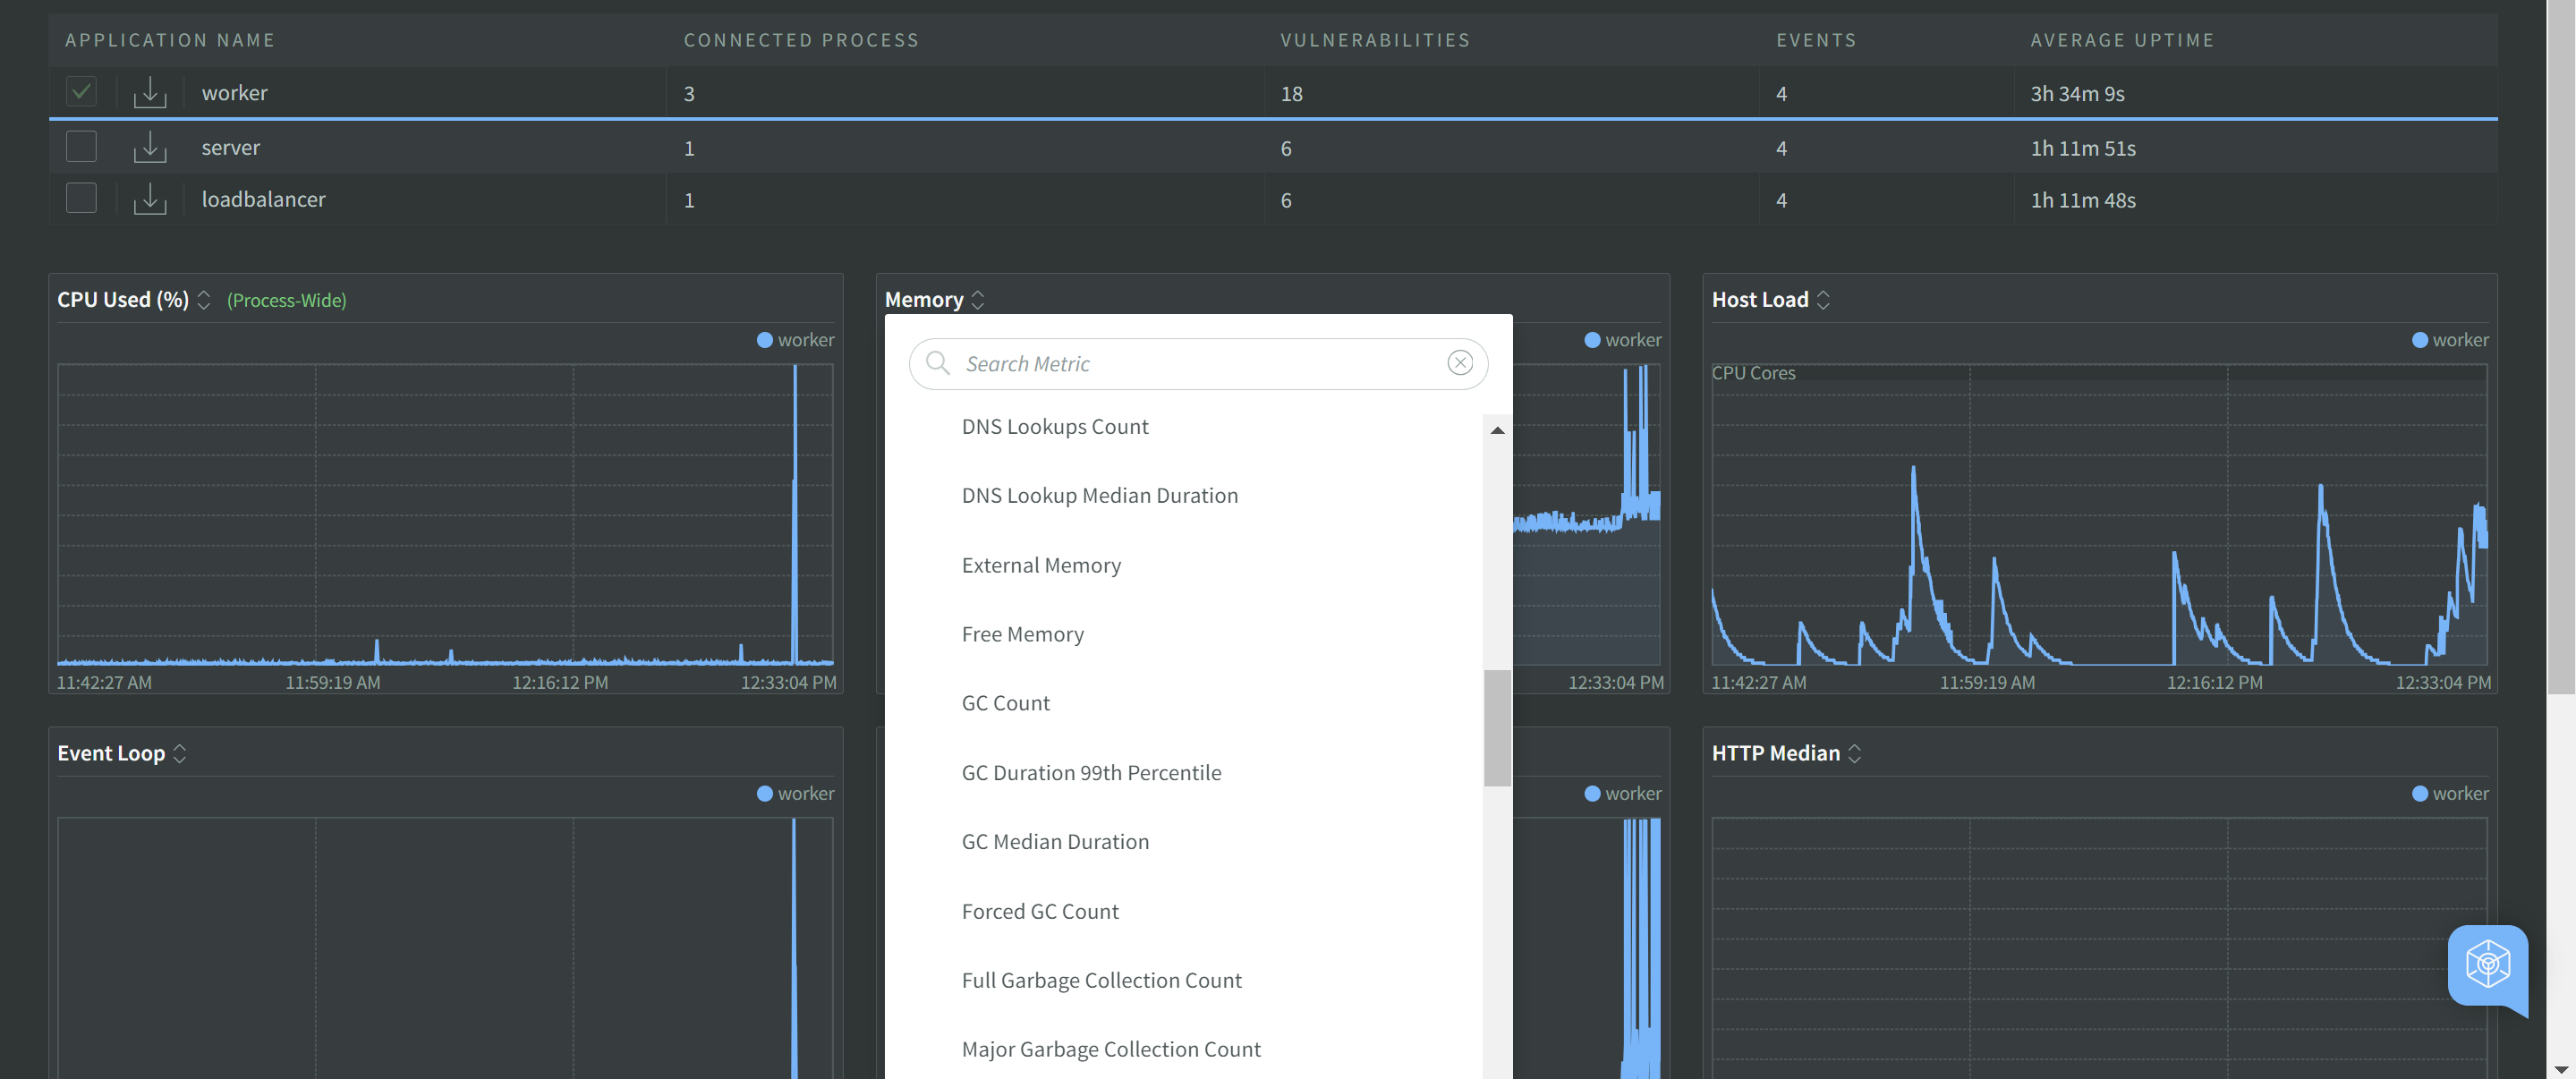
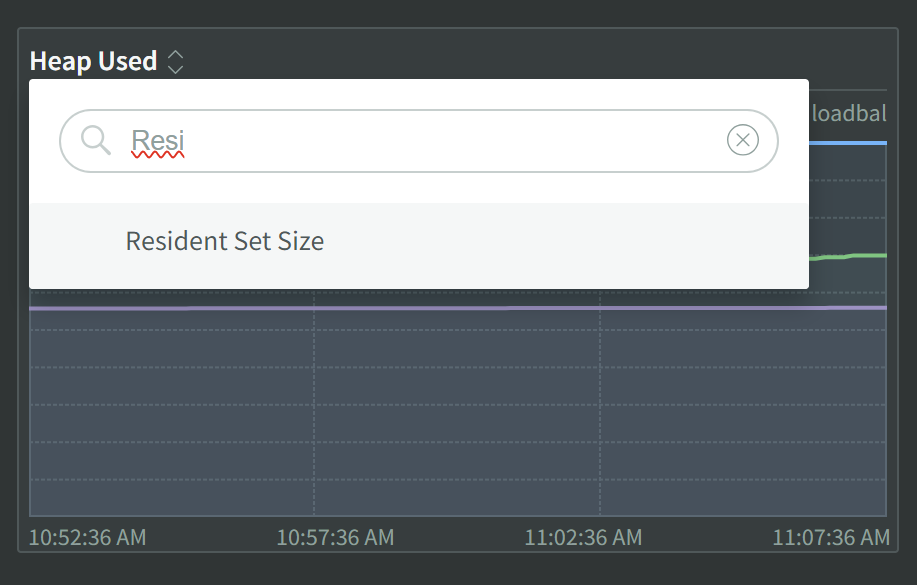
Changing Graph Metrics
Click on the metric name to select a different metric to show. Choose from the list or type a metric name in the search bar to narrow the list results.