Serverless
NodeSource offers Serverless support to collect data during a request in serverless settings. This data aids in debugging latency and other issues, making it ideal for those keen on addressing such problems in a serverless context.
AWS Setup
For using AWS resources, you need to configure the AWS SDK credentials in your environment. Check the AWS documentation to do this. After following the guide, your AWS CLI should be set up correctly for smooth AWS interactions.
Make sure you have all AWS credentials envs configured in your machine.
| Env |
|---|
| AWS_SECRET_ACCESS_KEY |
| AWS_DEFAULT_REGION |
| AWS_ACCESS_KEY_ID |
Configuration
Using nsolid-serverless, you can create the necessary infra resources and configure your serverless application to send telemetry data to the N|Solid Console.
Install
> npm i -g @nodesource/nsolid-serverless
Creating basic infra to collect data
The first step is to create a SQS Queue where we will send the telemetry data.
> nsolid-serverless infra --install
Collecting telemetry data
We need to set up some environment variables and layers in your lambdas to send data to our SQS queue created in the previous step.
> nsolid-serverless functions --install
Help
> nsolid-serverless --help
Adding Integration
After all the functions are set up, you need to configure the N|Solid Console.
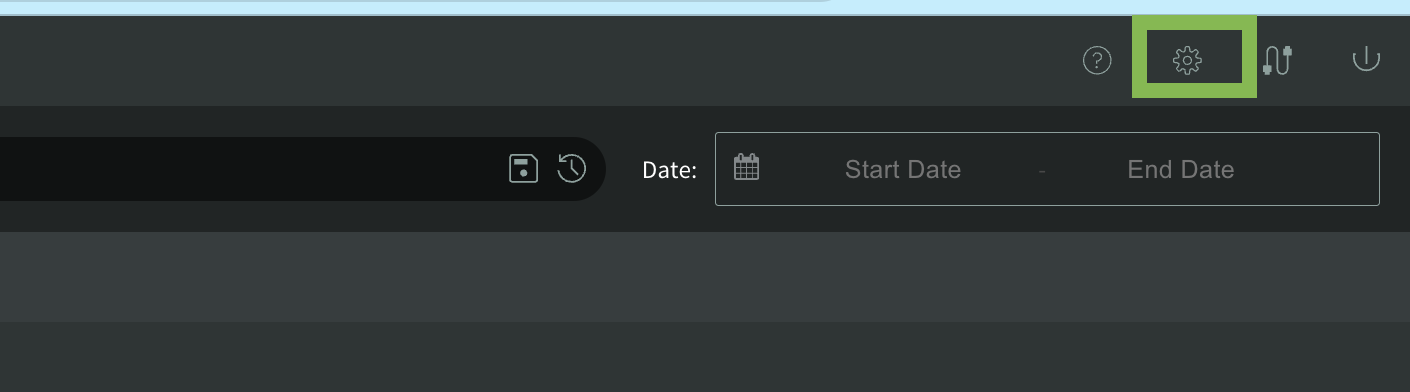
Navigate to Settings > Integration as below in the green box.
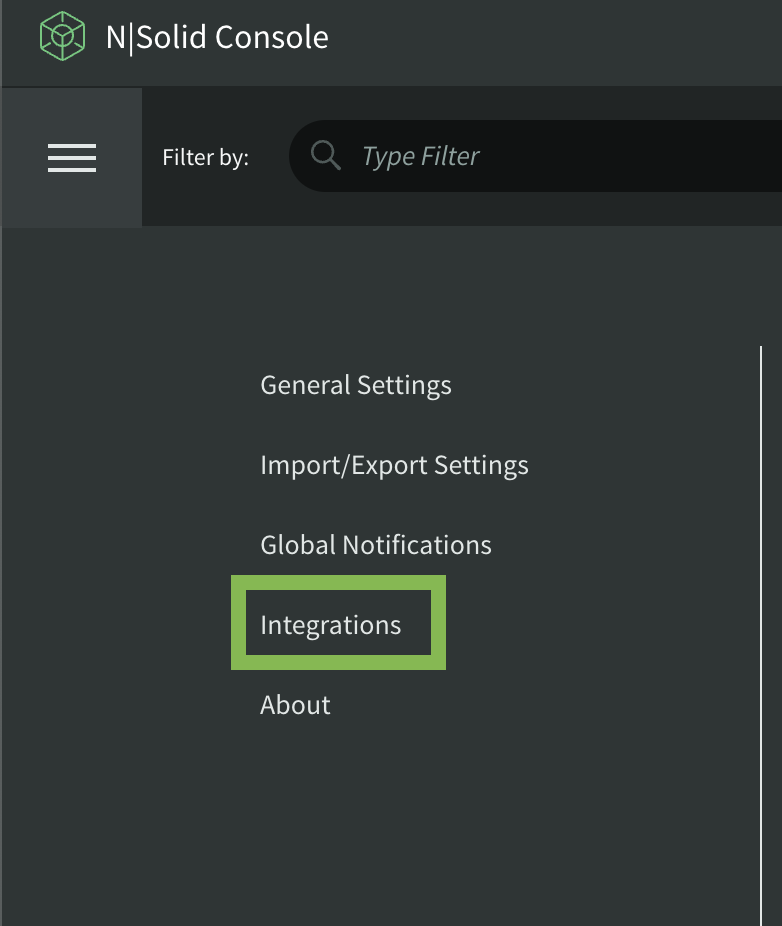
On the left side, there is a section called Integrations:
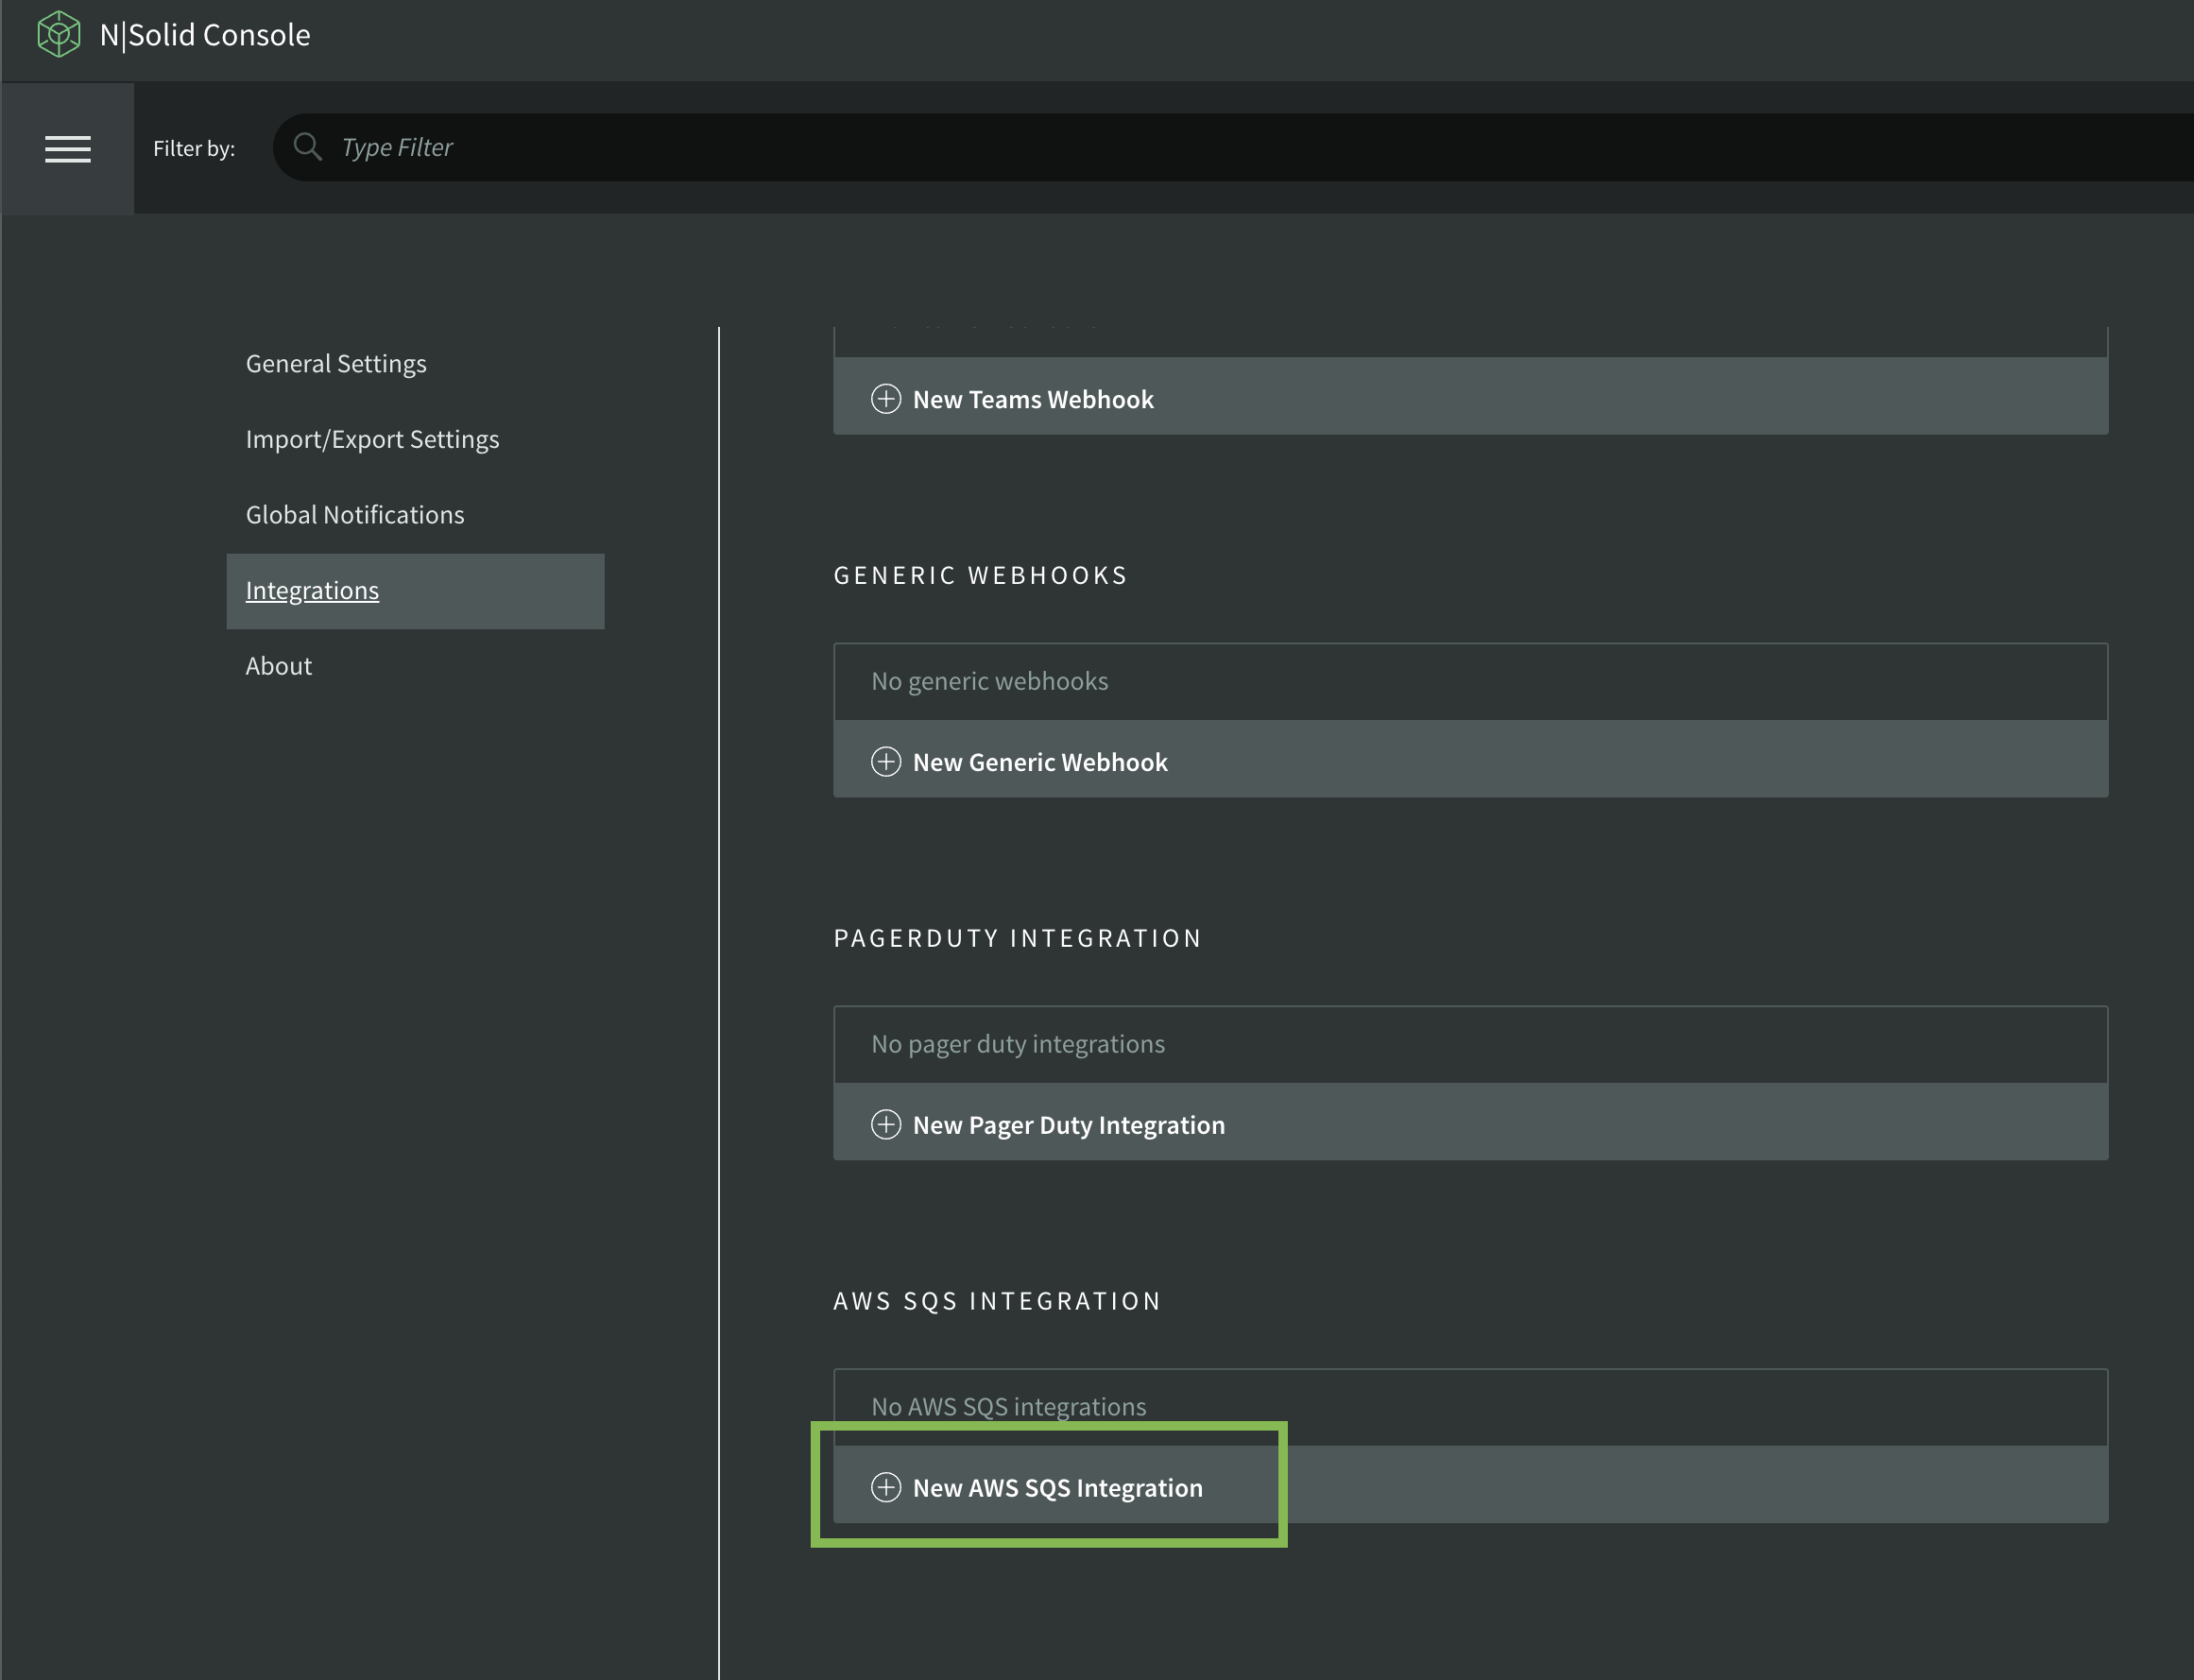
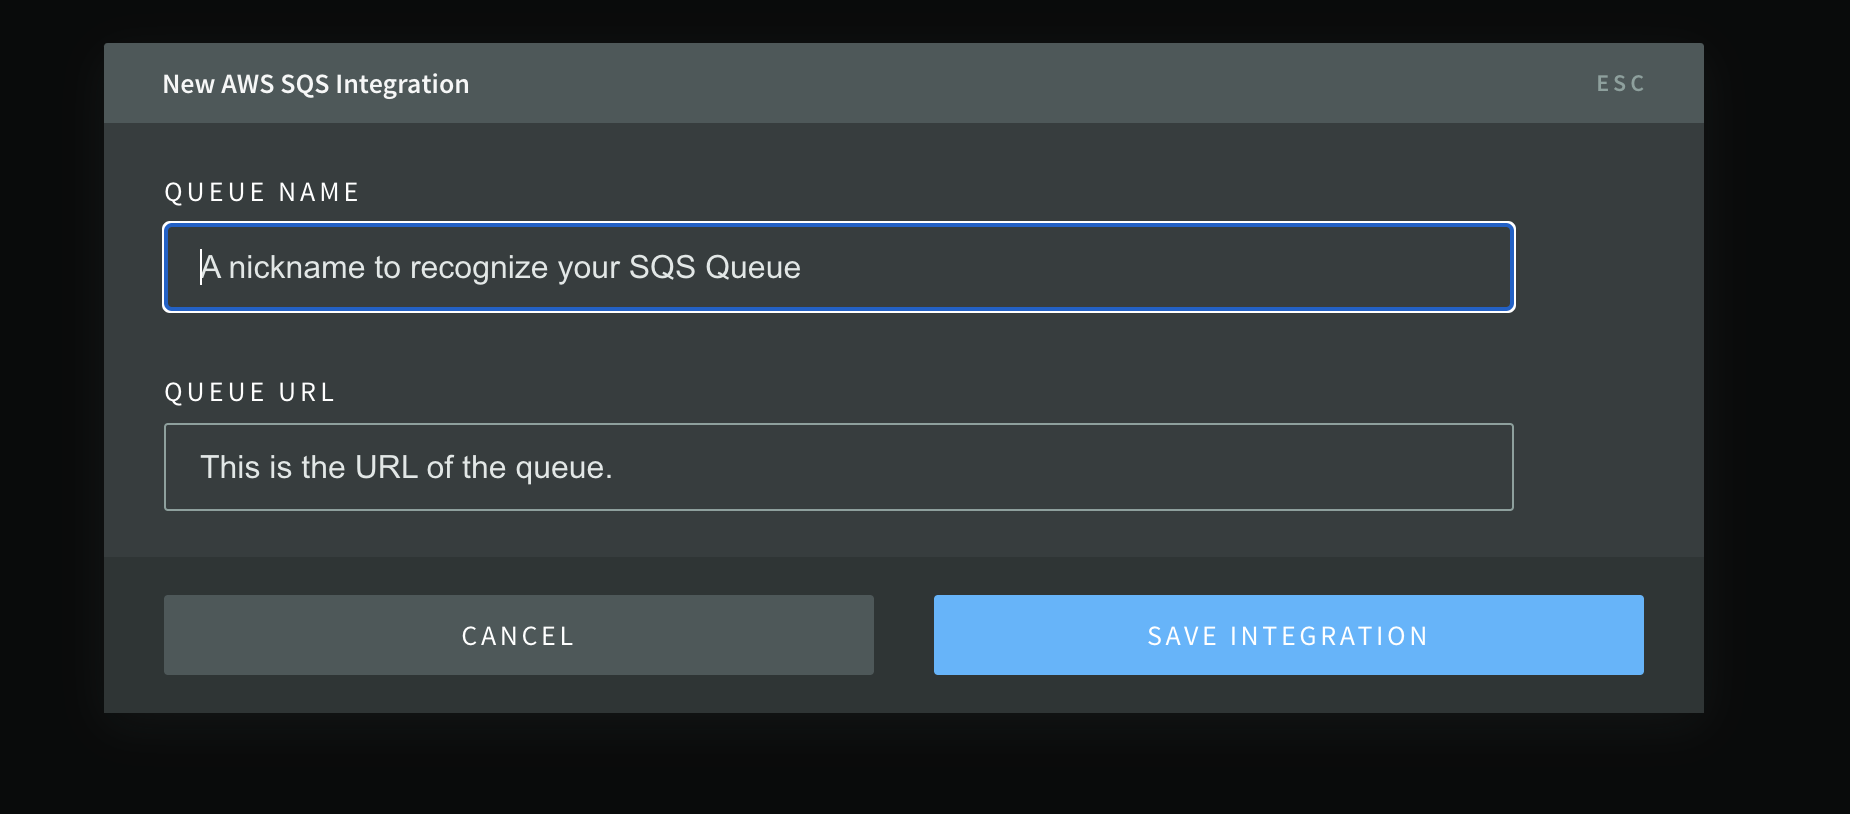
Then scroll down and click on the New AWS SQS Integration button to add the integration. The following form will be displayed:
Fill in the form with the following information:
- Queue Name: The name of the integration.
- Queue URL: https://sqs.\{region}.amazonaws.com/\{account-id}/nsolid-serverless-metrics
Click on the Save Integration button to save the integration.
Monitoring Serverless via N|S Console UI
In the N|Solid Console, go to the applications dashboard and click on the Functions tab on the left side.
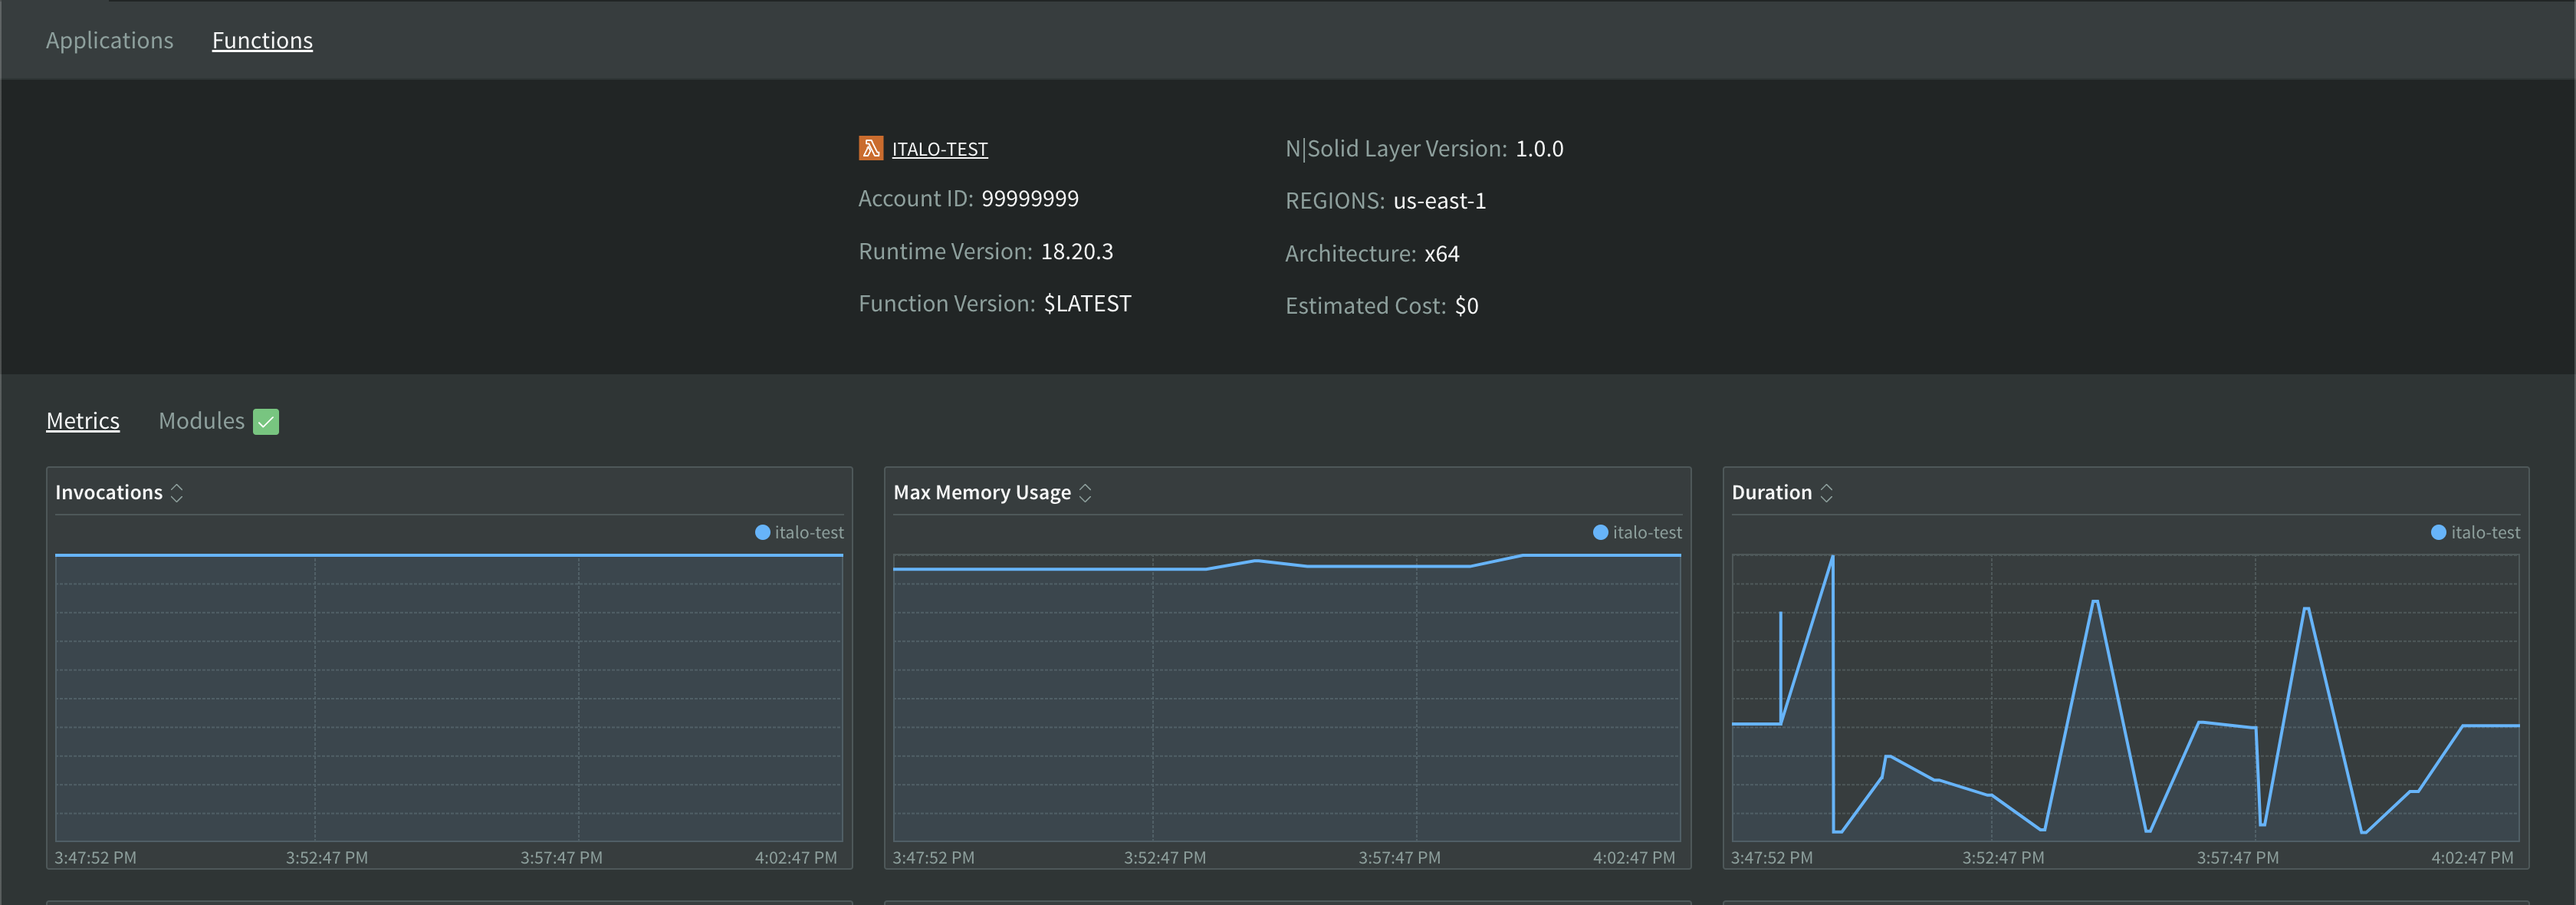
The dashboard for the functions connected will be displayed as below:
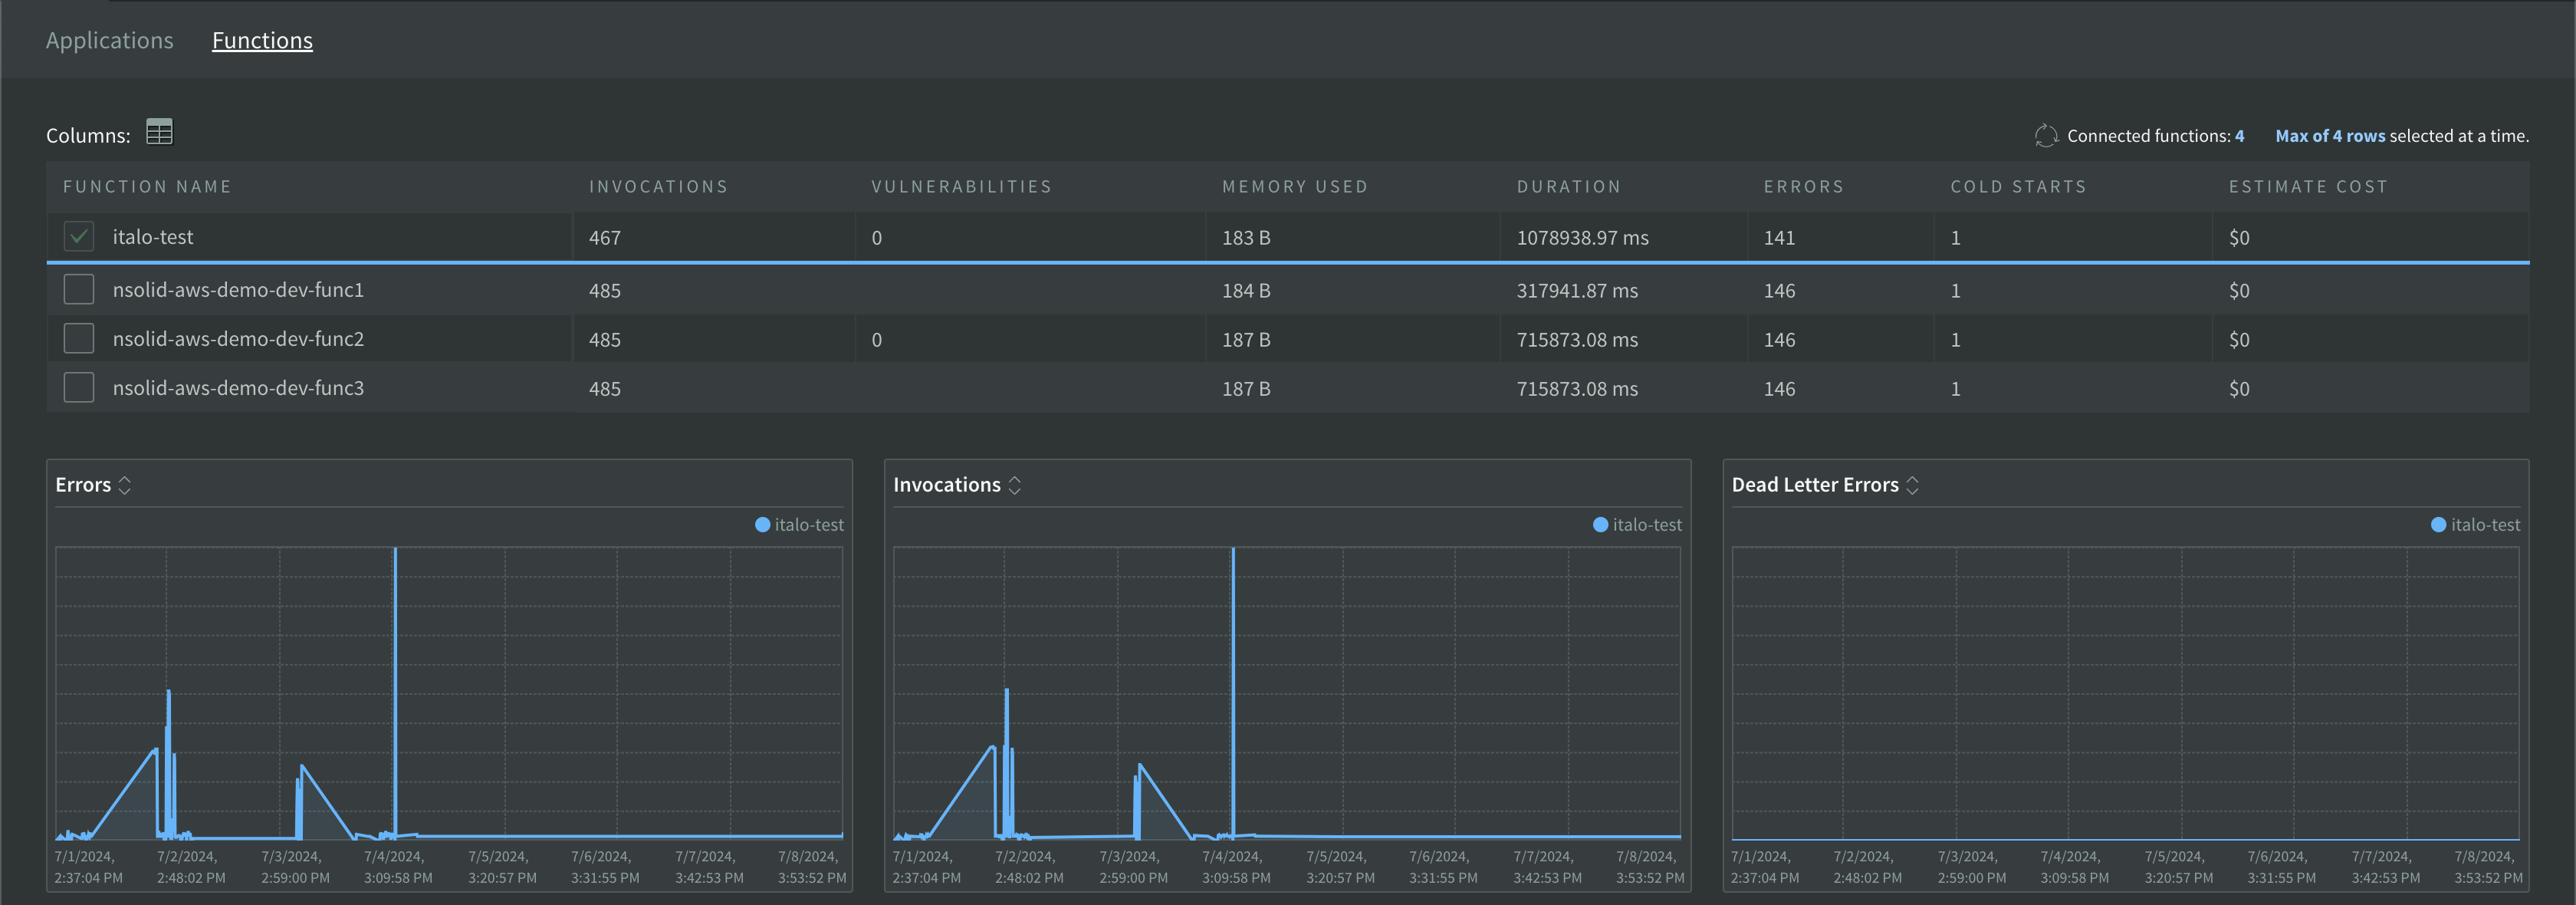
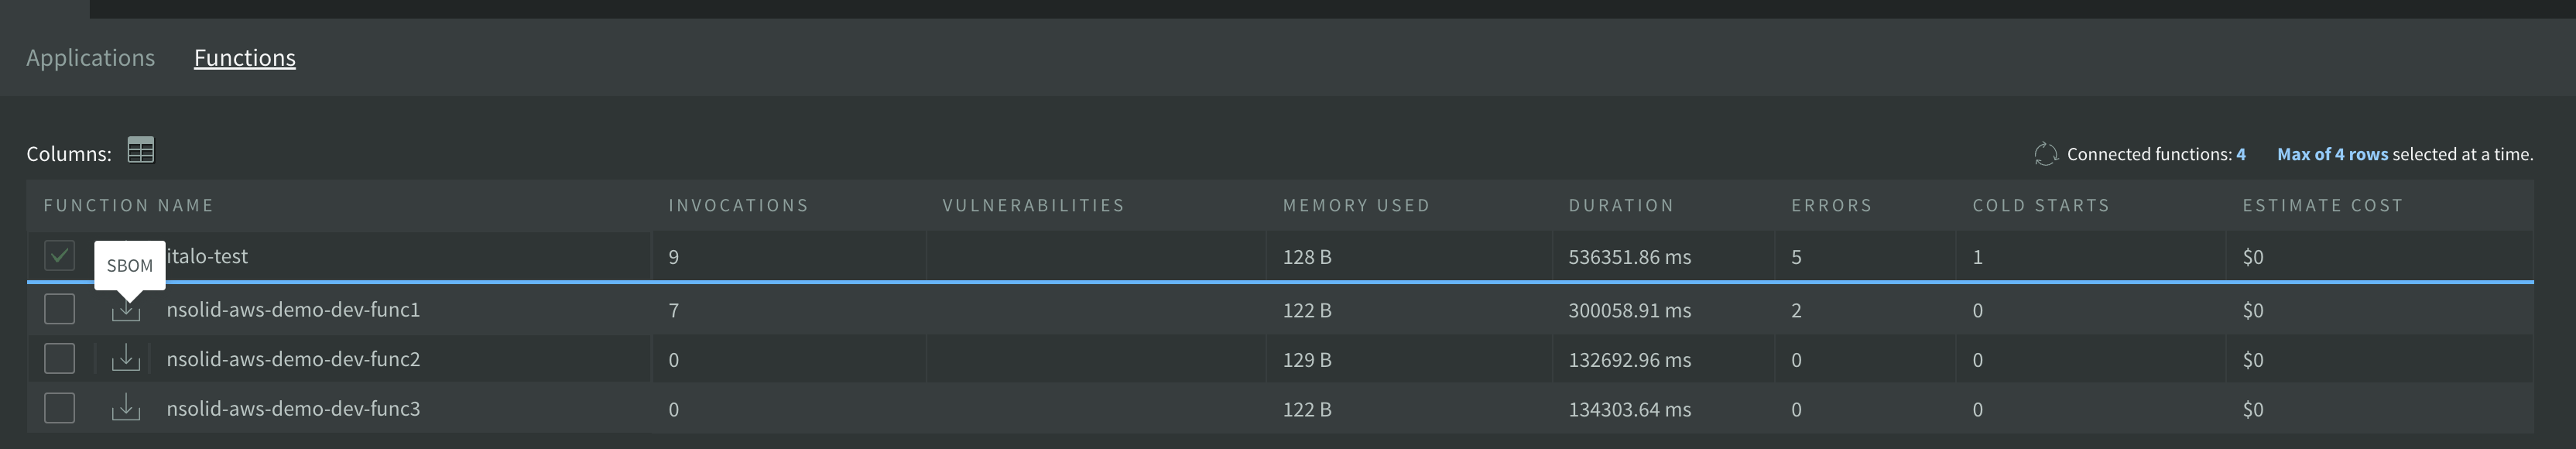
or as below if you have multiple functions:
FUNCTION DETAIL VIEW
Select a function from the list by clicking in the function's name to see the details of the function. The detail view will be displayed as below:
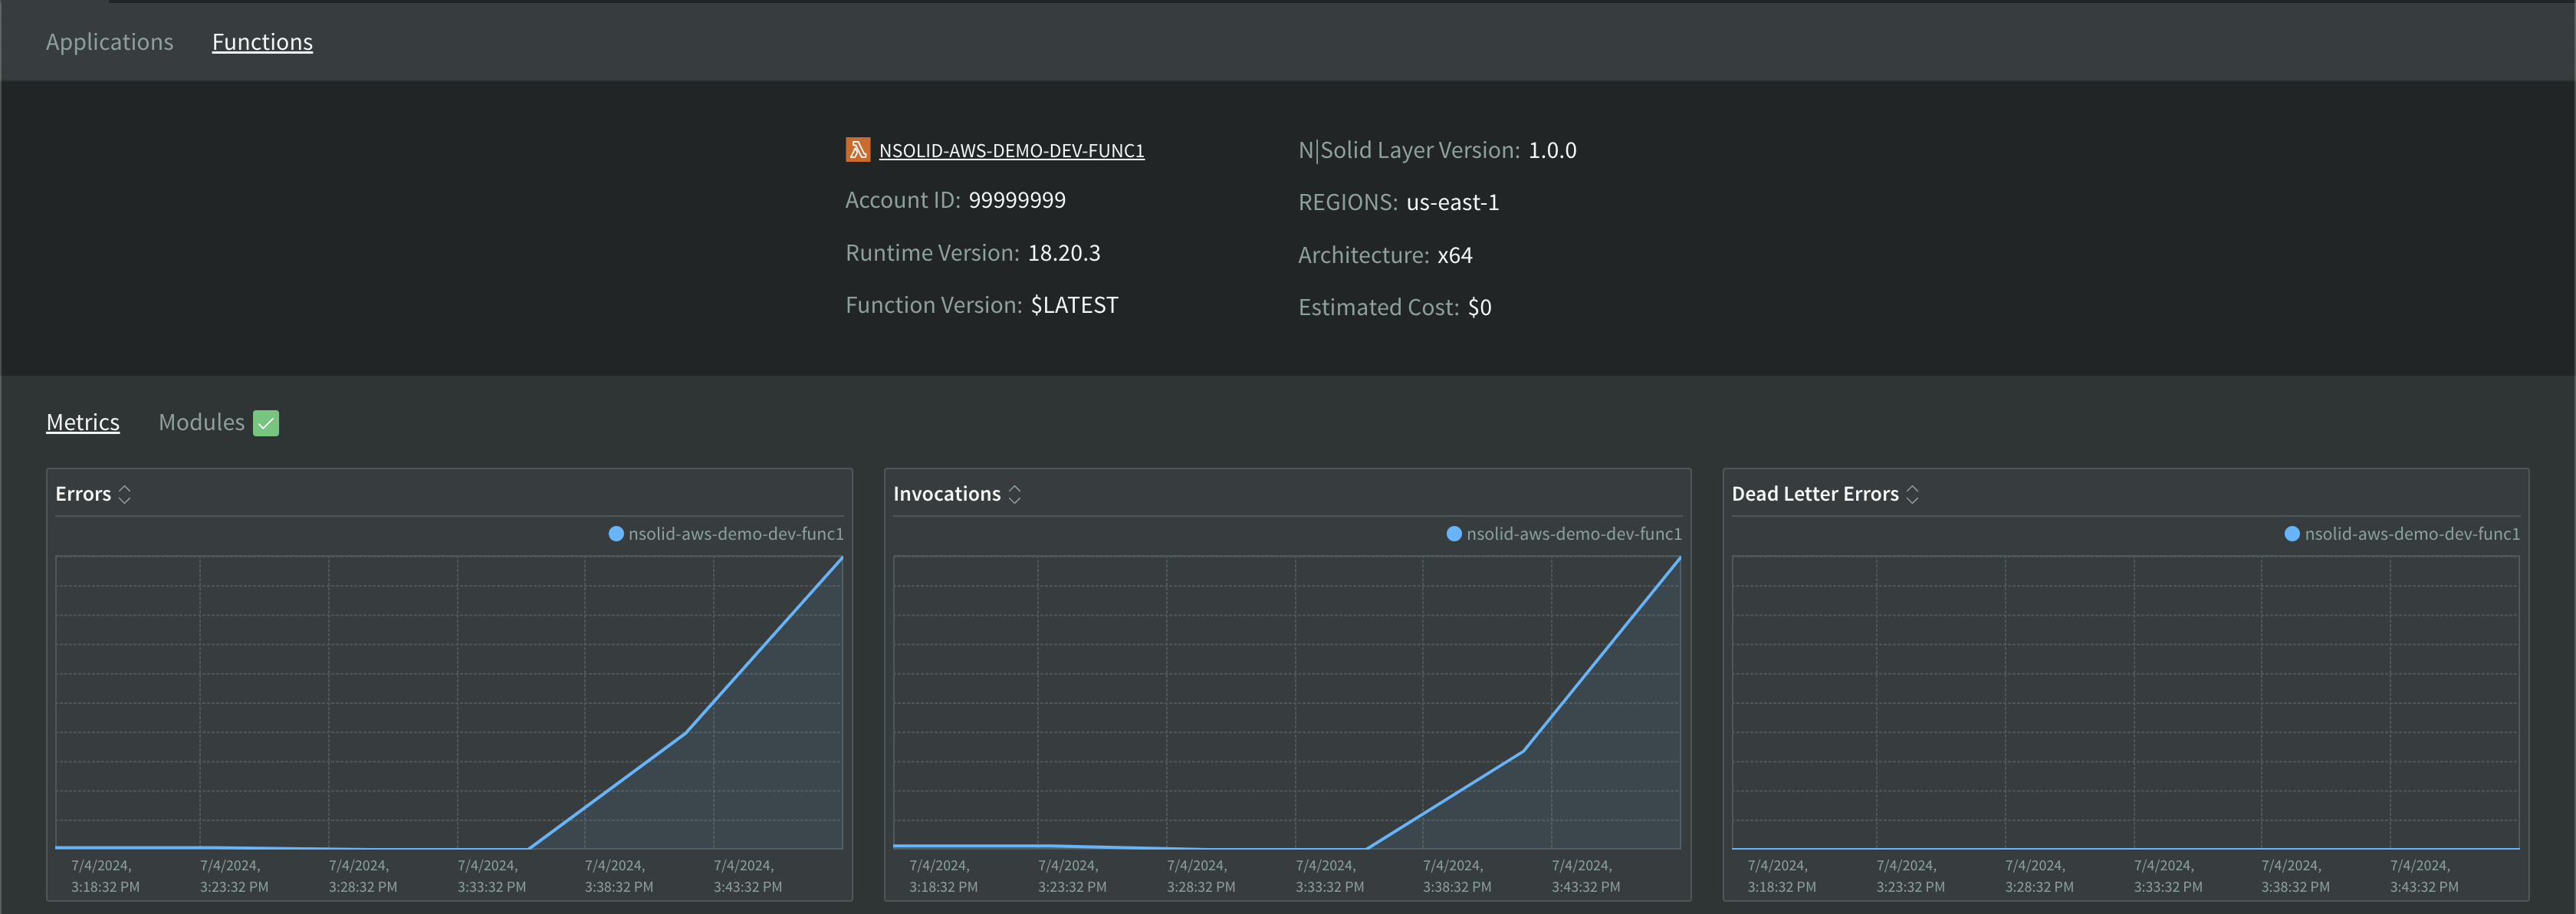
The detail view will display the following information:
- ACCOUNT ID: The account ID of the function.
- RUNTIME VERSION: The version of the Node.js runtime used by the function.
- FUNCTION VERSION: The version of the function.
- NSOLID layer version: the version of the N|Solid layer inside your AWS Lambda
- REGIONS: The aws zone of the function.
- ARCHITECTURE: The architecture of the function.
- ESTIMATED COST: The estimated cost of the function.
Metrics
The metrics tab will display the metrics of the function. There you have 9 boxes that can show many metrics by clicking into metric's name.
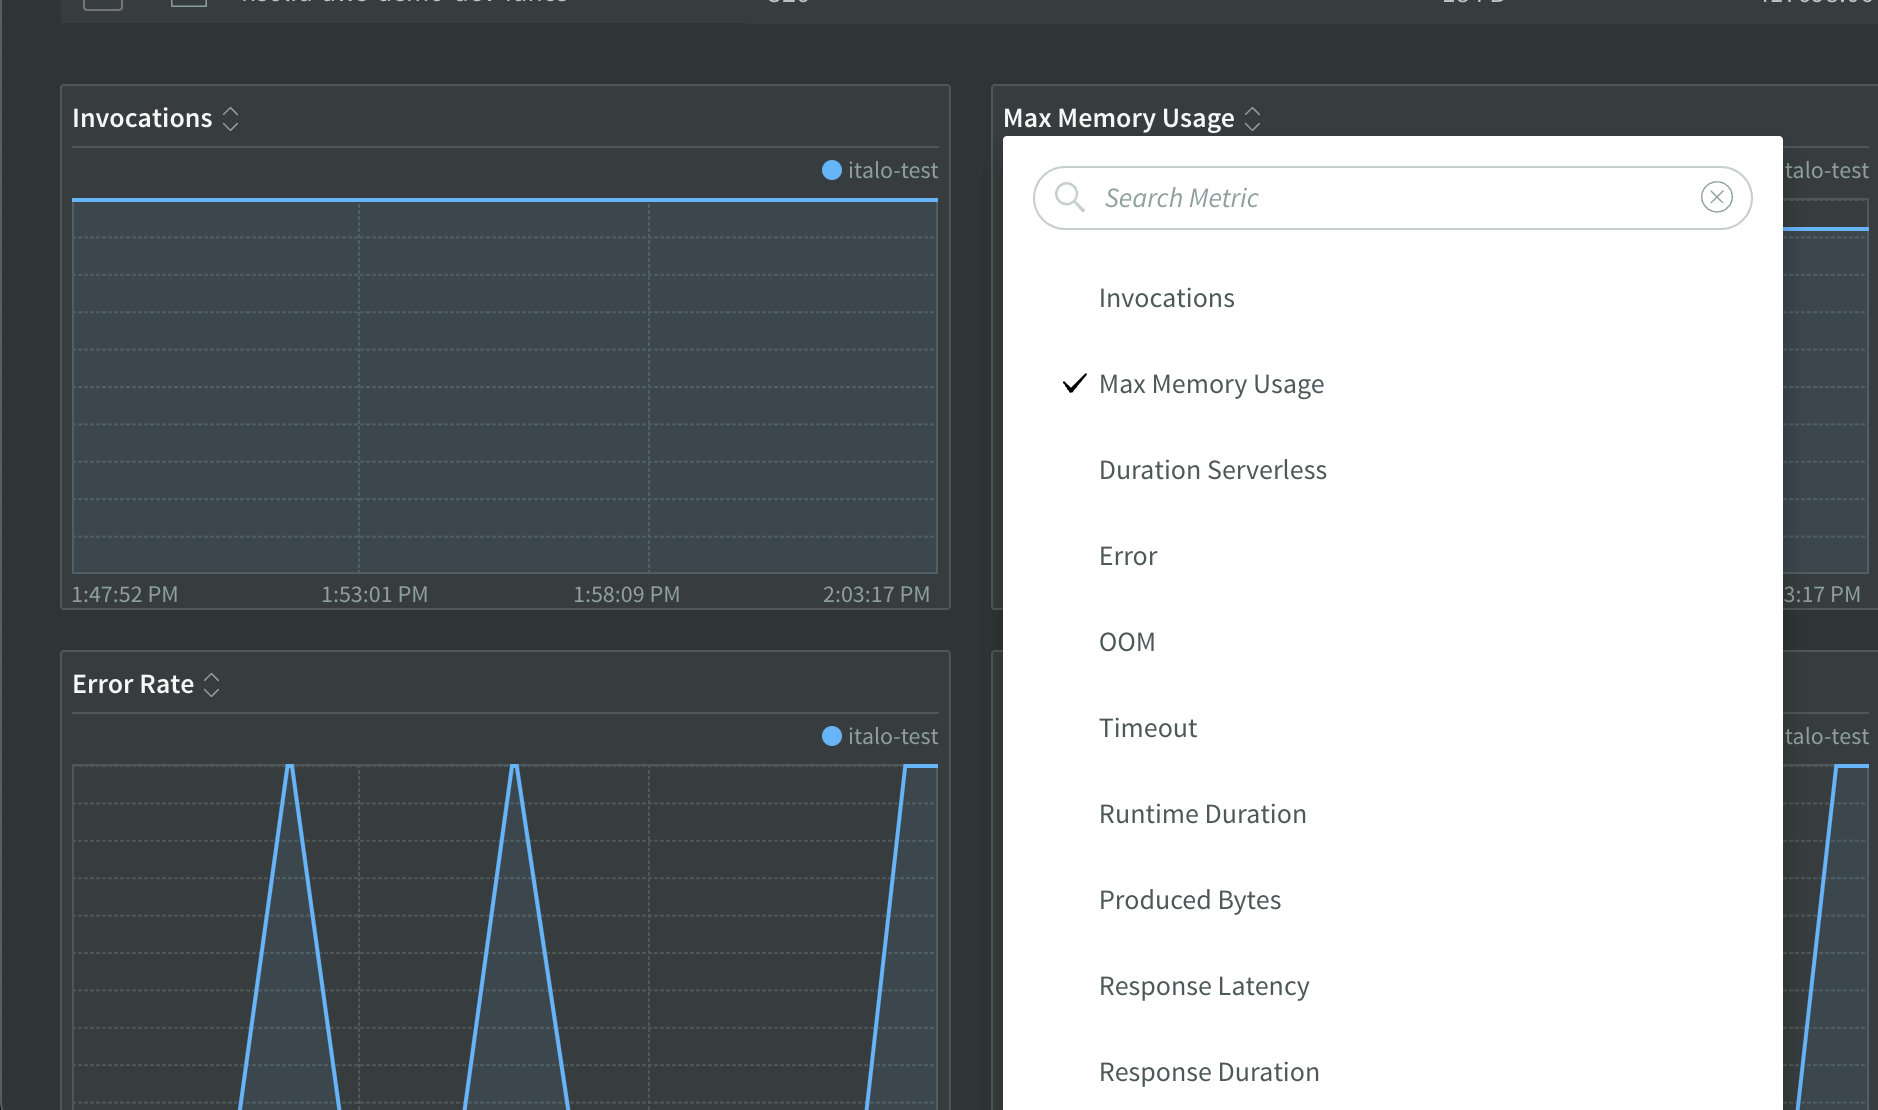
The metrics will display the following information:
Telemetry(realtime) API Metrics
This is the list of metrics we will be generating that come from the Telemetry API. These metrics are real-time and associated to specific functions. Their corresponding aggregations are to be performed in the Telemetry Aggregator.
- Duration: The total time taken for the function to execute from start to finish, measured in milliseconds.
- initDuration: The time taken for the function to initialize, including any set up or warm-up processes, measured in milliseconds.
- billedDuration: The time for which AWS bills the function's execution, measured in milliseconds. This may differ from actual execution time due to rounding or billing increments.
- Invocations: The total number of times the function is called or triggered.
- Max Memory Used: The peak memory usage by the function during its execution.
- Memory Size: The allocated memory size for the function.
- Errors: The total number of errors encountered during the function's execution.
- Error Rate: The ratio of errors to the total number of invocations within the measured time interval.
- Response Duration: The time taken for the function to produce a response, measured in milliseconds.
- Response Latency: The time taken from the invocation of the function until the response is received, measured in milliseconds.
- Produced Bytes: The total amount of data produced by the function, measured in bytes.
- Timeouts: The number of times the function execution exceeded the allowed time limit and was terminated.
- Estimated Cost: The estimated cost of executing the function based on its usage and AWS pricing.
- OOM (Out of Memory): The number of times the function execution failed due to insufficient memory.
- Counters Uptime: The total time the function has been running since it was last started.
- Counters User: The CPU time spent in user mode during the function execution.
- Counters System: The CPU time spent in system mode during the function execution.
- Counters Duration: The total duration of the function execution in milliseconds.
- Counters Idle: The percentage of time the function was idle, waiting for tasks or resources.
- Counters Minor Page Faults: The number of minor page faults (page reclaims) triggered by the function.
- Counters Major Page Faults: The number of major page faults (requiring disk access) triggered by the function.
- Counters Swapped Out: The number of times the function's data was swapped out of memory to disk.
- Counters FS Read: The amount of data read from the file system by the function.
- Counters FS Write: The amount of data written to the file system by the function.
- Counters IPC Sent: The number of inter-process communication messages sent by the function.
- Counters IPC Received: The number of inter-process communication messages received by the function.
- Counters Signals Count: The number of signals received by the function.
- Counters Voluntary Context Switches: The number of times the function voluntarily yielded the CPU.
- Counters Involuntary Context Switches: The number of times the function was forcibly switched out by the CPU scheduler.
- Billed Duration: The total billed duration of the function execution, measured in milliseconds.
- Post Runtime Duration: The duration of the post-execution phase of the function, measured in milliseconds.
- Init Counters Bootstrap Complete: The time at which the function's bootstrap process completed.
- Init Counters Environment: The environment in which the function is running (e.g., dev, staging, prod).
- Init Counters Loop Start: The time at which the function's main execution loop started.
- Init Counters Node Start: The time at which the function's node process started.
- Init Counters Start Time: The exact time the function started executing.
- Init Counters V8 Start: The start time of the V8 engine for the function.
- Post Runtime Execution Duration: The duration of the post-execution phase, specifically the execution time, measured in milliseconds.
Cloudwatch Metrics
These metrics are extracted directly from the Cloudwatch API by the Lambda Metrics Forwarder and are not real-time as the ones from the Telemetry API. The list is:
- Invocations: The total number of times the function is invoked.
- Errors: The total number of errors encountered during the function's execution.
- Dead Letter Errors: The number of errors when the function attempts to send a message to a dead letter queue.
- Destination Delivery Failures: The number of times the function failed to deliver messages to a destination.
- Throttles: The number of times the function execution was throttled due to exceeding concurrency limits.
- Provisioned Concurrency Invocations: The number of times the function was invoked with provisioned concurrency.
- Provisioned Concurrency Spillover Invocations: The number of times invocations spilled over beyond the provisioned concurrency limit.
- Maximum Concurrent Executions: The peak number of concurrent executions of the function.
- Maximum Provisioned Concurrent Executions: The peak number of concurrent executions using provisioned concurrency.
- Maximum Unreserved Concurrent Executions: The peak number of concurrent executions without reserved concurrency.
- Maximum Duration: The longest execution time of the function, measured in milliseconds.
- Minimum Duration: The shortest execution time of the function, measured in milliseconds.
- Duration P50: The median (50th percentile) execution time of the function, measured in milliseconds.
- Duration P90: The 90th percentile execution time of the function, measured in milliseconds.
- Maximum Post Runtime Extensions Duration: The longest duration of the post-execution phase, measured in milliseconds.
- Minimum Post Runtime Extensions Duration: The shortest duration of the post-execution phase, measured in milliseconds.
- Post Runtime Extensions Duration P50: The median (50th percentile) duration of the post-execution phase, measured in milliseconds.
- Post Runtime Extensions Duration P90: The 90th percentile duration of the post-execution phase, measured in milliseconds.
- Average Iterator Age: The average age of the iterator, indicating the time taken to process data streams.
- Maximum Iterator Age: The longest time taken to process a data stream item.
- Provisioned Concurrency Utilization: The percentage of provisioned concurrency utilized by the function.
- Duration: The total duration of the function execution, measured in milliseconds.
- Post Runtime Extensions Duration: The duration of the post-execution phase, measured in milliseconds.
- Iterator Age: The age of the iterator, indicating the time taken to process data streams.
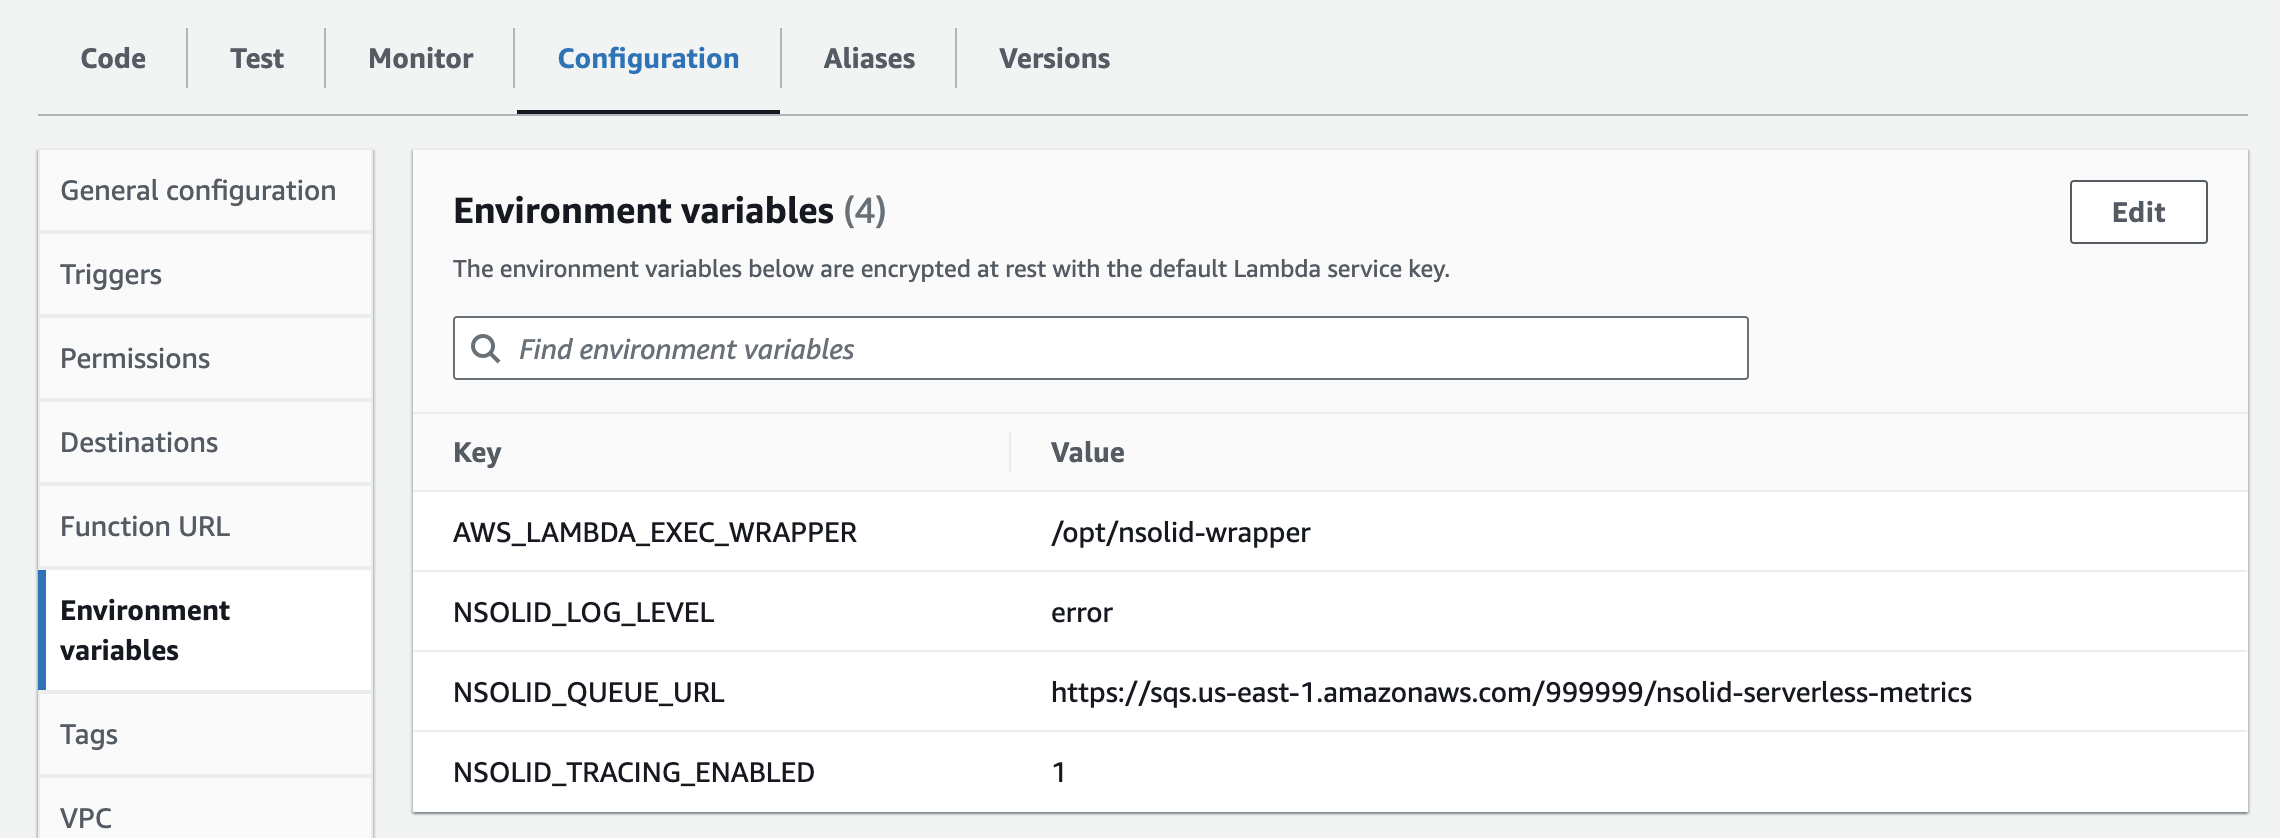
Loading OpenTelemetry Instrumentation Modules
Inside your lambda environment variables config, the NSOLID_INSTRUMENTATION environment variable is used to specify and load the opentelemetry instrumentation modules that you want to utilize within your application. To enable instrumentation for specific modules, follow these steps:
-
For HTTP requests using the
httpmodule, set theNSOLID_INSTRUMENTATIONenvironment variable tohttp. -
If you're also performing PostgreSQL queries using the
pgmodule, include it in theNSOLID_INSTRUMENTATIONenvironment variable like this:http,pg. -
Make sure to list all the relevant instrumentation modules required for your application. This will enable tracing and monitoring for the specified modules, providing valuable insights into their performance and behavior.
Tracing
To enable the Tracing using N|Solid, set the lambda's env var NSOLID_TRACING_ENABLED=1.
By enabling this feature, you can troubleshoot HTTP, DNS and other network request problems that you might encounter using the N|Solid Console.
The view will be shown as below:
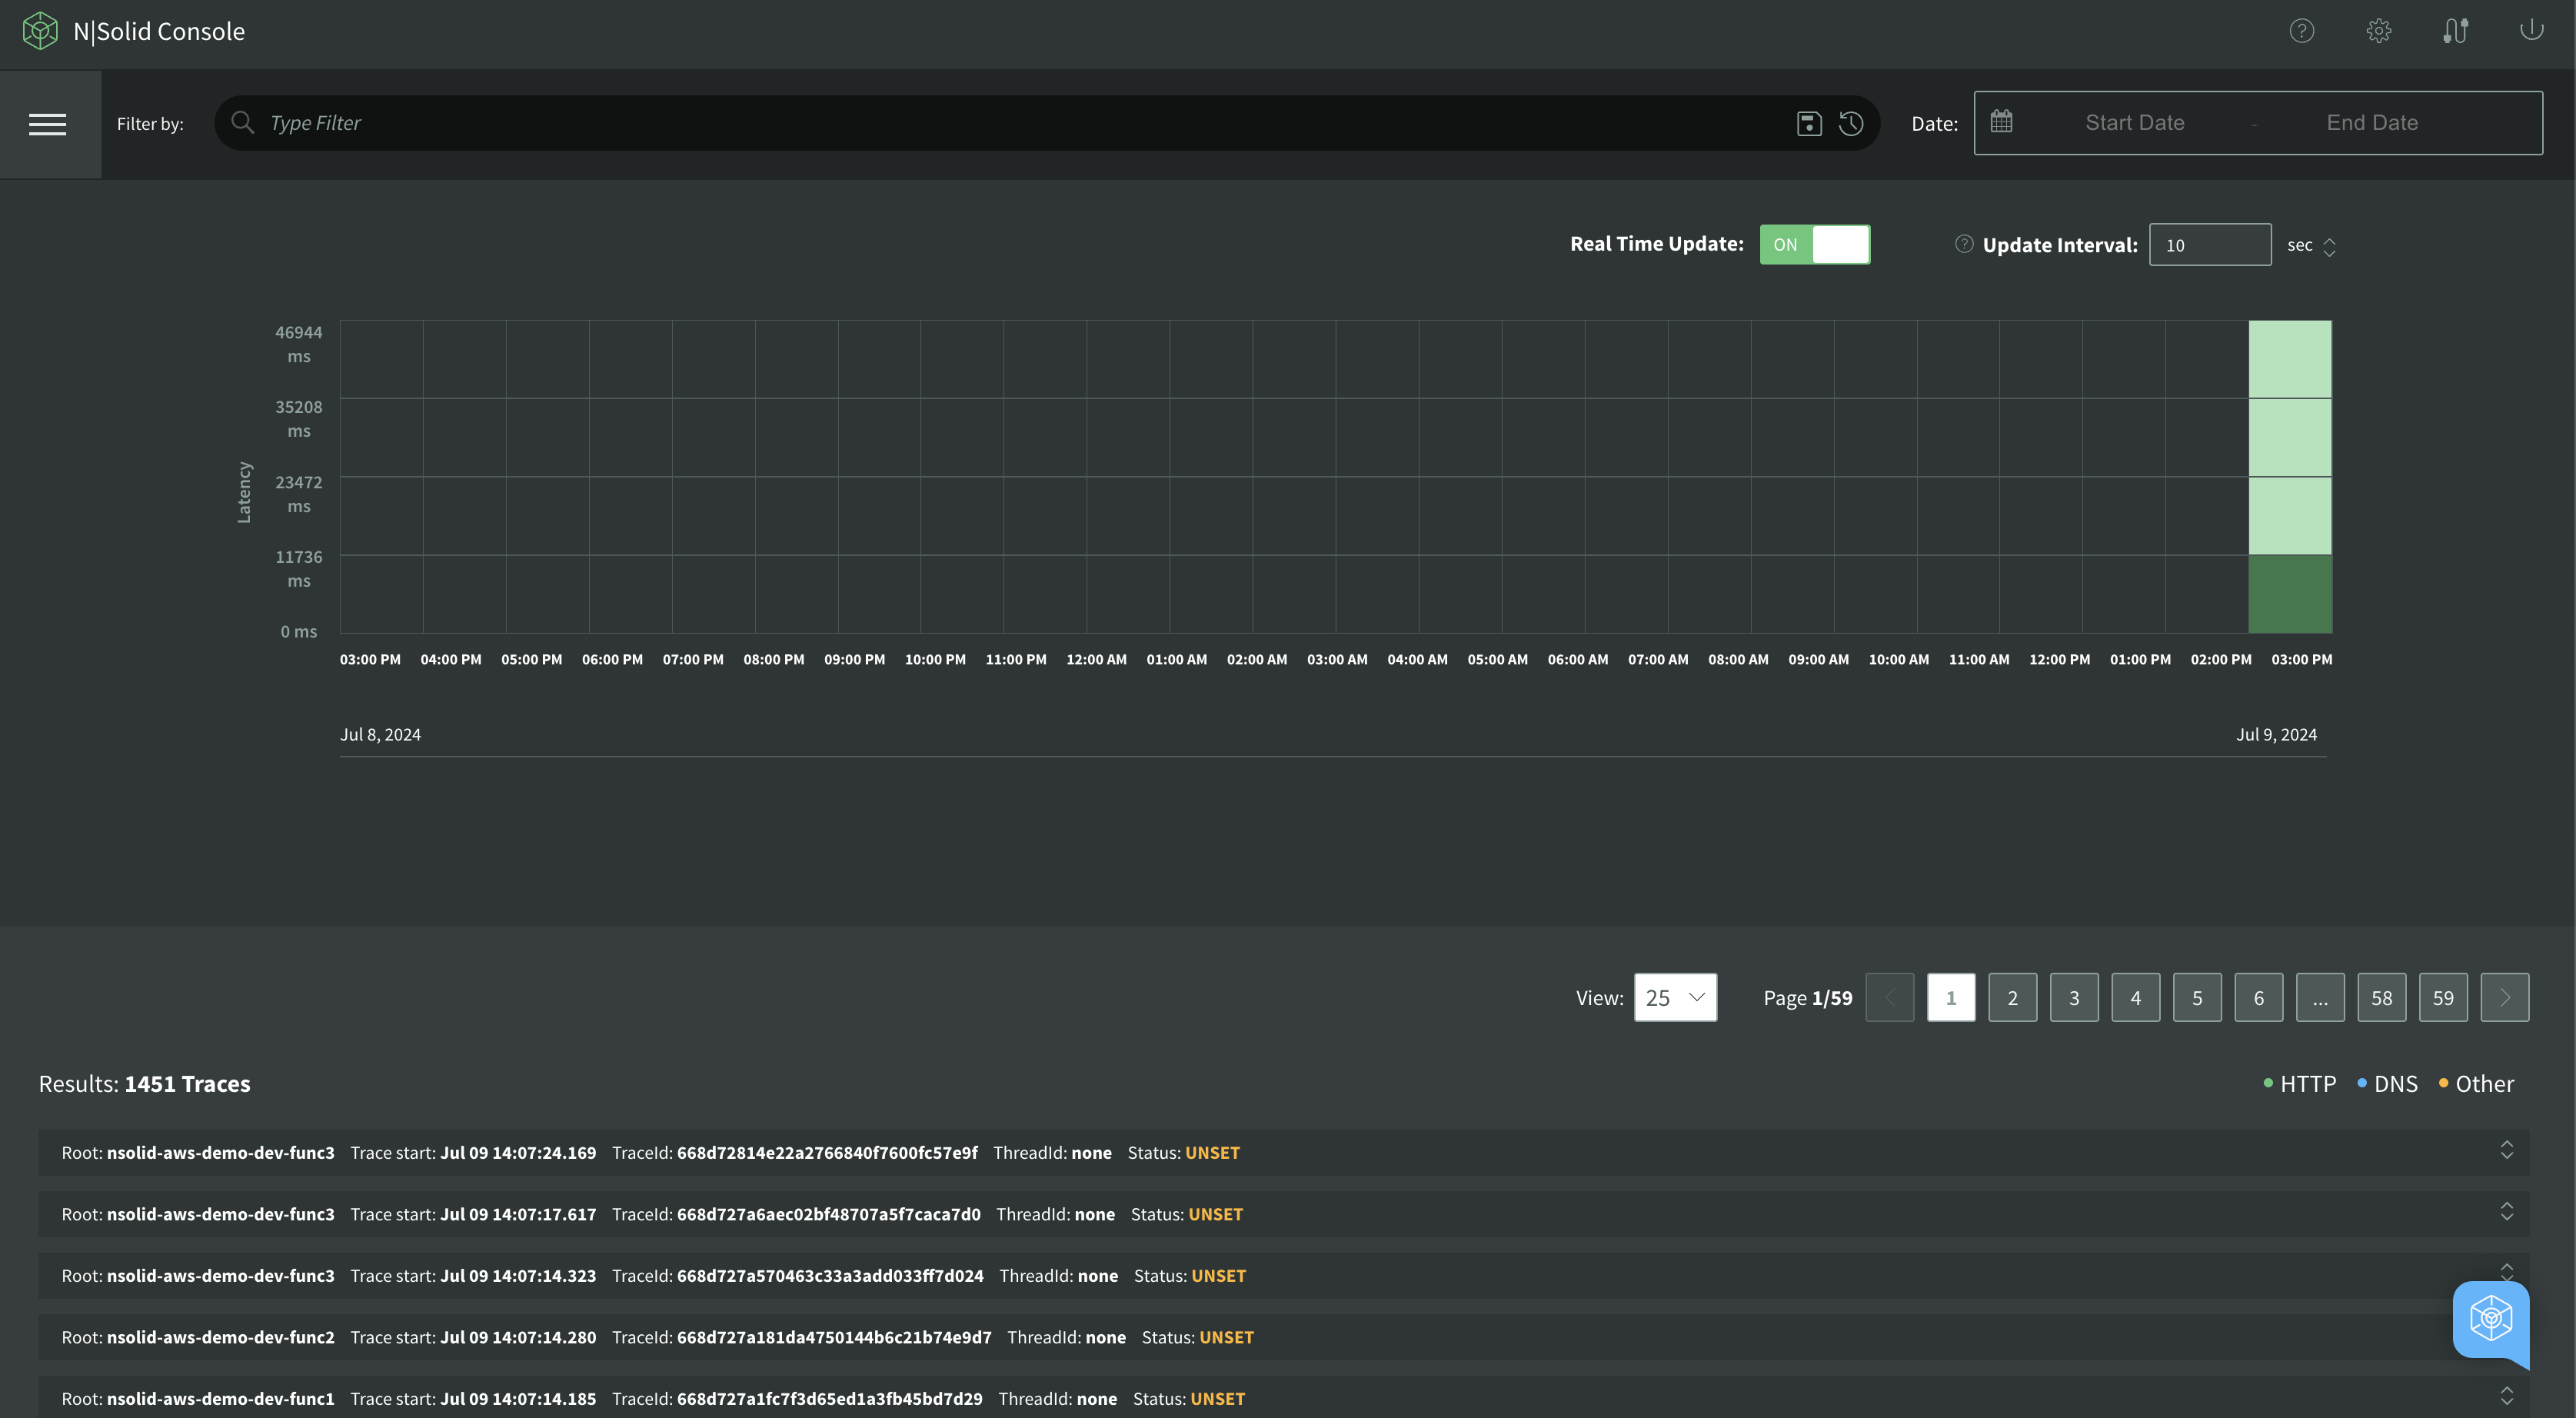
Tracing is consists of three key components below:
images/tracing.png
- Timeline Graph: a timeline graph of Tracing data showing the density of the number of tracing spans.
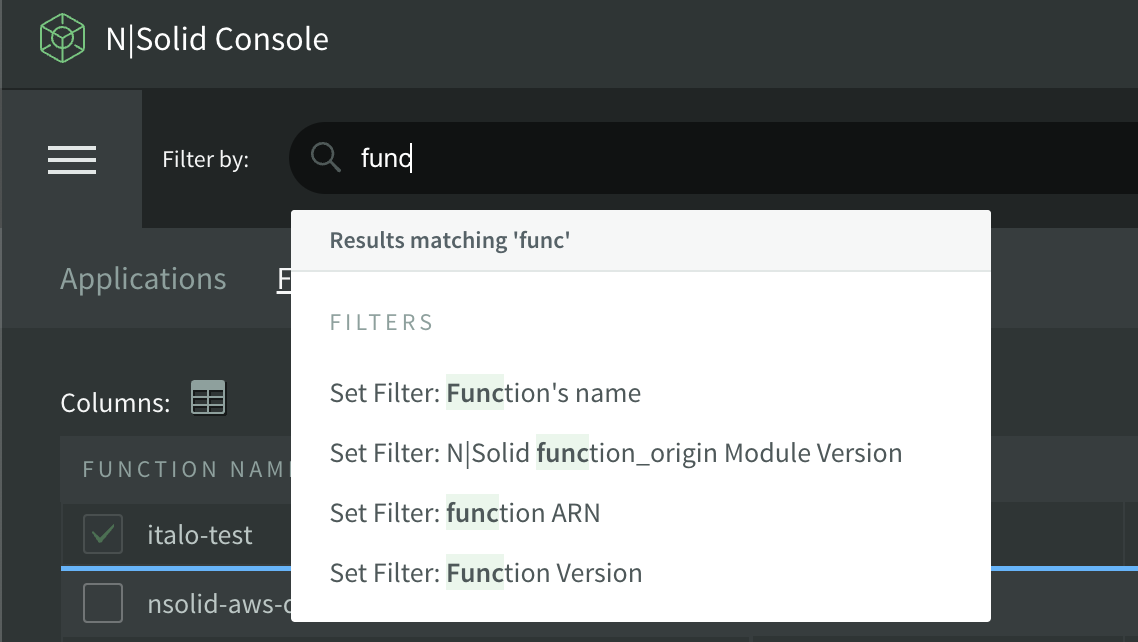
- Filter: a filter input area to filter the results by attributes of the span.
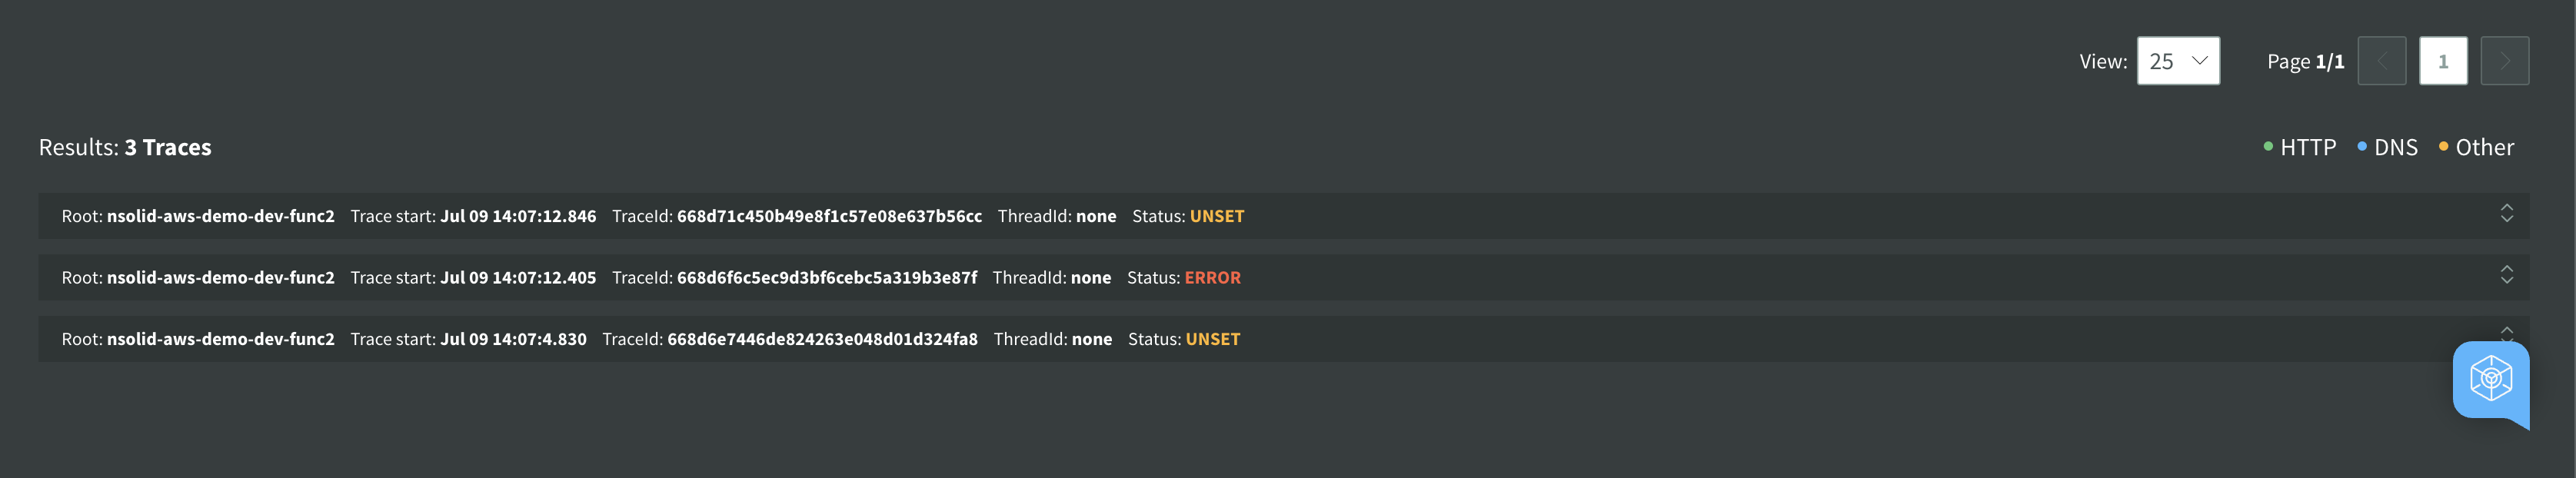
- Spans(Results): a span is the building block of a trace and is a named, timed operation that represents a piece of the workflow in the distributed system. multiple spans are pieced together to create a trace.
Note: The default behavior only generates traces related to the lambda invocation. If you require tracing for additional operations, set the NSOLID_INSTRUMENTATION environment variable.
Available modules for tracing are as follows:
- aws:
AwsInstrumentation - dns:
DnsInstrumentation - graphql:
GraphQLInstrumentation - grpc:
GrpcInstrumentation - http:
HttpInstrumentation - ioredis:
IORedisInstrumentation - mongodb:
MongoDBInstrumentation - mysql:
MySQLInstrumentation - net:
NetInstrumentation - pg:
PgInstrumentation - redis:
RedisInstrumentation
Please ensure you have the necessary modules enabled to trace all the operations you require.
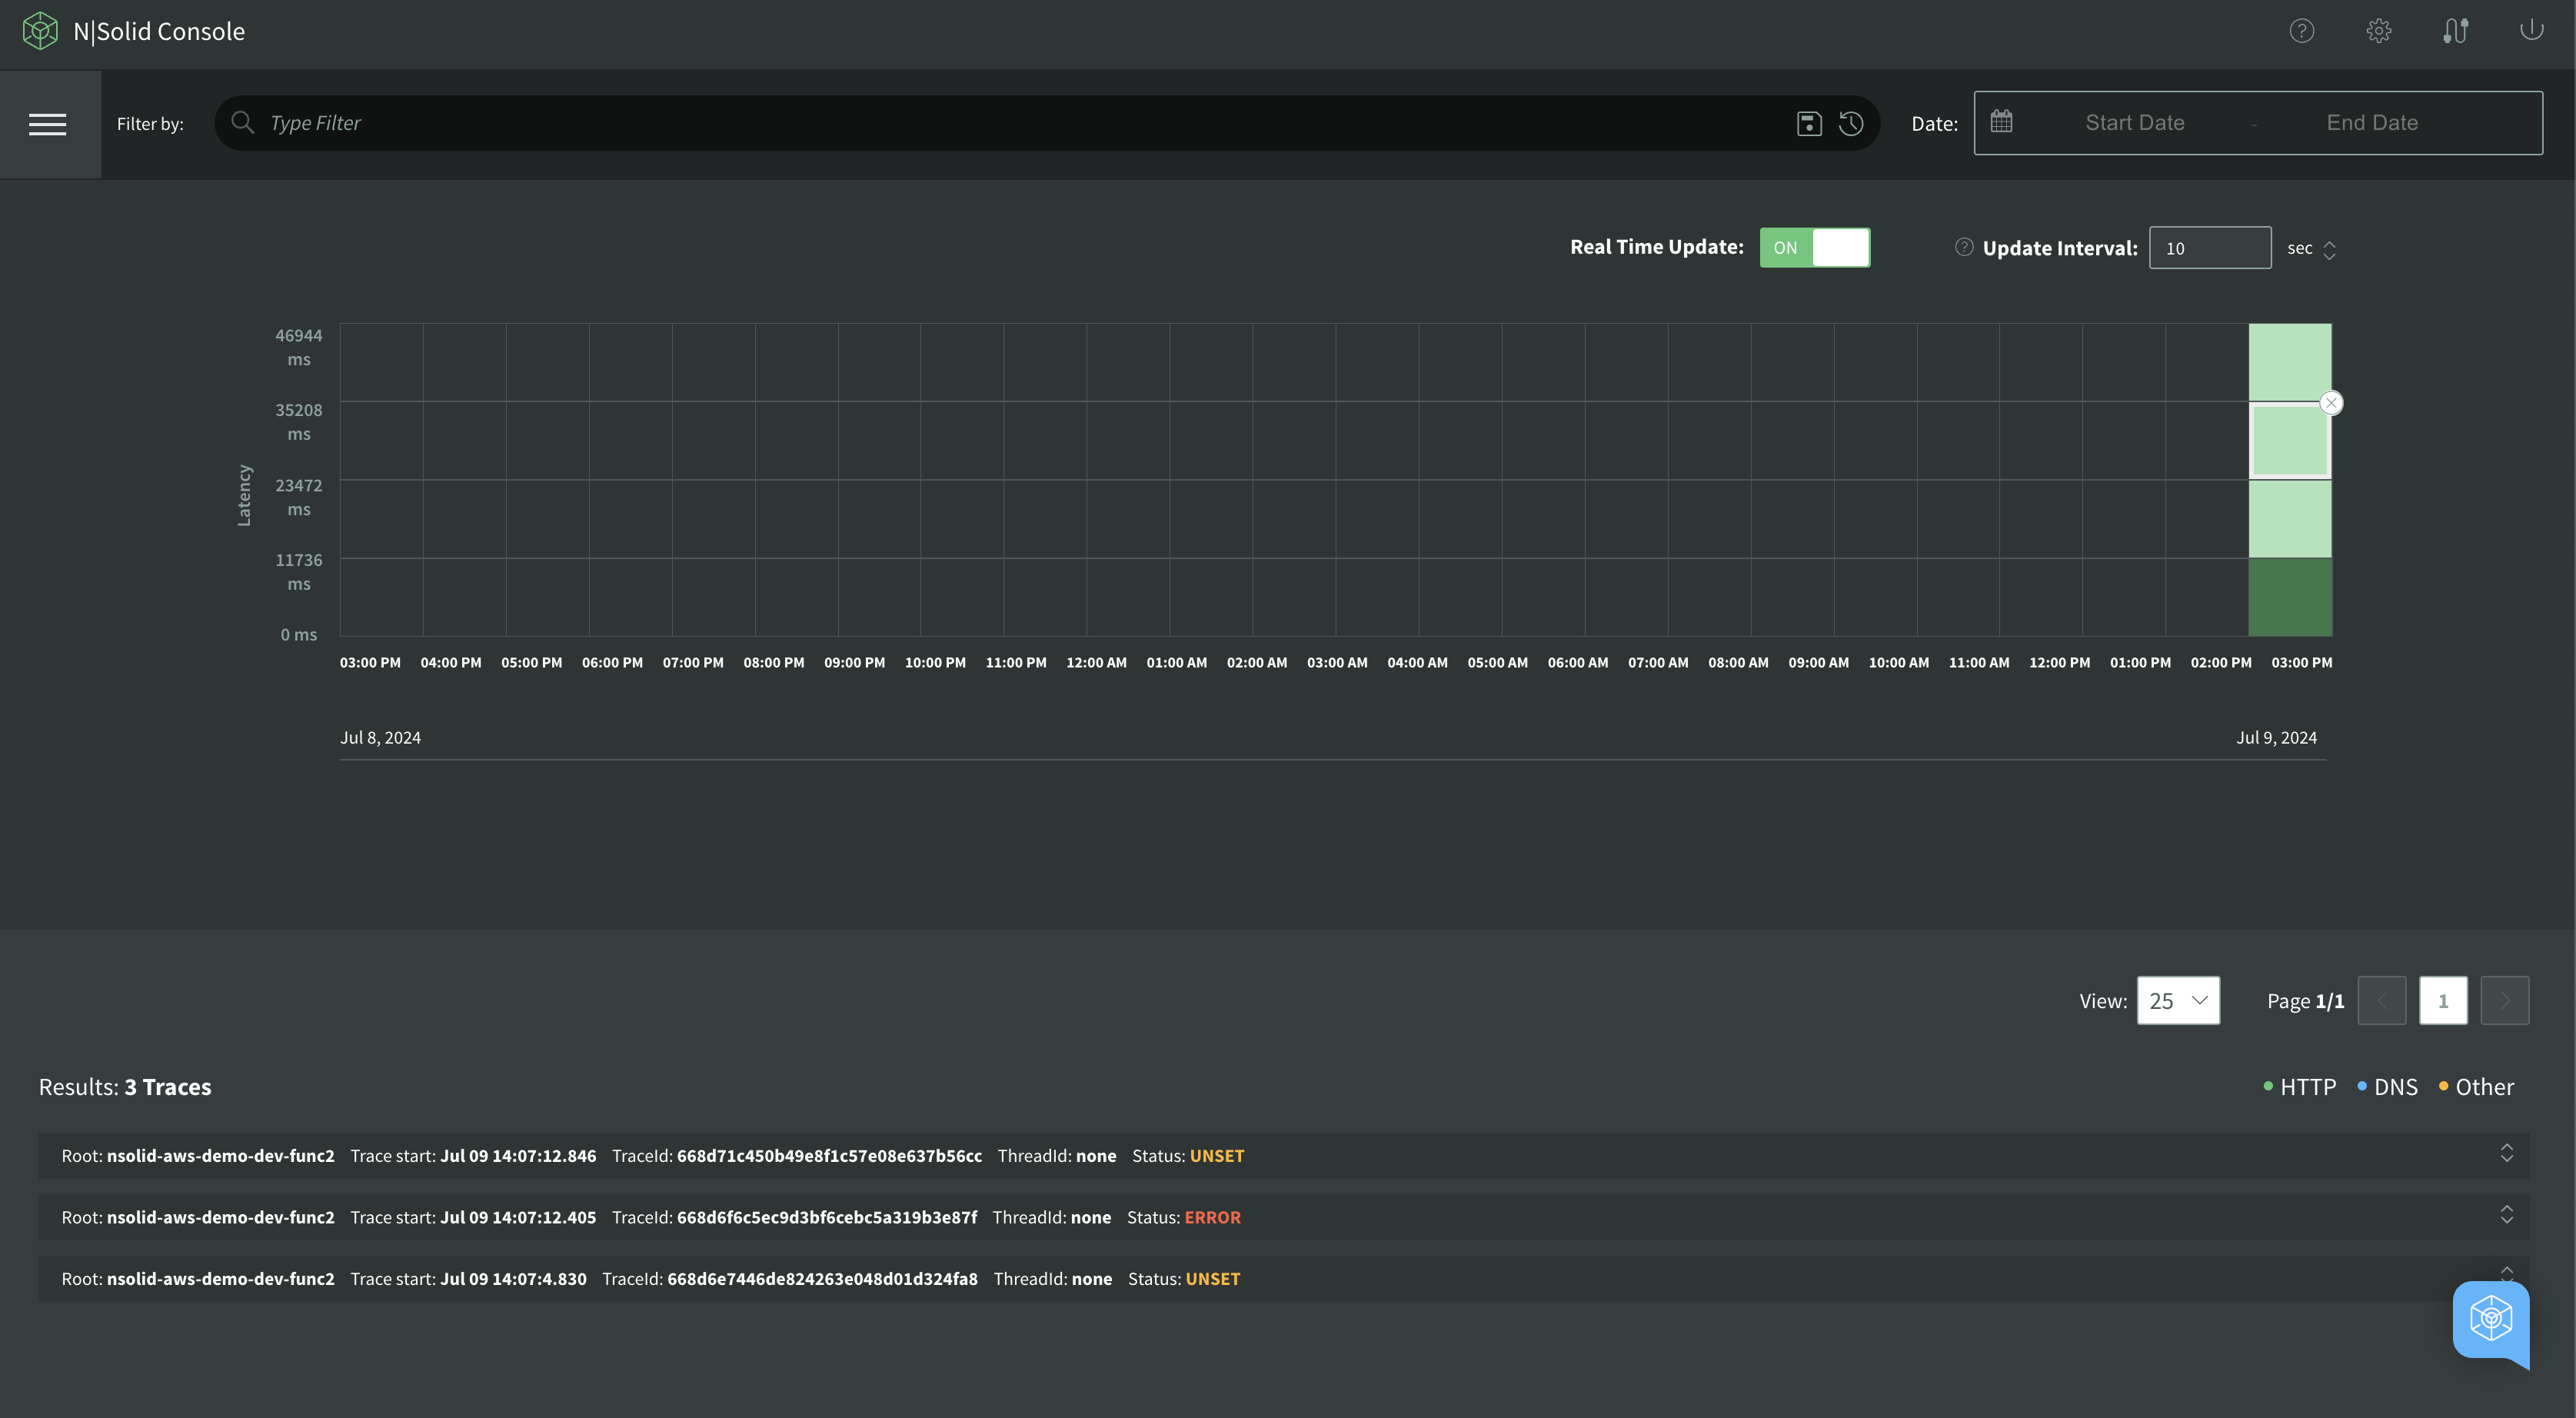
Timeline Graph
A timeline graph displays the density of the number of tracing spans. Below is the description of the color of a slot on the timeline graph:
| Color | Description |
|---|---|
| green | everything is ok |
| yellow | maybe you should look at this |
| red | definitely you should look at this |
Assume that a simple request was made to the “console” service to monitor traces:
As a result, the Console displays the whole “span” information.
Span
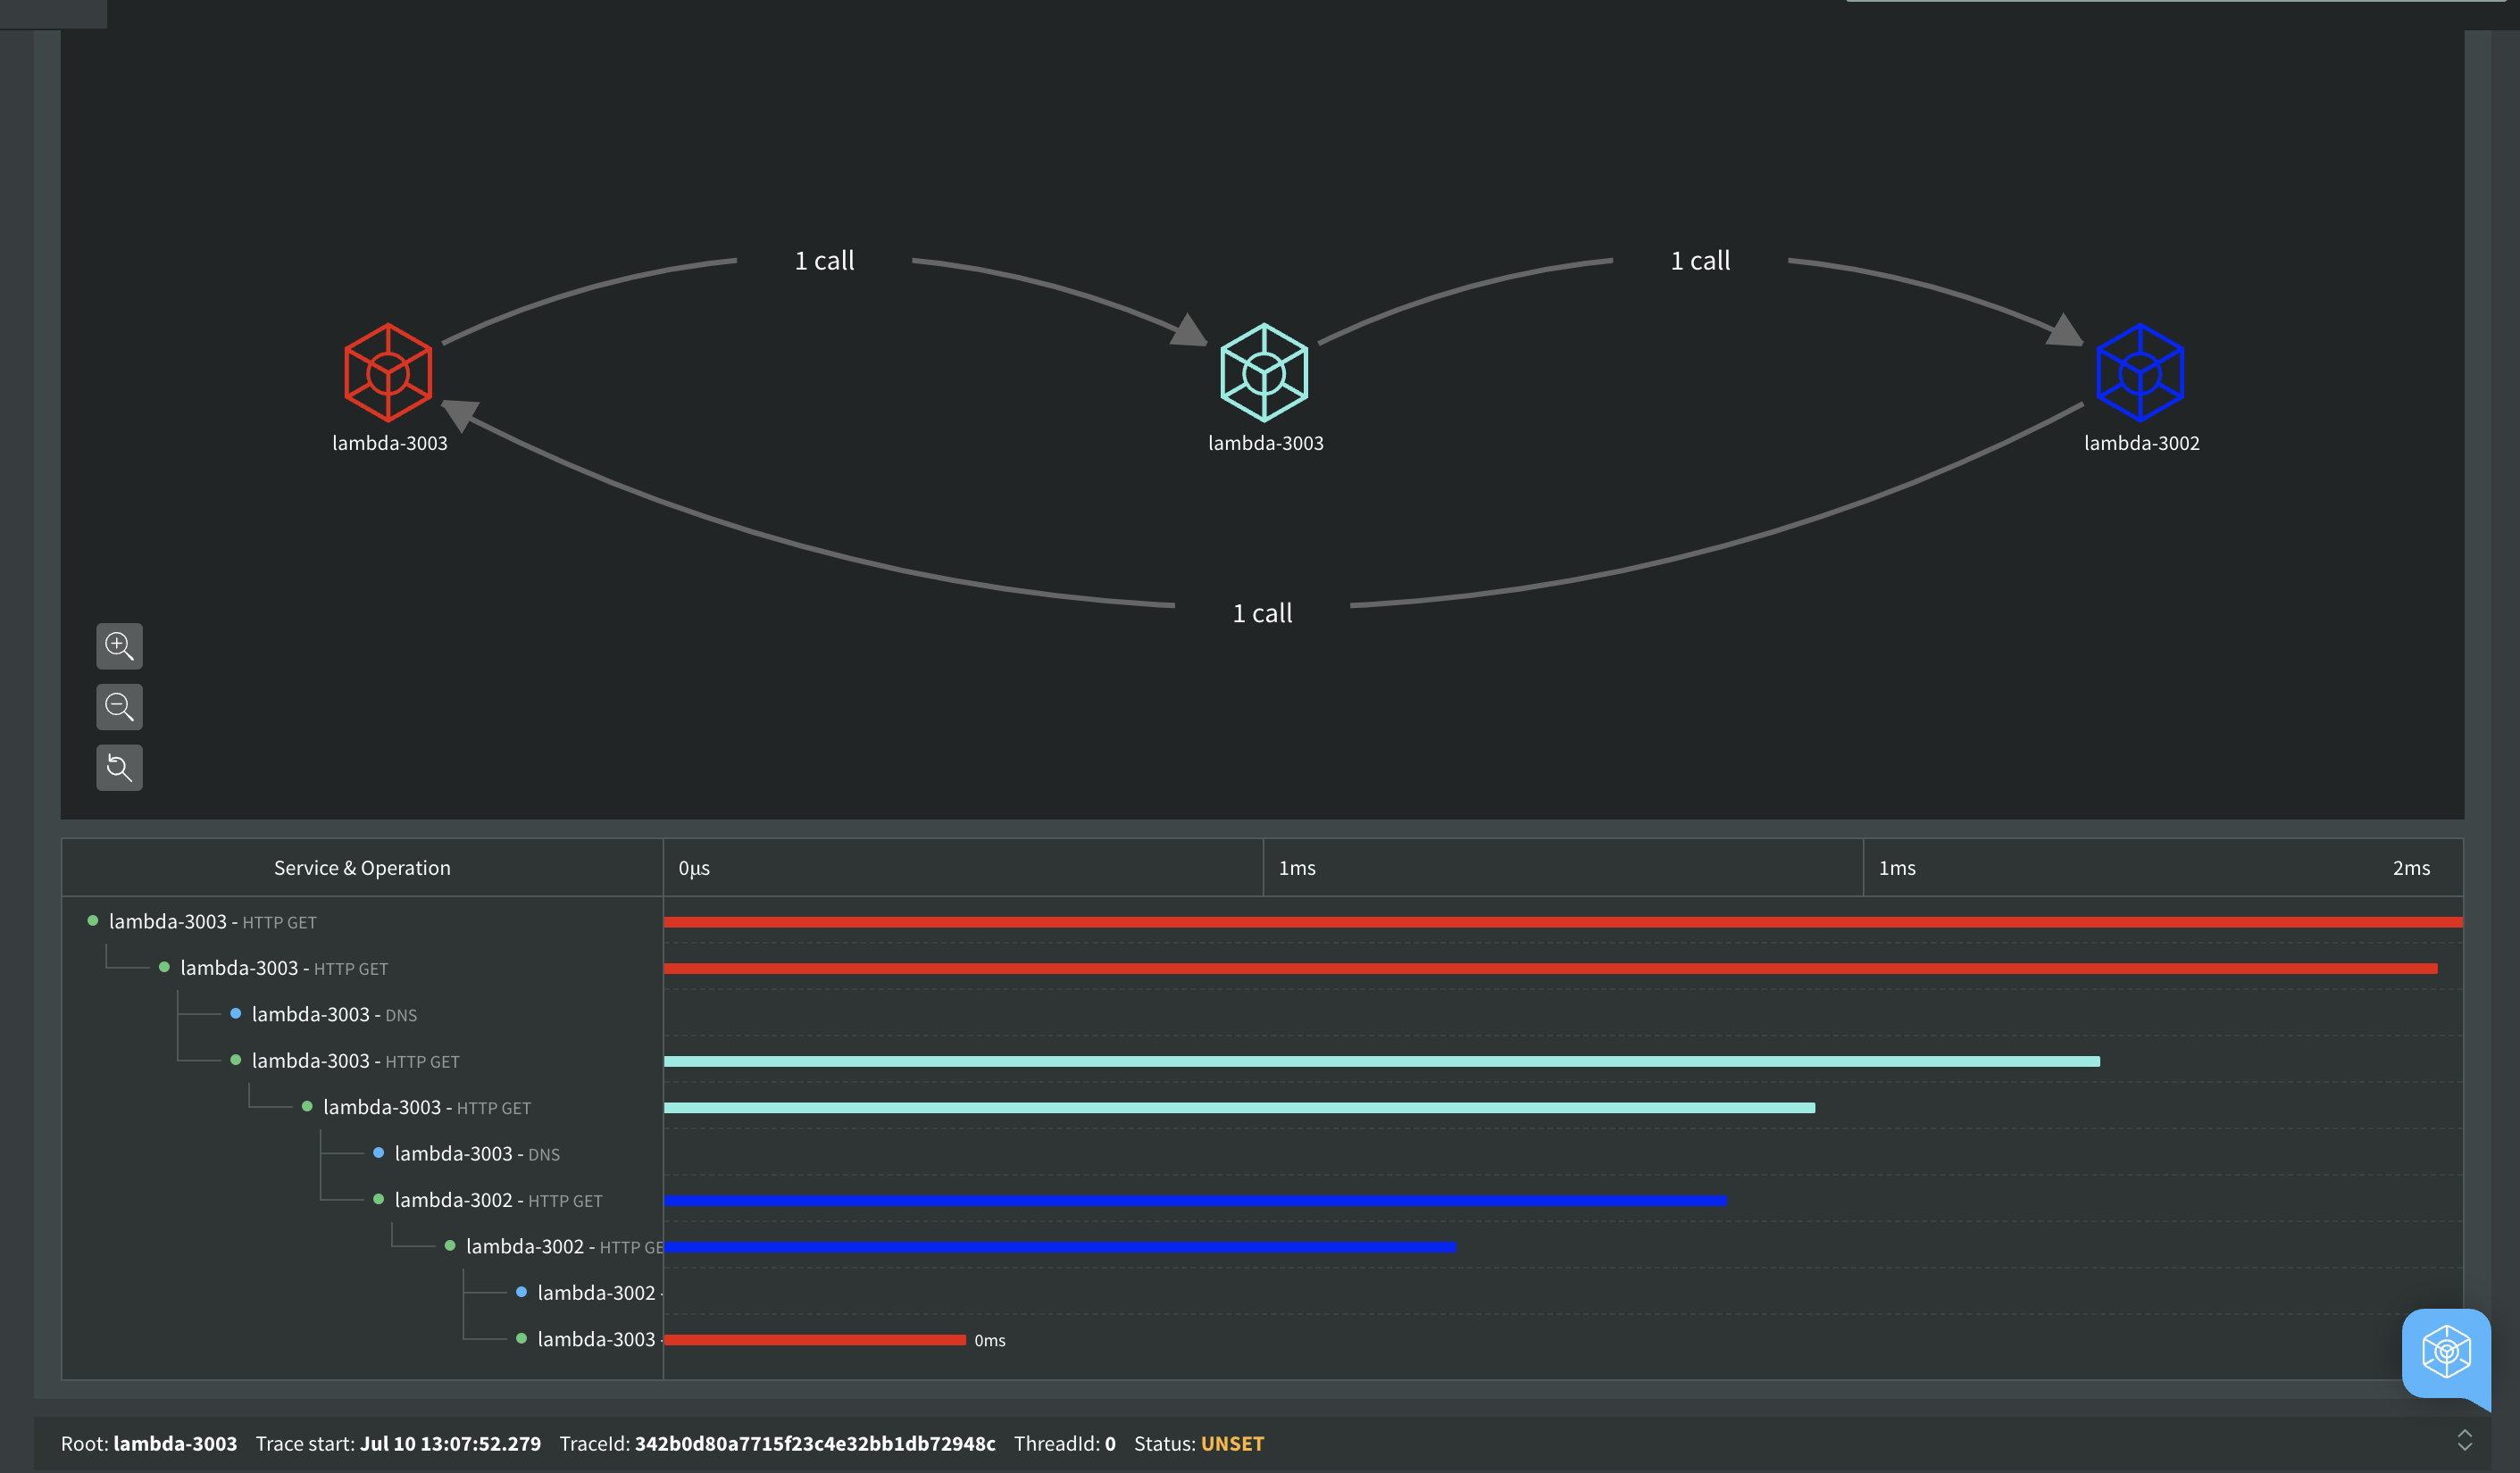
A span is the building block of a trace and is a named, timed operation that represents a piece of the workflow in the distributed system. Multiple spans are pieced together to create a trace.
Traces are often viewed as a tree of spans that reflects the time that each span started and completed. It also shows you the relationship between spans. A trace starts with a root span where the request starts. This root span can have one or more child spans, and each one of those child spans can have child spans.
Inspecting Span Details
To inspect the span details of a span, click on the title Service & Operation:
Below are the attributes of the span:
| Attribute | Description |
|---|---|
| id | the id of the application |
| app | the name of application |
| hostname | the name of the host machine |
| tags | the tags of the application |
| span_attributes_http_method | the http method of span attributes |
| duration | the duration of the span |
| span_attributes_http_status_code | the http status code of the span attributes |
| span_attributes_http_status_text | the http status text of the span attributes |
| span_attributes_http_url | the http url of the span attributes |
| span_end | the end time of the span |
| span_id | the id of the span |
| span_name | the name of the span |
| span_parentId | the parent ID of the span |
| span_start | the start time of the span |
| span_status_code | the status code of the span |
| span_threadId | the thread ID of the span |
| span_traceId | the trace ID of the span |
| span_type | the type of the span |
| resourceSpans | an array of resource spans |
| attributes | an array of attributes |
| key | the key of the attribute |
| value | the value of the attribute |
| stringValue | the string value of the attribute |
| telemetry.sdk.language | the language of the telemetry SDK |
| telemetry.sdk.name | the name of the telemetry SDK |
| telemetry.sdk.version | the version of the telemetry SDK |
| cloud.provider | the cloud provider |
| cloud.platform | the cloud platform |
| cloud.region | the cloud region |
| faas.name | the name of the function as a service |
| faas.version | the version of the function as a service |
| process.pid | the process ID |
| process.executable.name | the name of the executable |
| process.command | the command |
| process.command_line | the command line |
| process.runtime.version | the version of the runtime |
| process.runtime.name | the name of the runtime |
| process.runtime.description | the description of the runtime |
| droppedAttributesCount | the number of dropped attributes |
| MessageAttributes | the message attributes |
| eventType | the event type |
| StringValue | the string value |
| DataType | the data type |
| instanceId | the instance ID |
| functionArn | the Amazon Resource Name (ARN) of the function |
SBOM
The SBOM button will display the SBOM(Software Bill of Materials) of the function in JSON or PDF. The SBOM will display the following information:
- Name: The name of the package.
- Version: The version of the package.
- Risk: The level of risk associated with using this package.
- License: The license under which the package is distributed.
- Author: The author of the package.
- Number of CVEs / CWEs: The number of known Common Vulnerabilities and Exposures (CVEs) or Common Weakness Enumerations (CWEs) associated with the package.
- Path: The path to the package within the application.
Changing Time Range
To change the time range, click the calendar icon above the graphs:
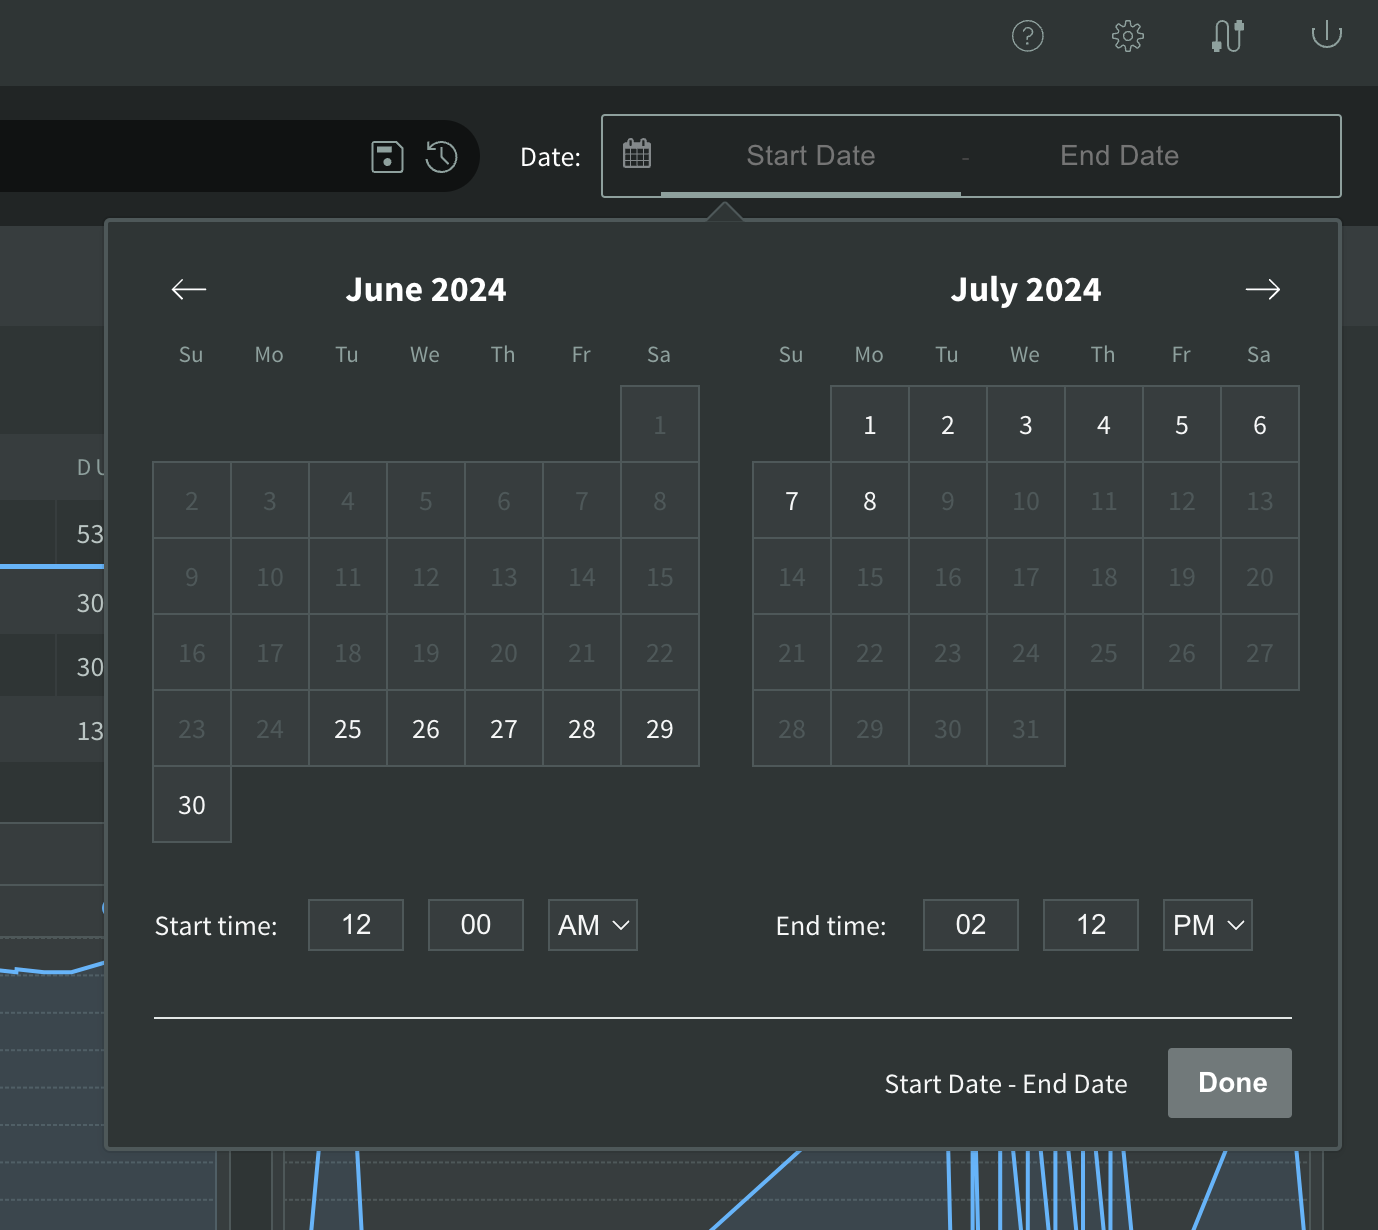
This will show a calendar from which users can select the time range. The timeline graph range is updated every 1 minute, with an option to change the date range every 1 minute. In summary, with NodeSource's Serverless monitoring, users can gain more insight into the performance of their serverless functions and quickly identify and debug any issues.
Uninstall
To unistall the resources created by the nsolid-serverless like sqs, lambda layer and lambda envs,use the command below:
> nsolid-serverless infra --uninstall
