Assets
Assets are diagnostic assets captured by the N|Solid agent for your processes.
Assets can be downloaded to your file for further examination manually or via external tooling.
The Asset types N|Solid can currently generate are:
- CPU Profiles (.cpuprofile)
- Heap Snapshots (.heapsnapshot)
- Heap Profiles (.heapsnapshot)
- Heap Samples (.heapprofile)
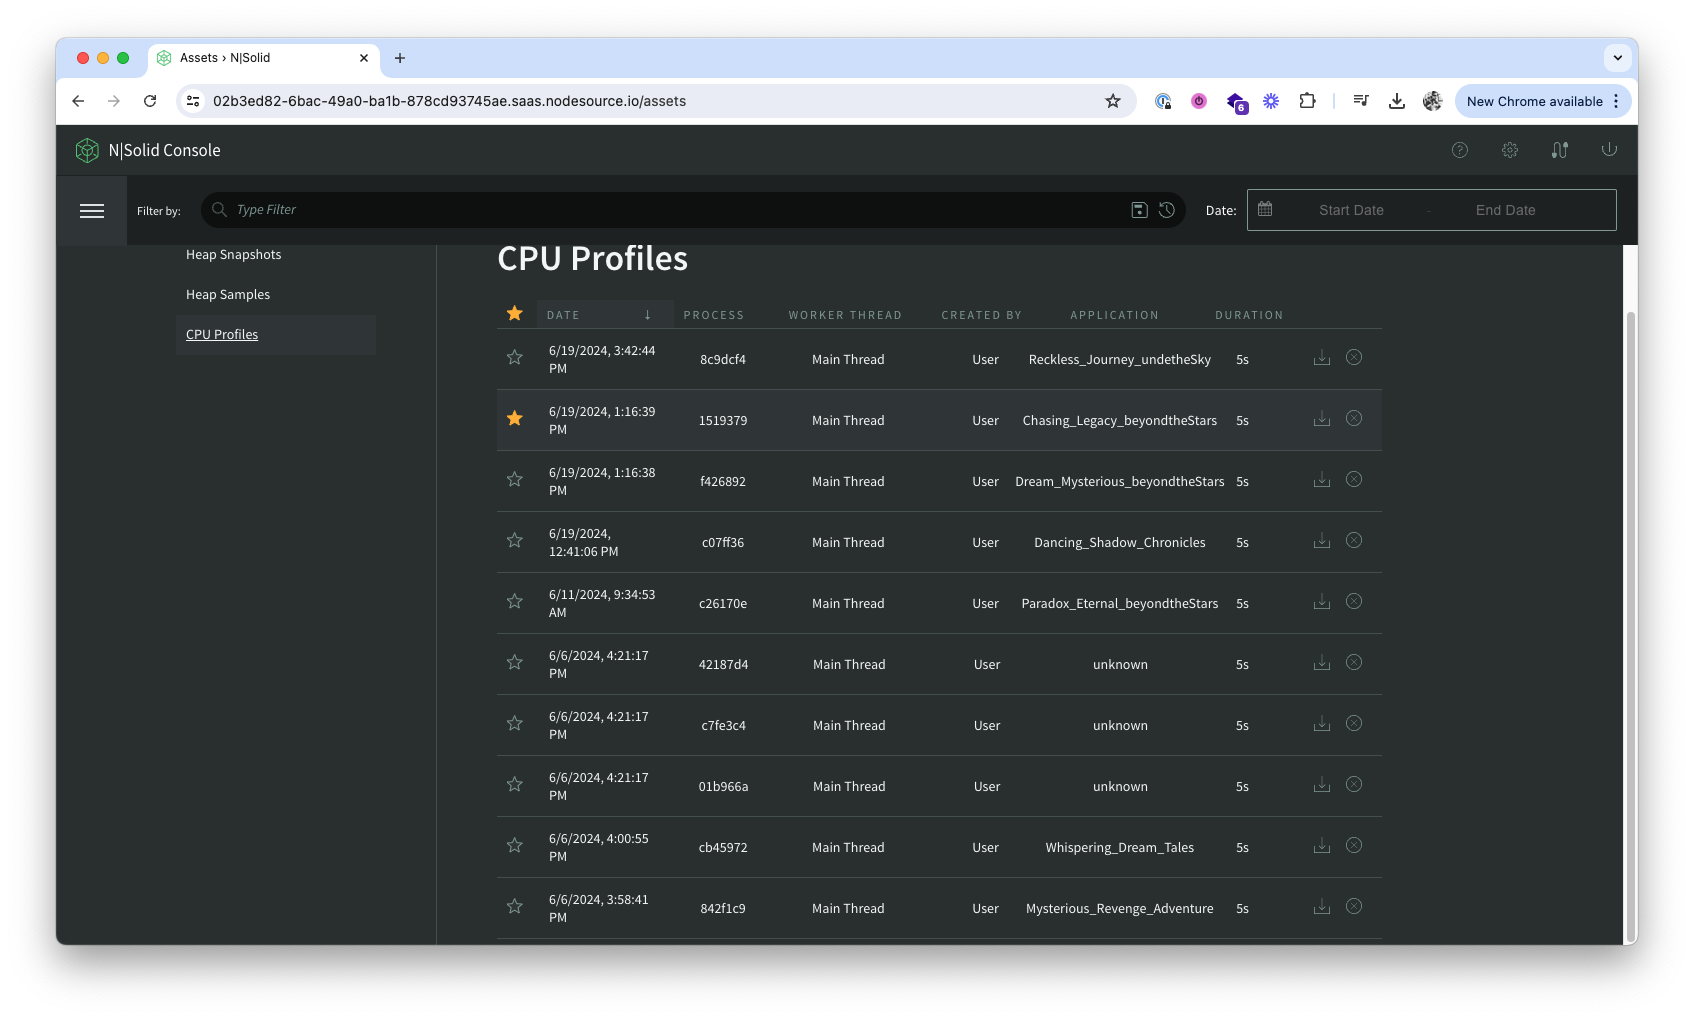
Assets page
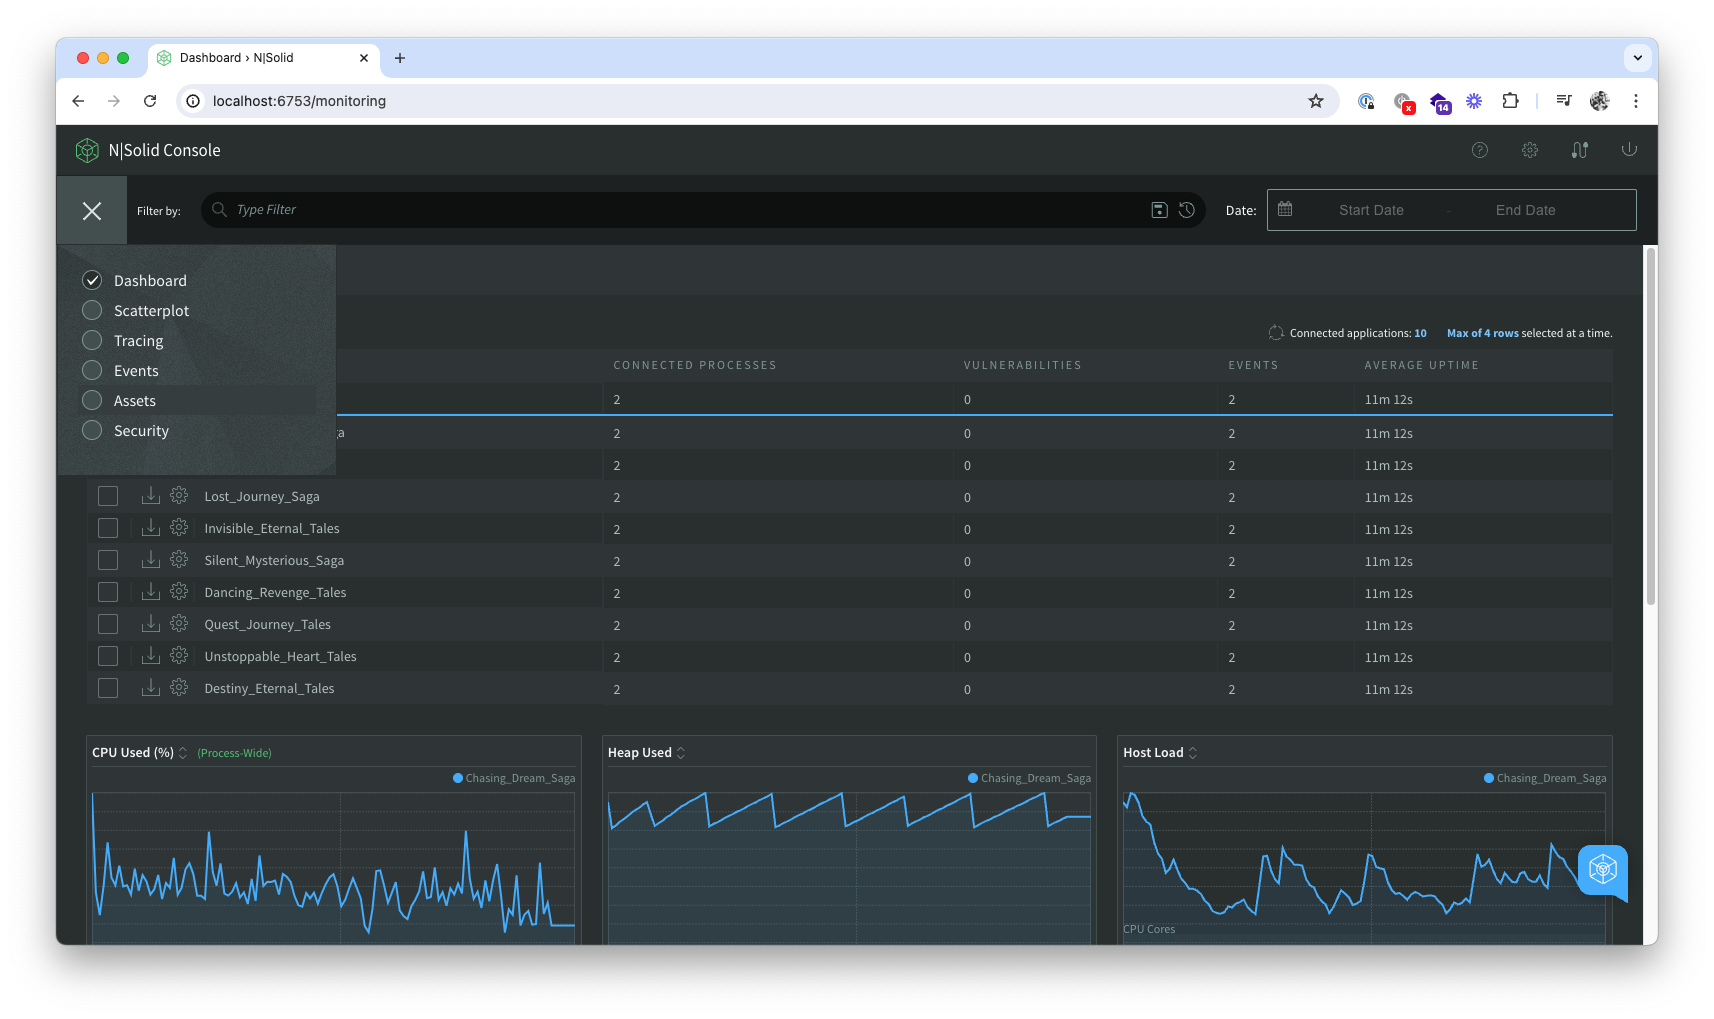
The N|Solid console provides a dedicated view to asset management.
It could be accesed as simple as click in the top left "hamburguer" icon and click on "Assets"
Check out the Global Filters page for more details about filtering.
Operations like downloading, and using Chrome's devtools with them is covered down bellow.
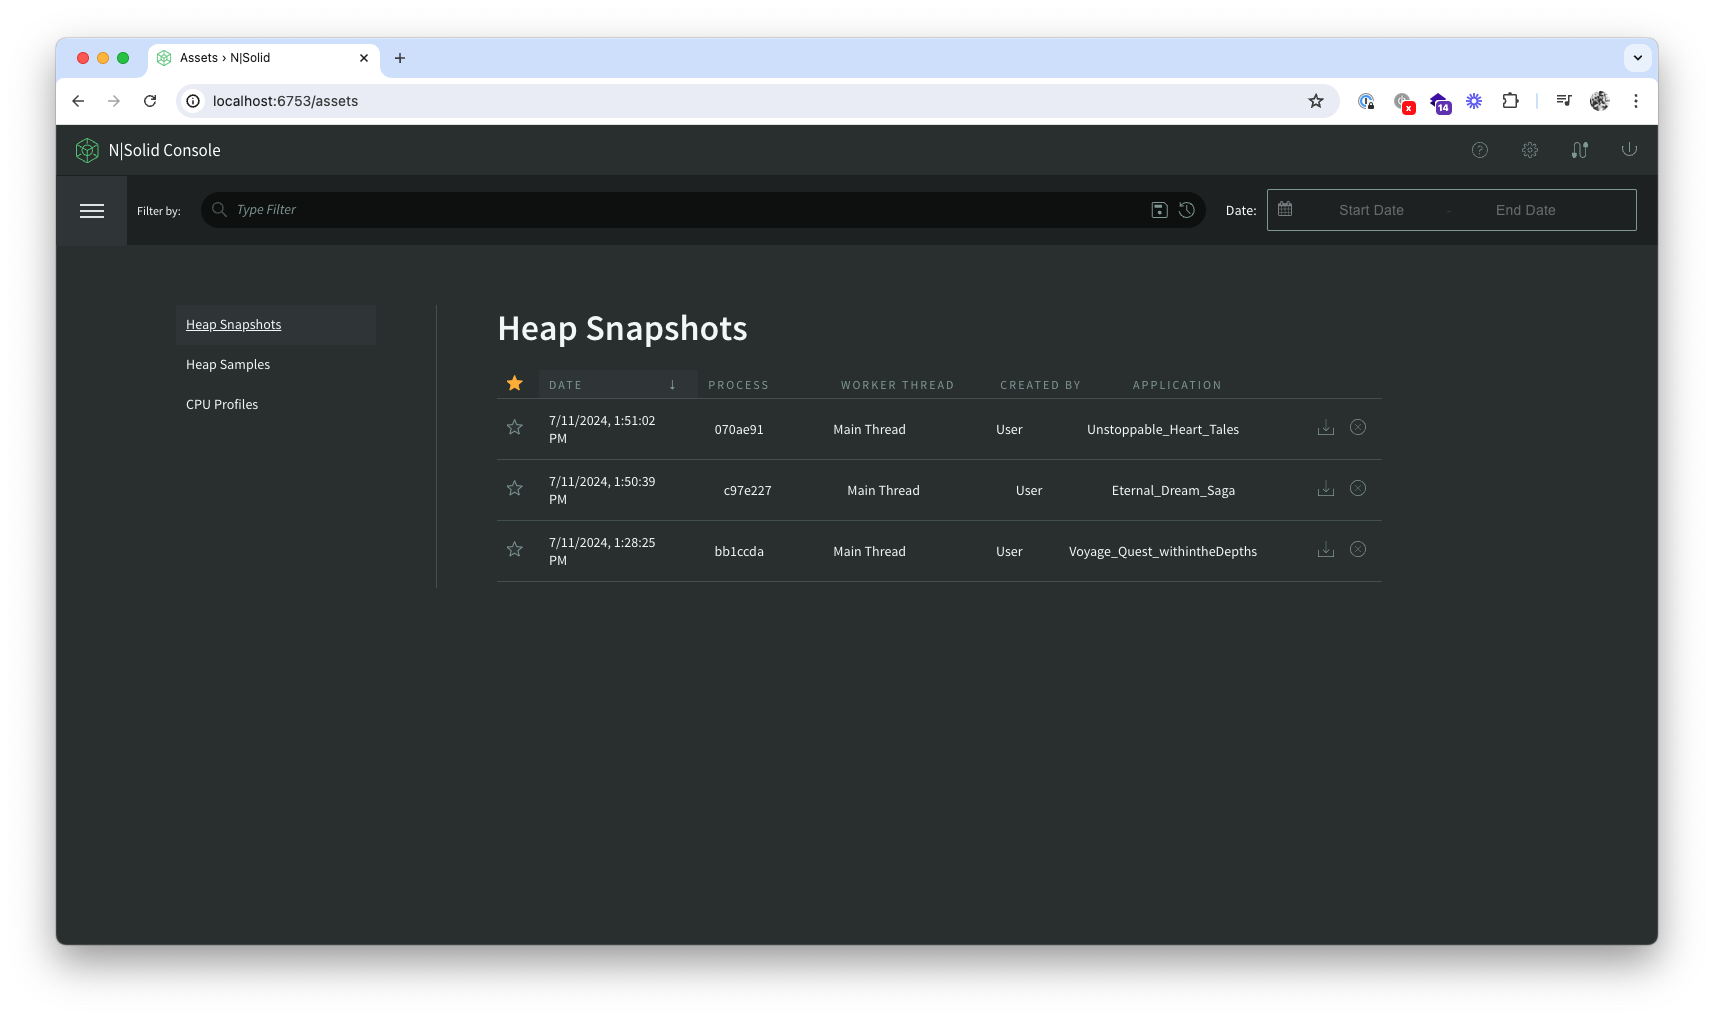
N|Solid console asset management.
In the N|Solid console's dedicated asset view will internally manage all the assets, they could be generated manually, via custom view, JS API, all will finish in that view.
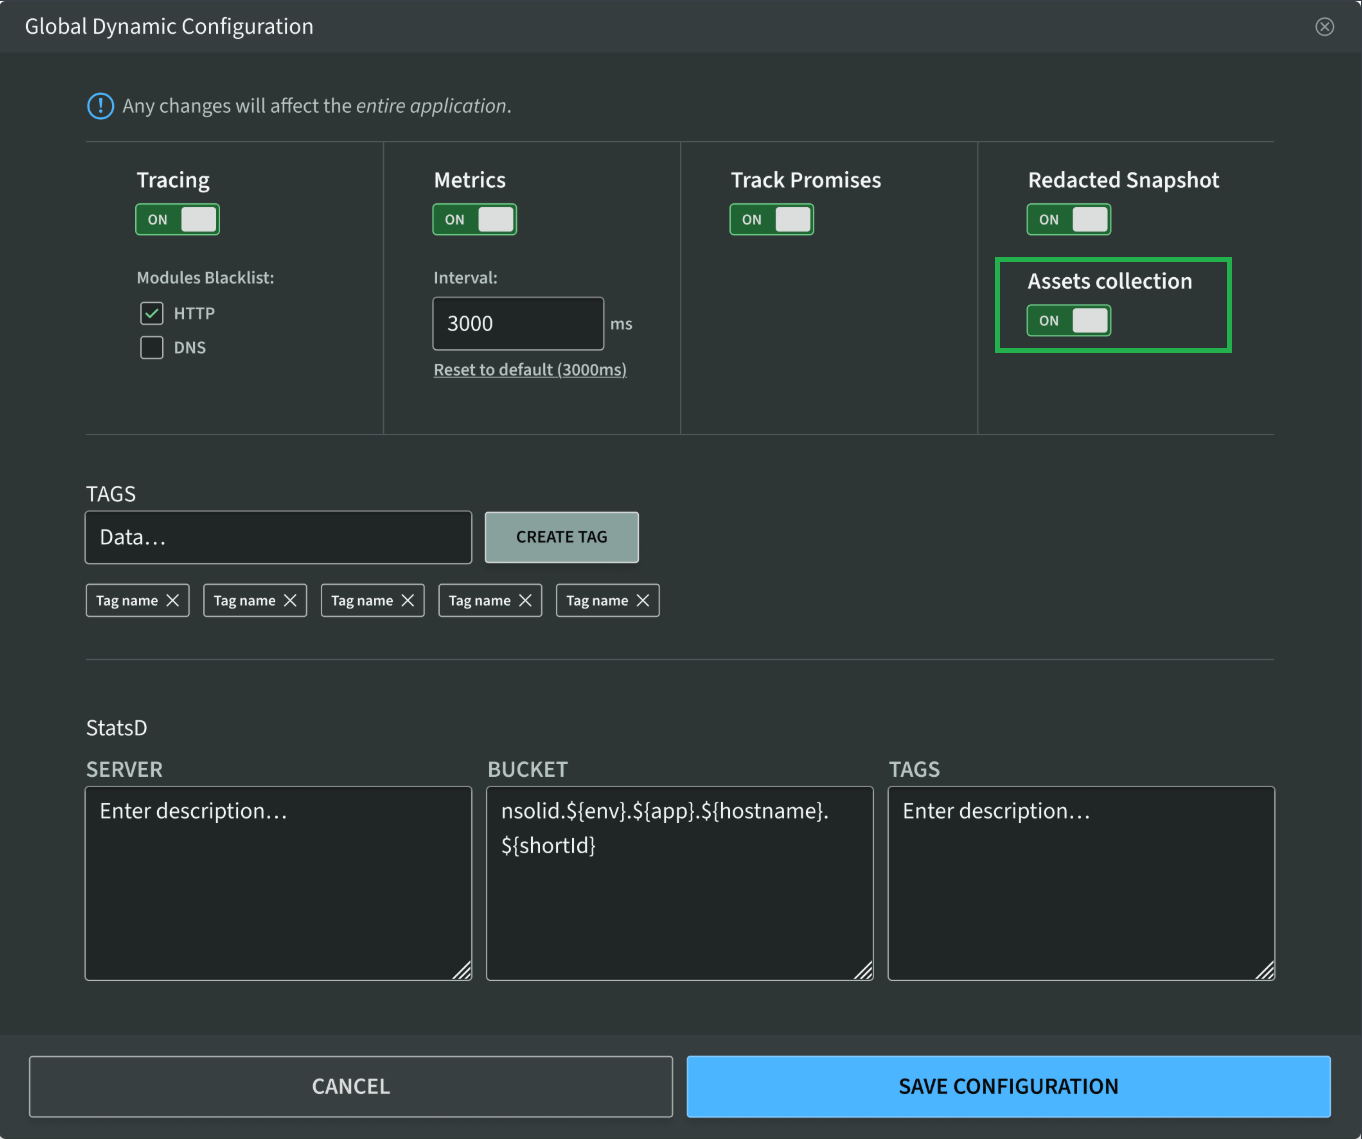
Pausing Asset Collection.
Asset collection for any application or group of processes can be disabled/enabled using the process configuration modal from the N|Solid Dashboard by clicking the "Assets Collection" button. This feature is only available for N|Solid Runtime Version 6.1.0 and later.
Deleting assets.
Any asset can be deleted as simple as clicking in the "X" icon in the asset you want to delete.
Starring assets.
If you would like to prevent an asset from being deleted when old asset files are automatically purged, you can mark it as special by starring it.
Downloading assets.
One of the key features of the N|Solid console, besides automating profiling critical services, is the posibility of exporting each asset depending on your needs and, upload them in the Chrome Devtools.
Uploading Heap Snapshots, Heap Profiles and Heap Samples in Chrome DevTools
In the asset list, click on the "download" icon. That will download the asset.
Note: the assets covered here are listed in Heap Snapshot and Heap Samples tabs.
This section is focused on heap-releated assets.
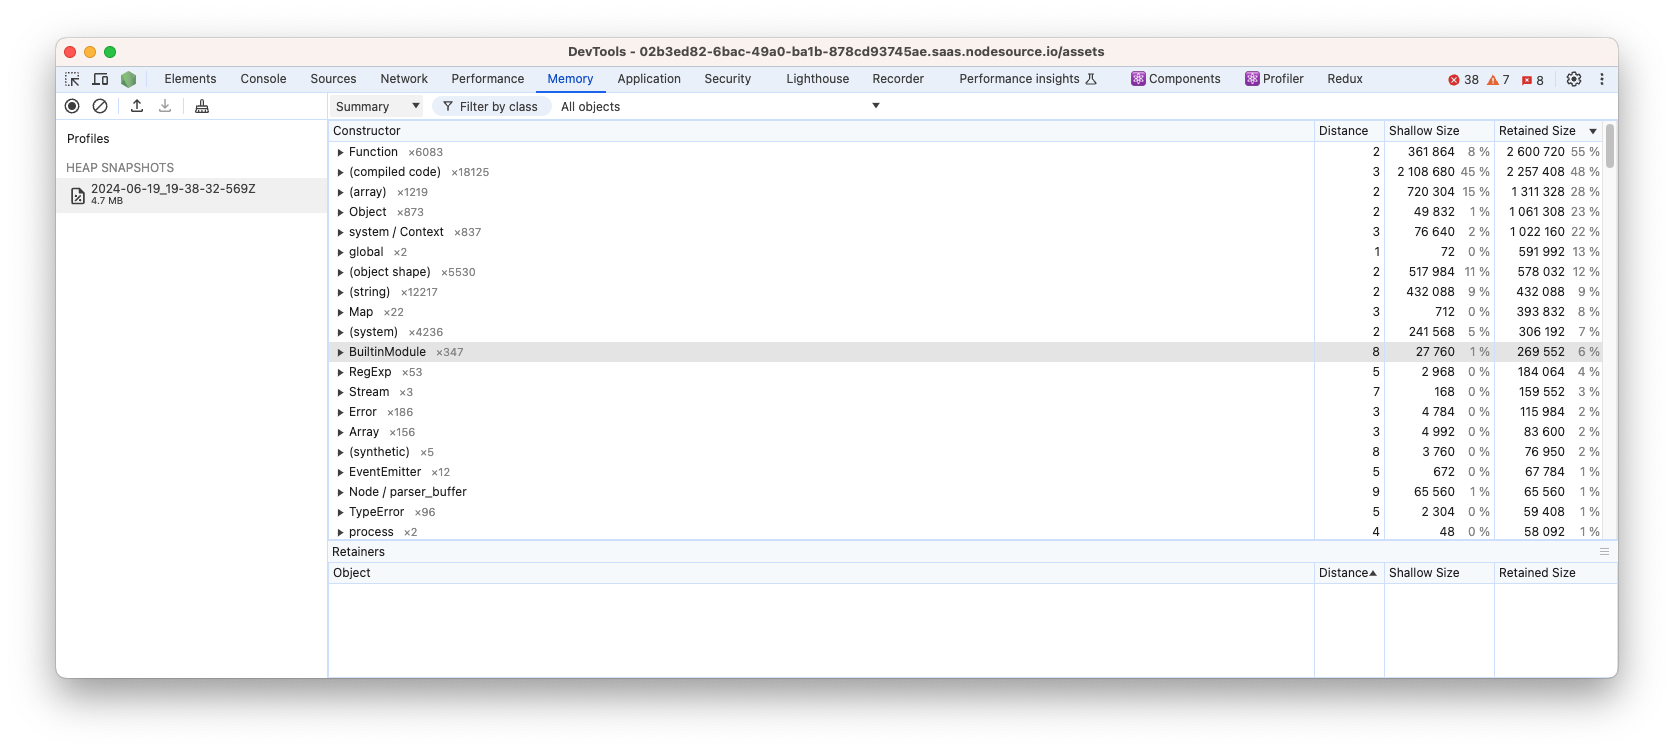
Open the Chrome Devtools window and click on the "Memory" pane. In the top left, there is an "Upload icon". Load the downloaded asset.
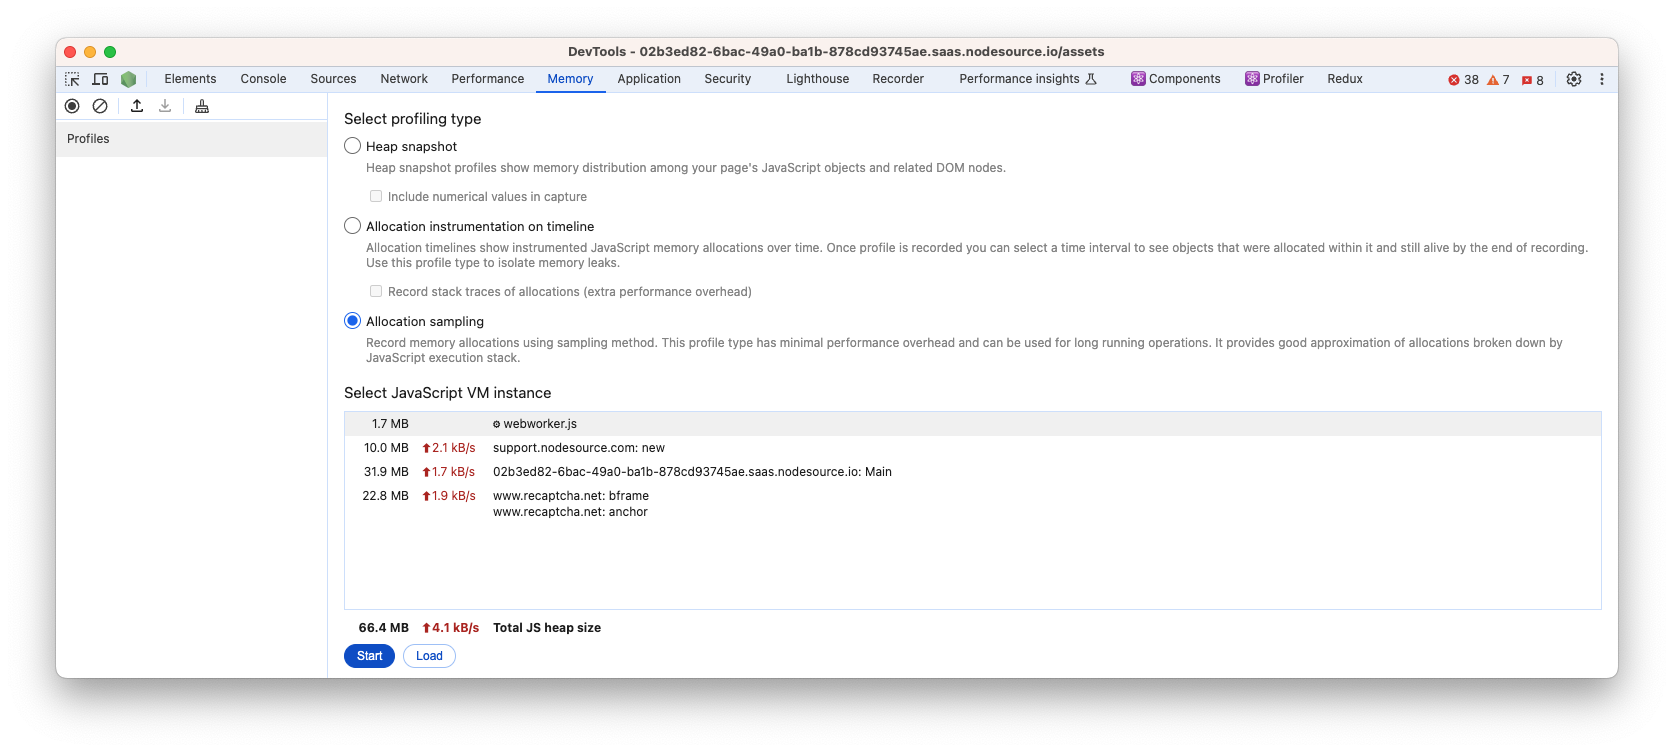
All the heap snapshots and heap profiles has the same visualization in Chrome devtools.
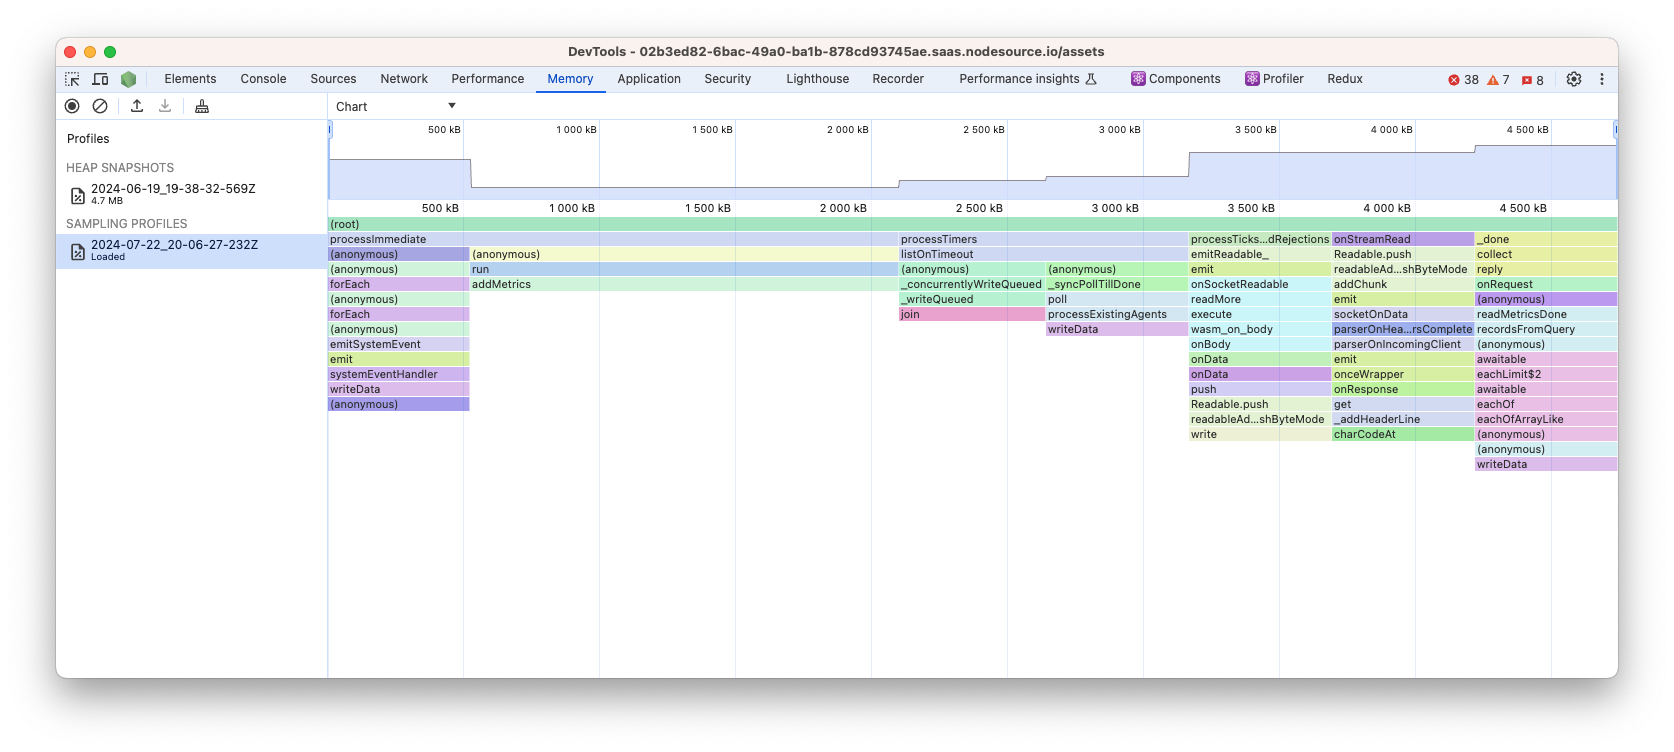
The heap samples are a bit special, it could be considered as a flamegraph that measures the allocation activity in your heap.
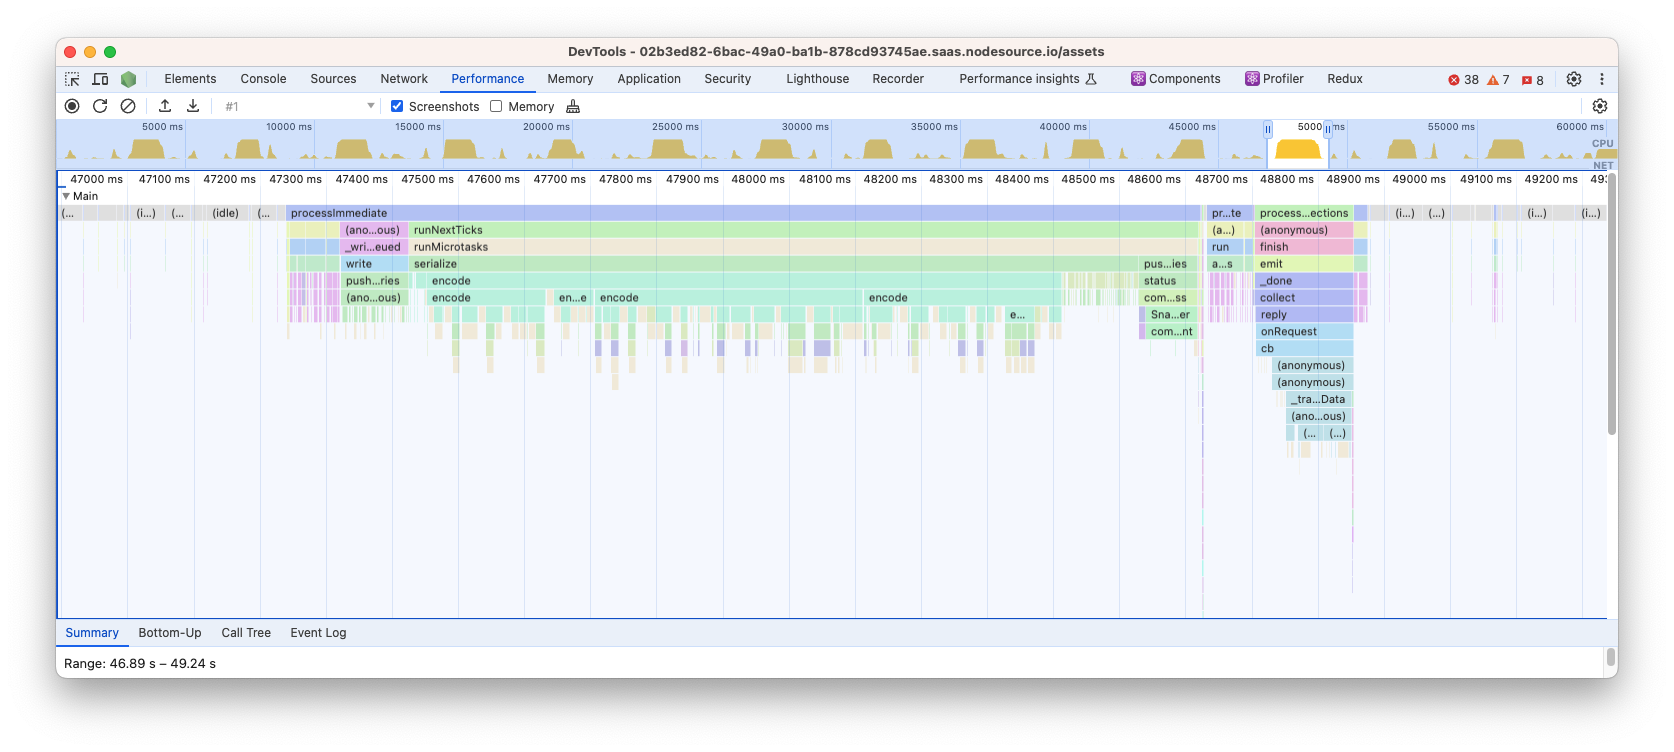
Uploading CPU Profiles in Chrome DevTools
In the asset list, click on the "download" icon. That will download the asset.
Note: the assets covered here are listed in CPU profiles tab.
Open the Chrome Devtools window and click on the "Performance" pane. In the top left, there is an "Upload icon". Load the downloaded asset.
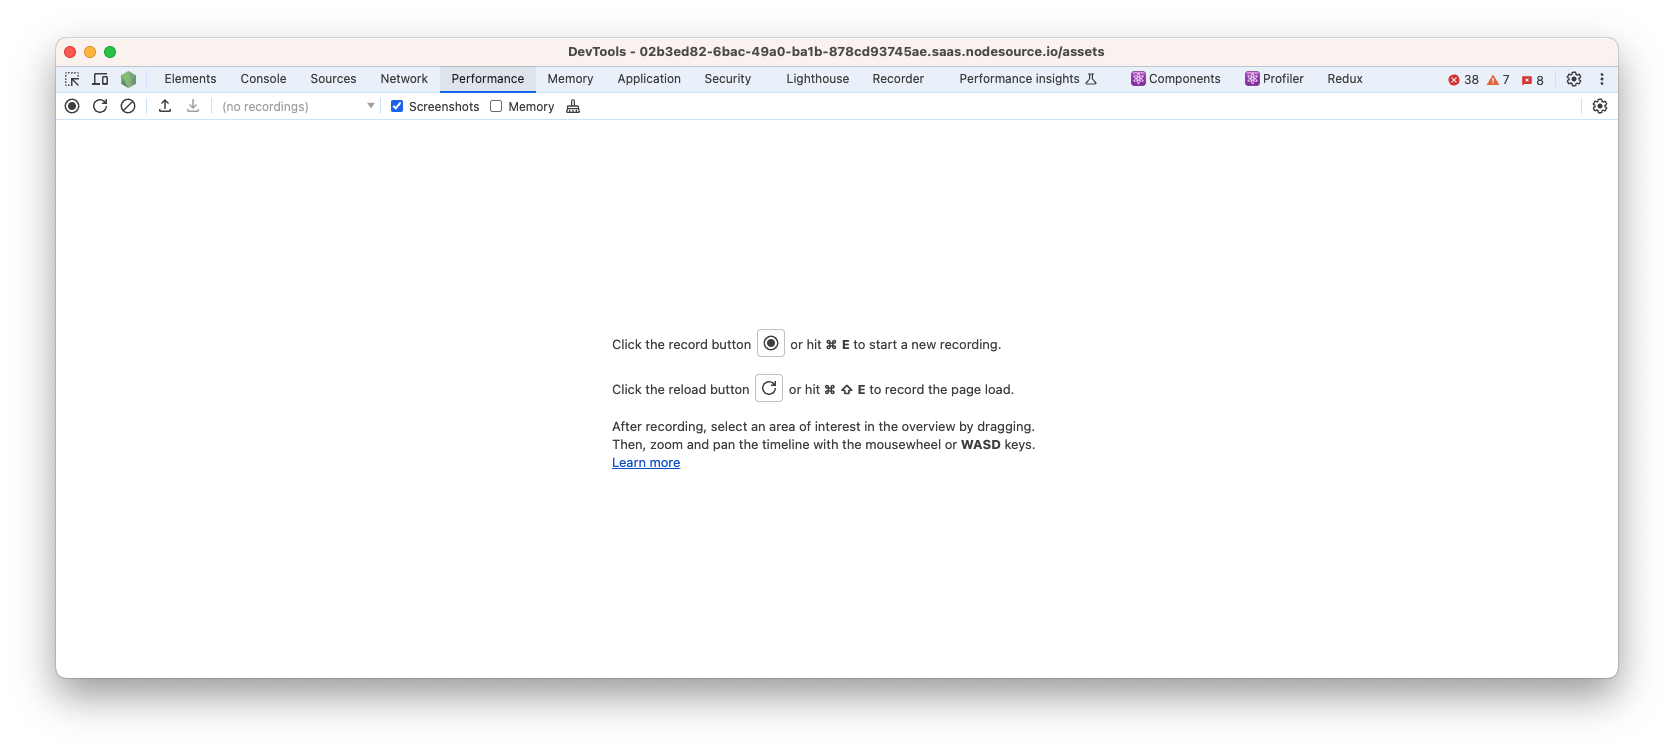
After loading the asset into the "Performance" pane, Chrome Devtools will display a flamegraph representing our JavaScript code ran during profiling