Dashboard
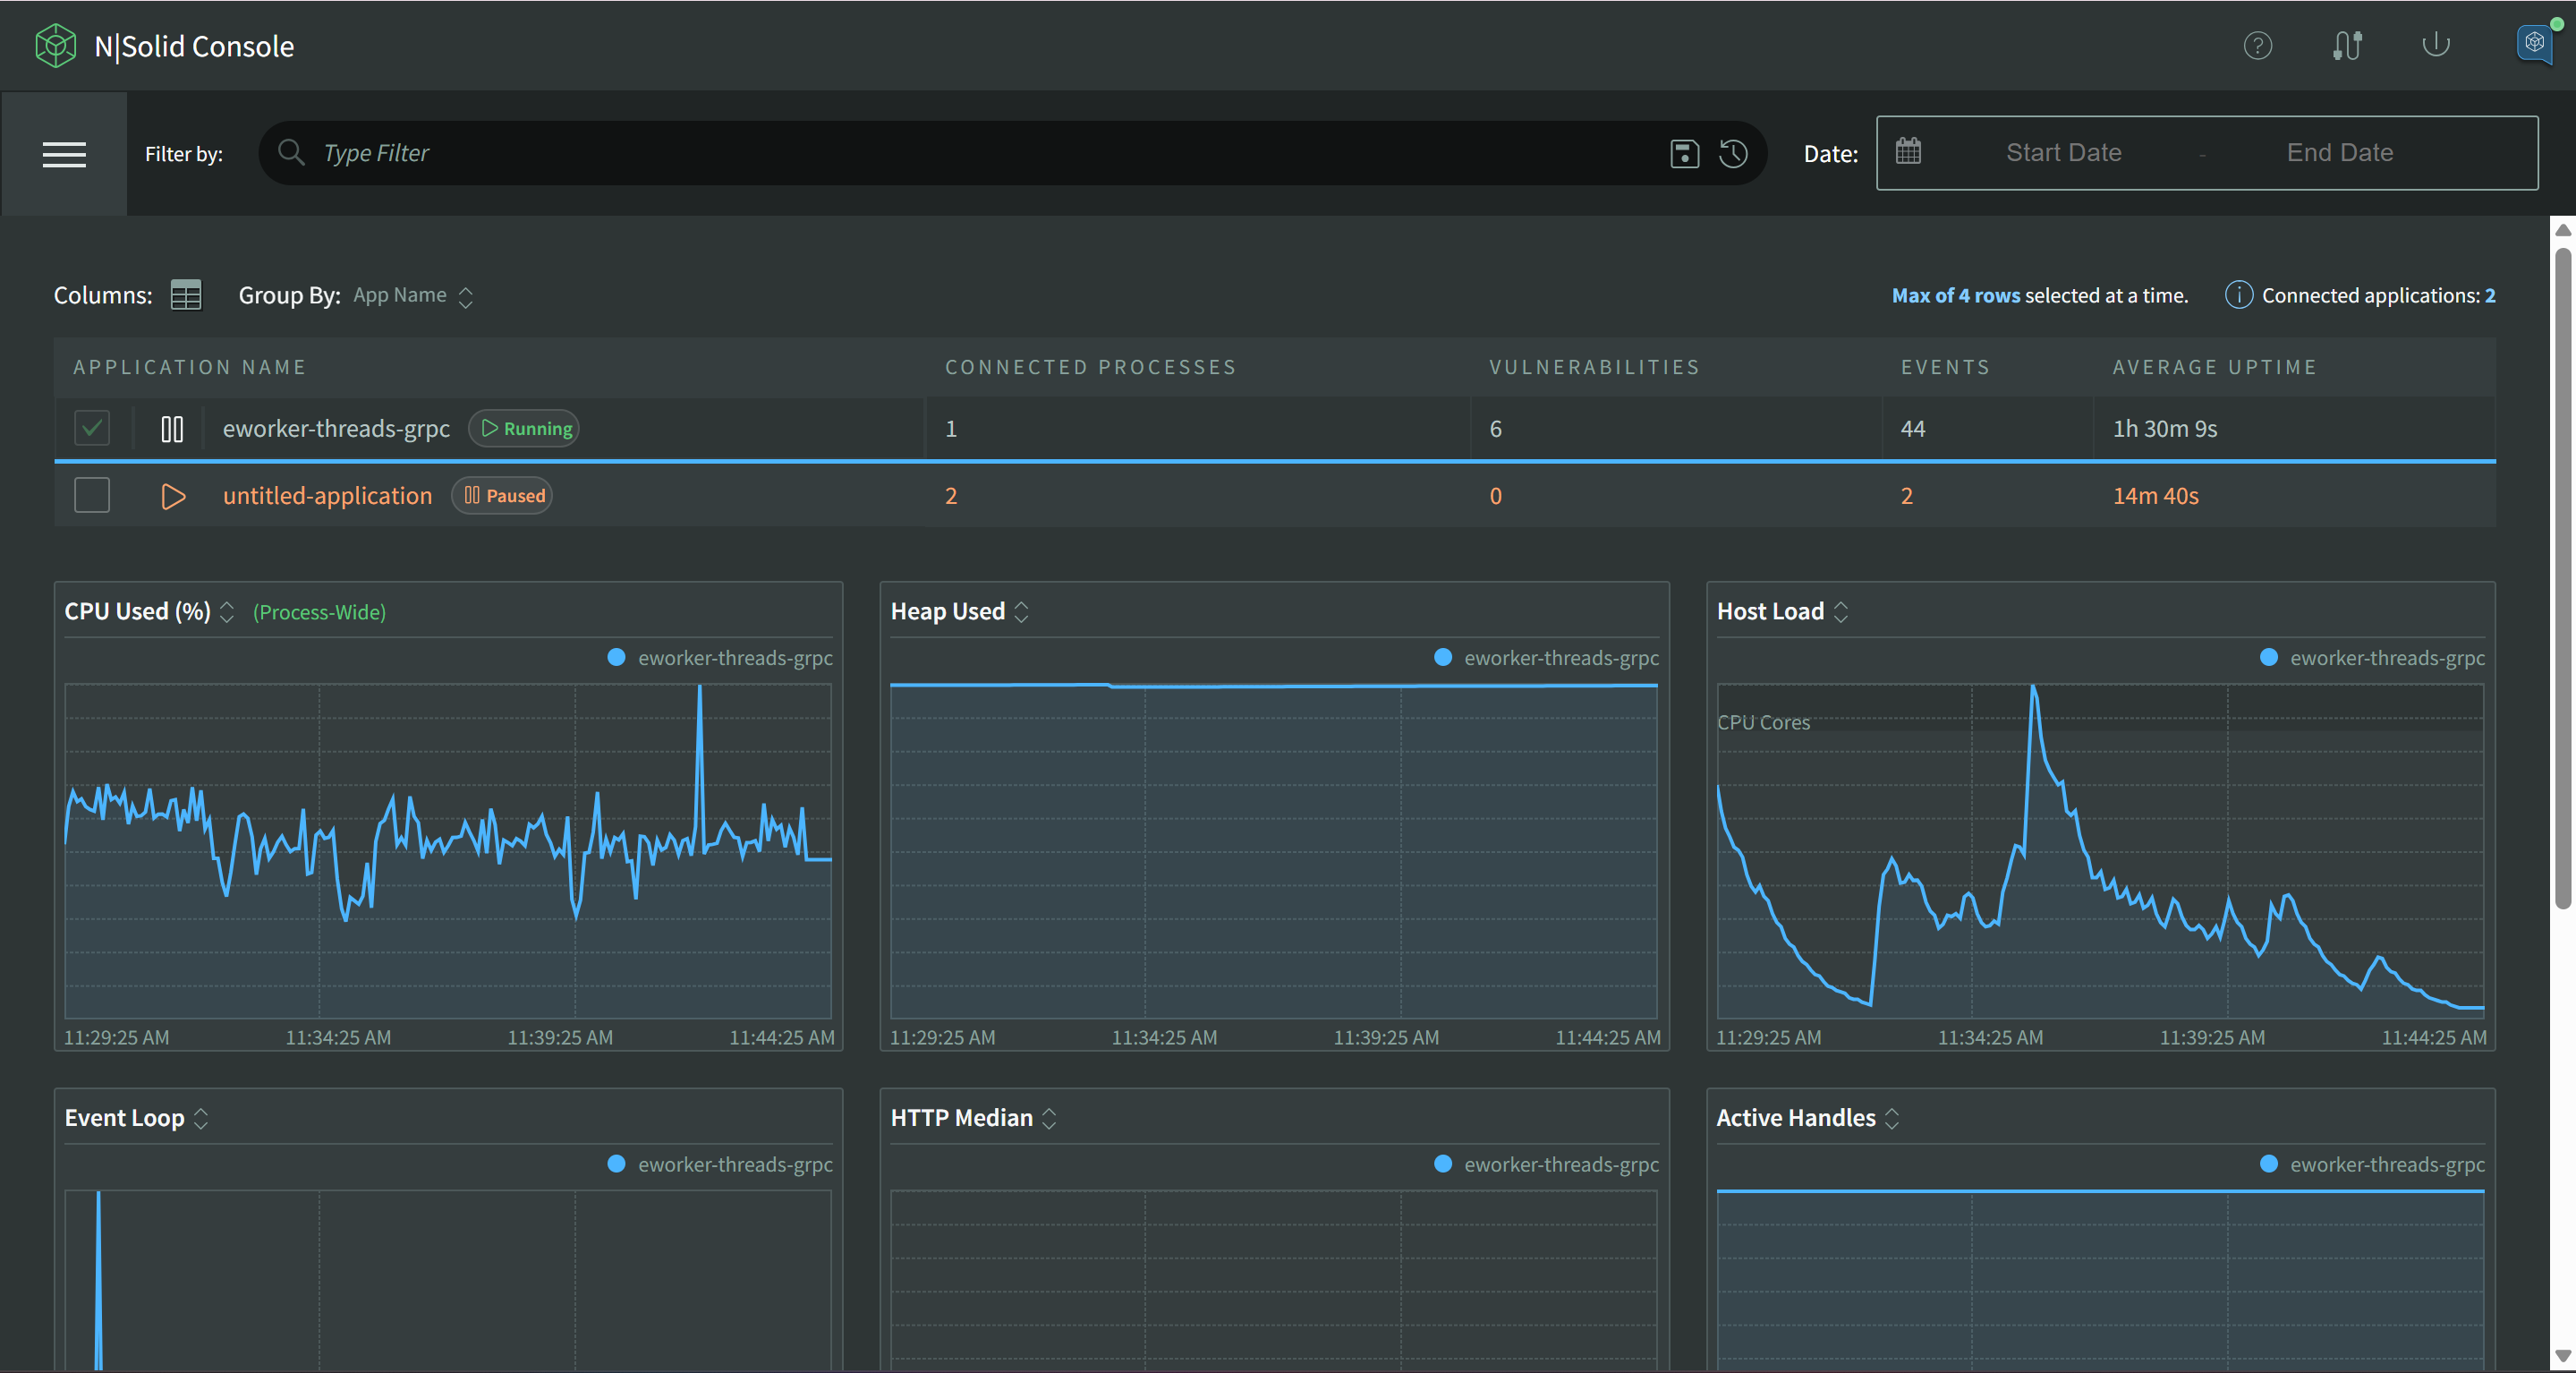
The default view of the N|Solid UI is the Dashboard view, which contains the global Filter Bar, a Table listing the results, and a grid of Graphs of Metrics. The view will differ for a result set with 0, 1, or more than one series of N|Solid Agent data. In a typical multiple-process installation, you will see a Dashboard summarizing your data at the NSOLID_APPNAME (see Configuration for more info) level with a table for each Application. The dashboard's view is limited to 100 processes. Should you have more, custom filters can be used to see them.
Grouping
It's a best practice to run multiple instances of each type of application processes in your Node.js infrastructure, so we've provided a grouping mechanism that allows you to roll up processes by various attributes for comparison or summary analysis. Grouping is similar to process identification and most of the attributes for identification can be used for grouping.
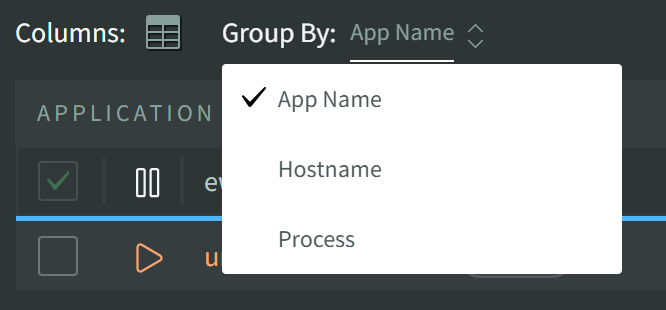
The "Group By" dropdown menu will let you switch between available group types, or to remove grouping entirely, select "Process" to group by individual processes.
App Name
Group by application name. See Runtime Configuration for more details.
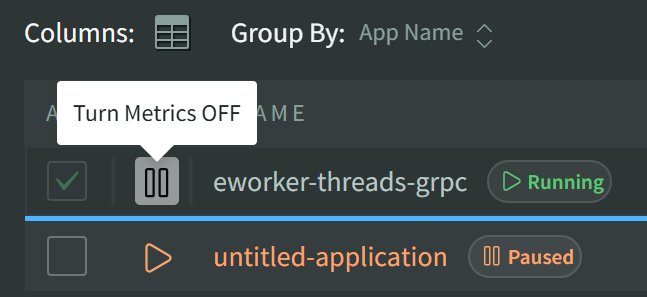
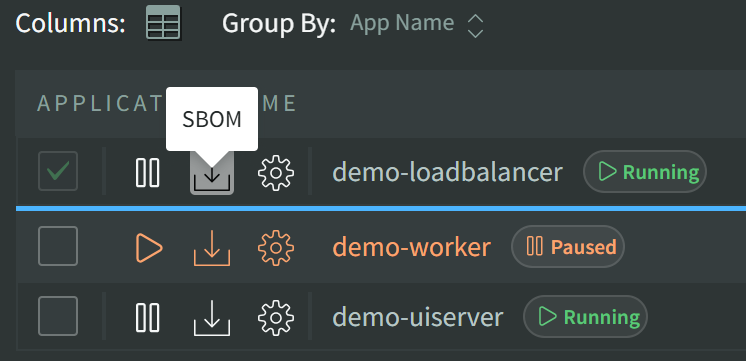
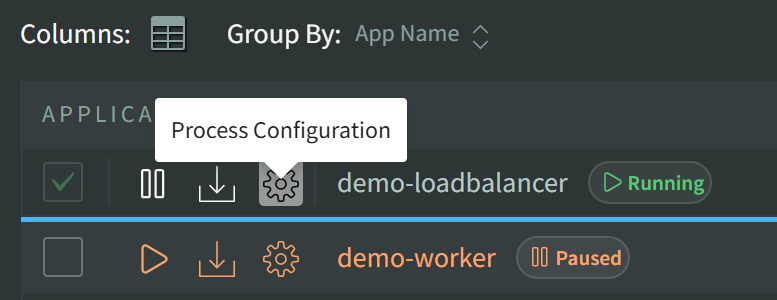
When grouped by Application name, a few options will be available for each application, Turn Metrics Off, Configuration and SBOM download.
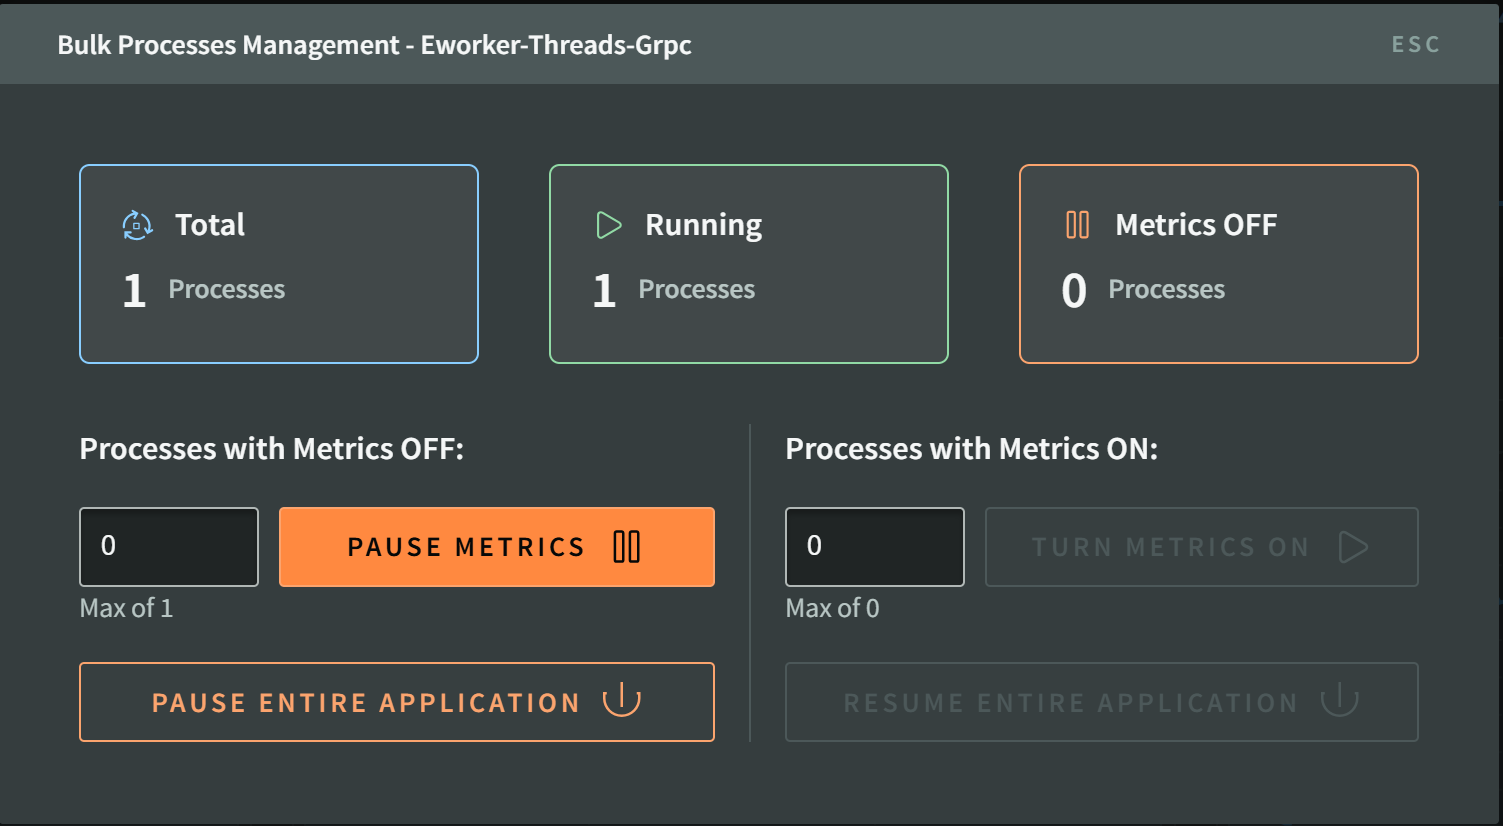
Click Turn Metrics Off to open the Bulk Process Management Modal. This can be used to turn off/on any number of processes under an application.
Click SBOM and select PDF or json to download a Software Bill of Materials for your application, listing all 3rd party packages and versions found.
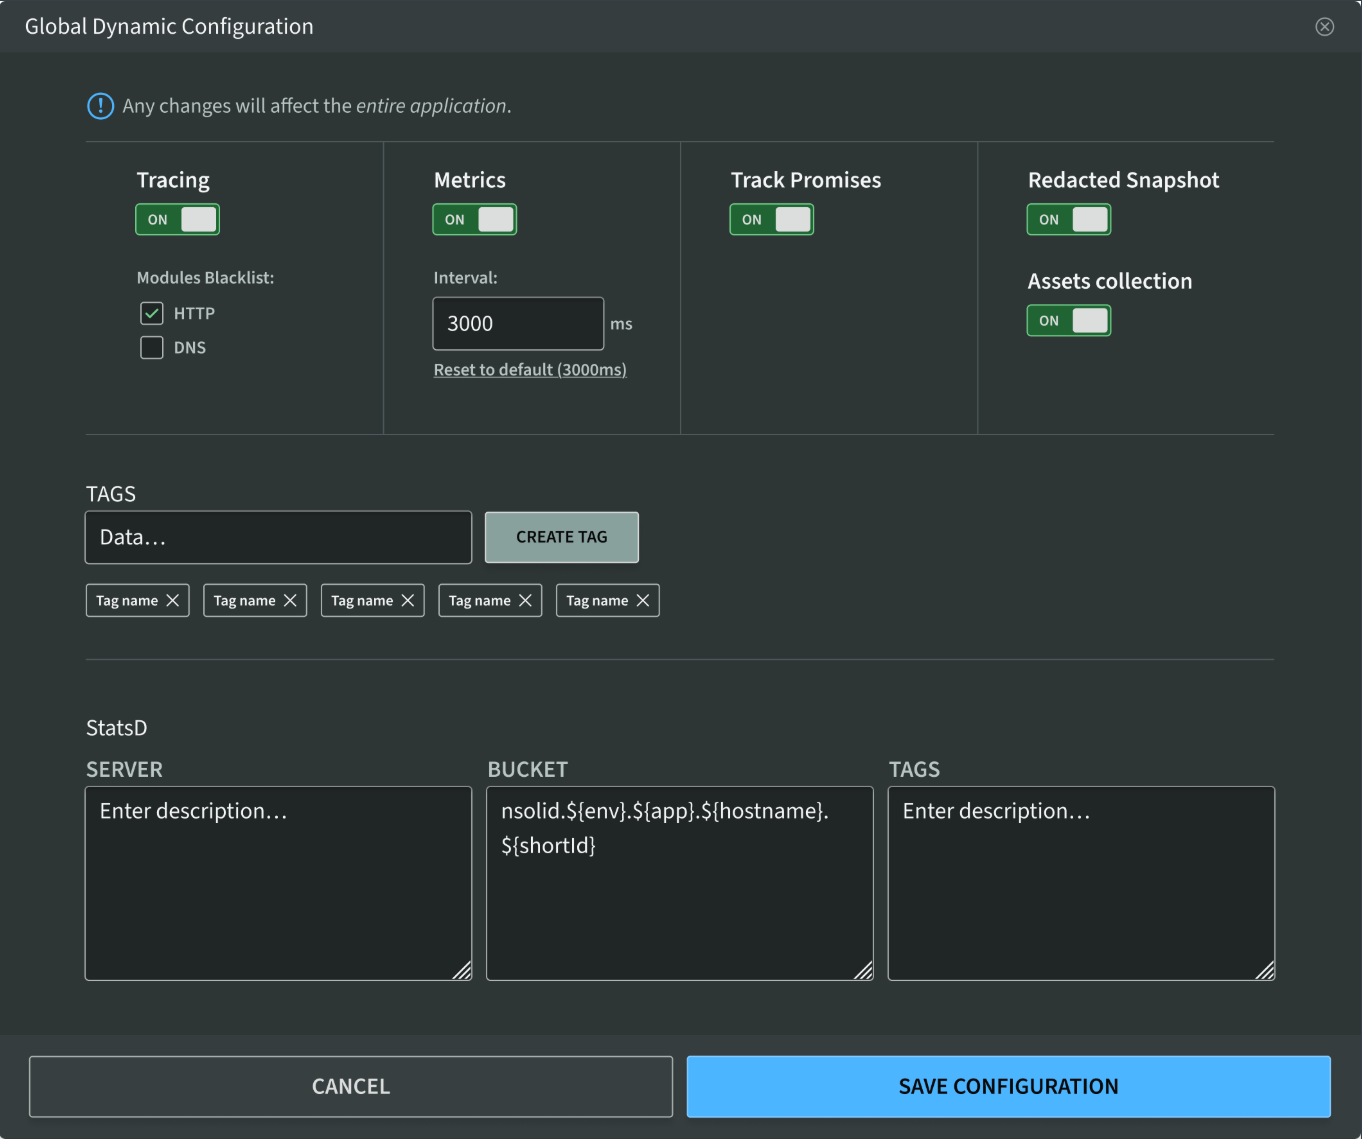
Click on the gear icon to open the Application Configuration modal. When saved, all connected processes for this application will receive a configuration update. This can be used to enable tracing or toggle Redacted Snapshots at the application level.
The Application Configuration Modal:
Hostname
Group by hosts running processes.
If you are using containers, the "host" is the container.
Process
Select "Process" to disable grouping--this list is 1:1 to connected N|Solid Agents.
When viewing ungrouped live data, action shortcuts will be available for connected individual N|Solid processes for collecting CPU or Memory profiles, Heap Snapshots, or Traces.
![]()
 Turn Metrics Off for a single process
 Perform CPU Profiling
 Capture a Heap Snapshot
 Collect Memory Profiles
 Start or Stop OpenTelemetry Tracing
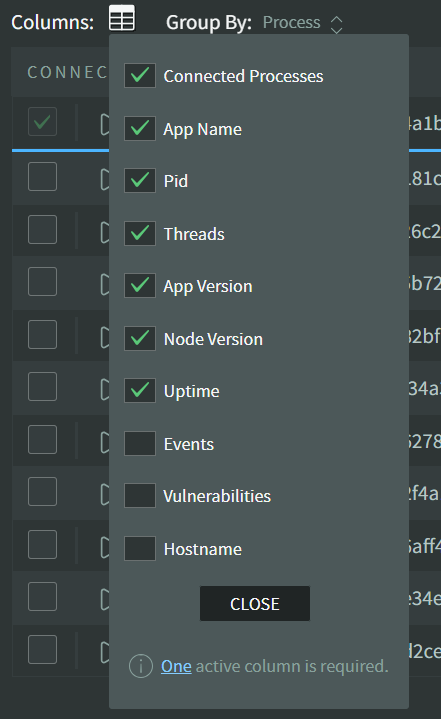
Columns
Columns may be customized based on grouping and the data being shown. Each grouping method will have its own available set of columns.
Single Process View
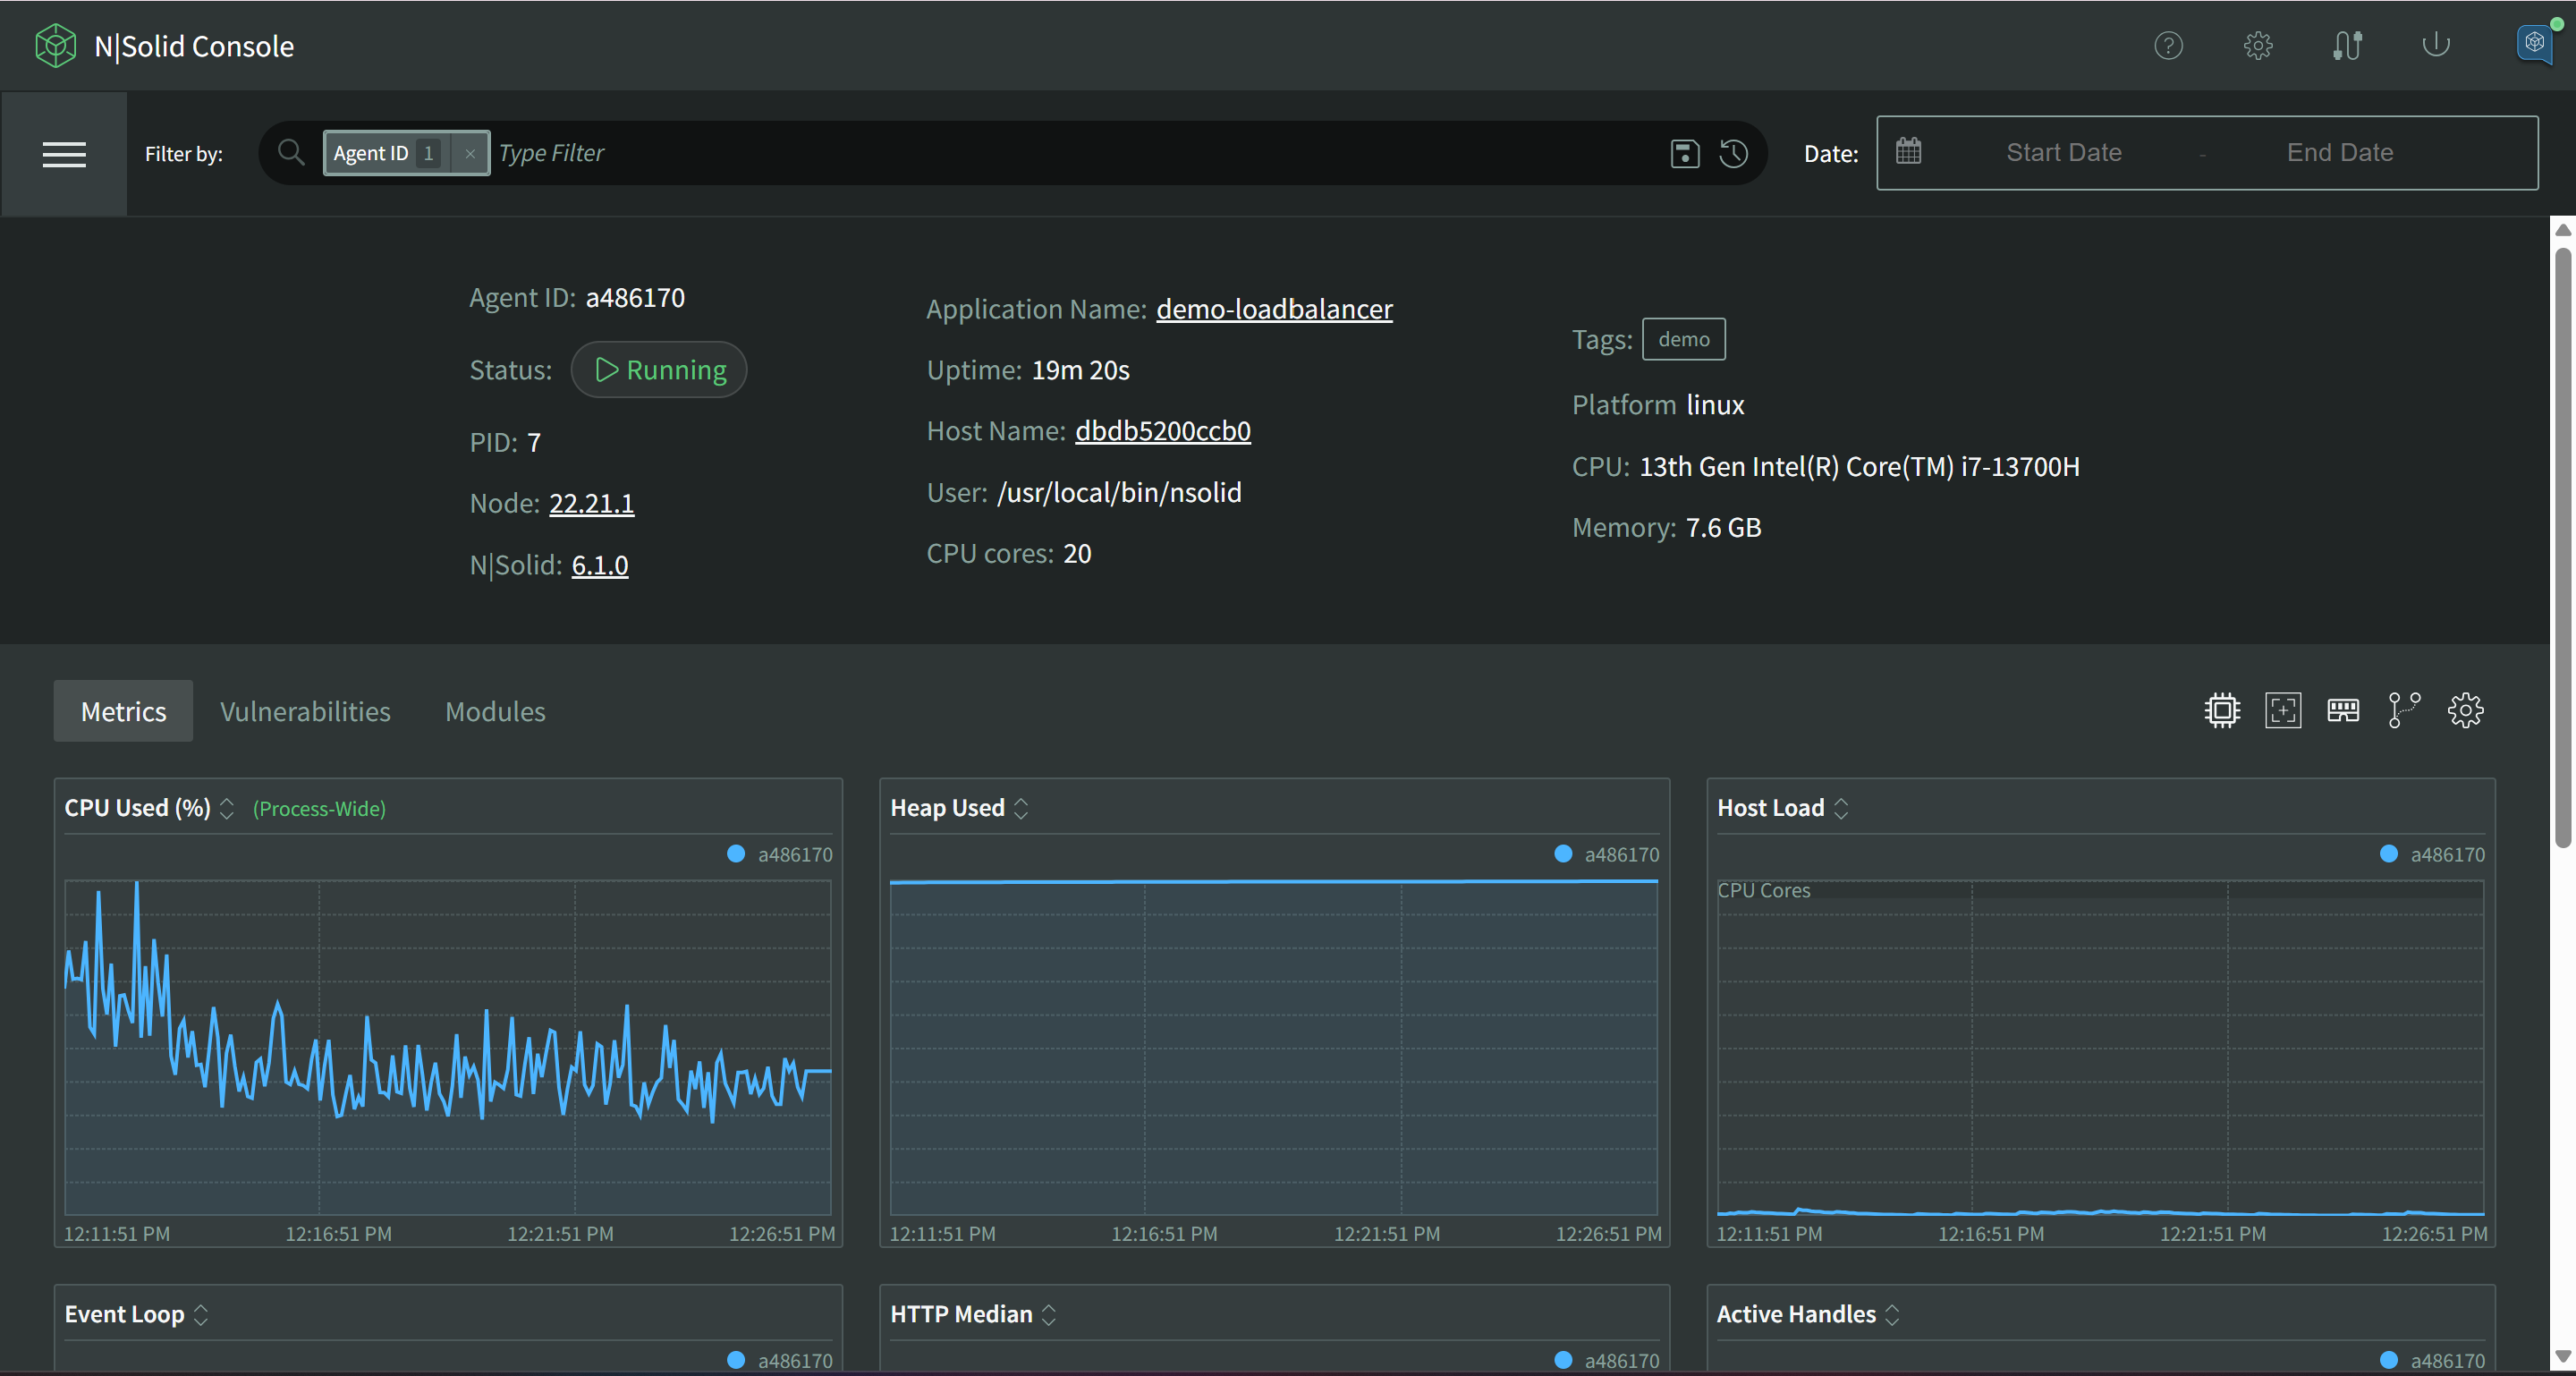
When the filter returns a single process, the default view replaces the grid table with an informational banner containing important information relative to this single process.
- Live Data
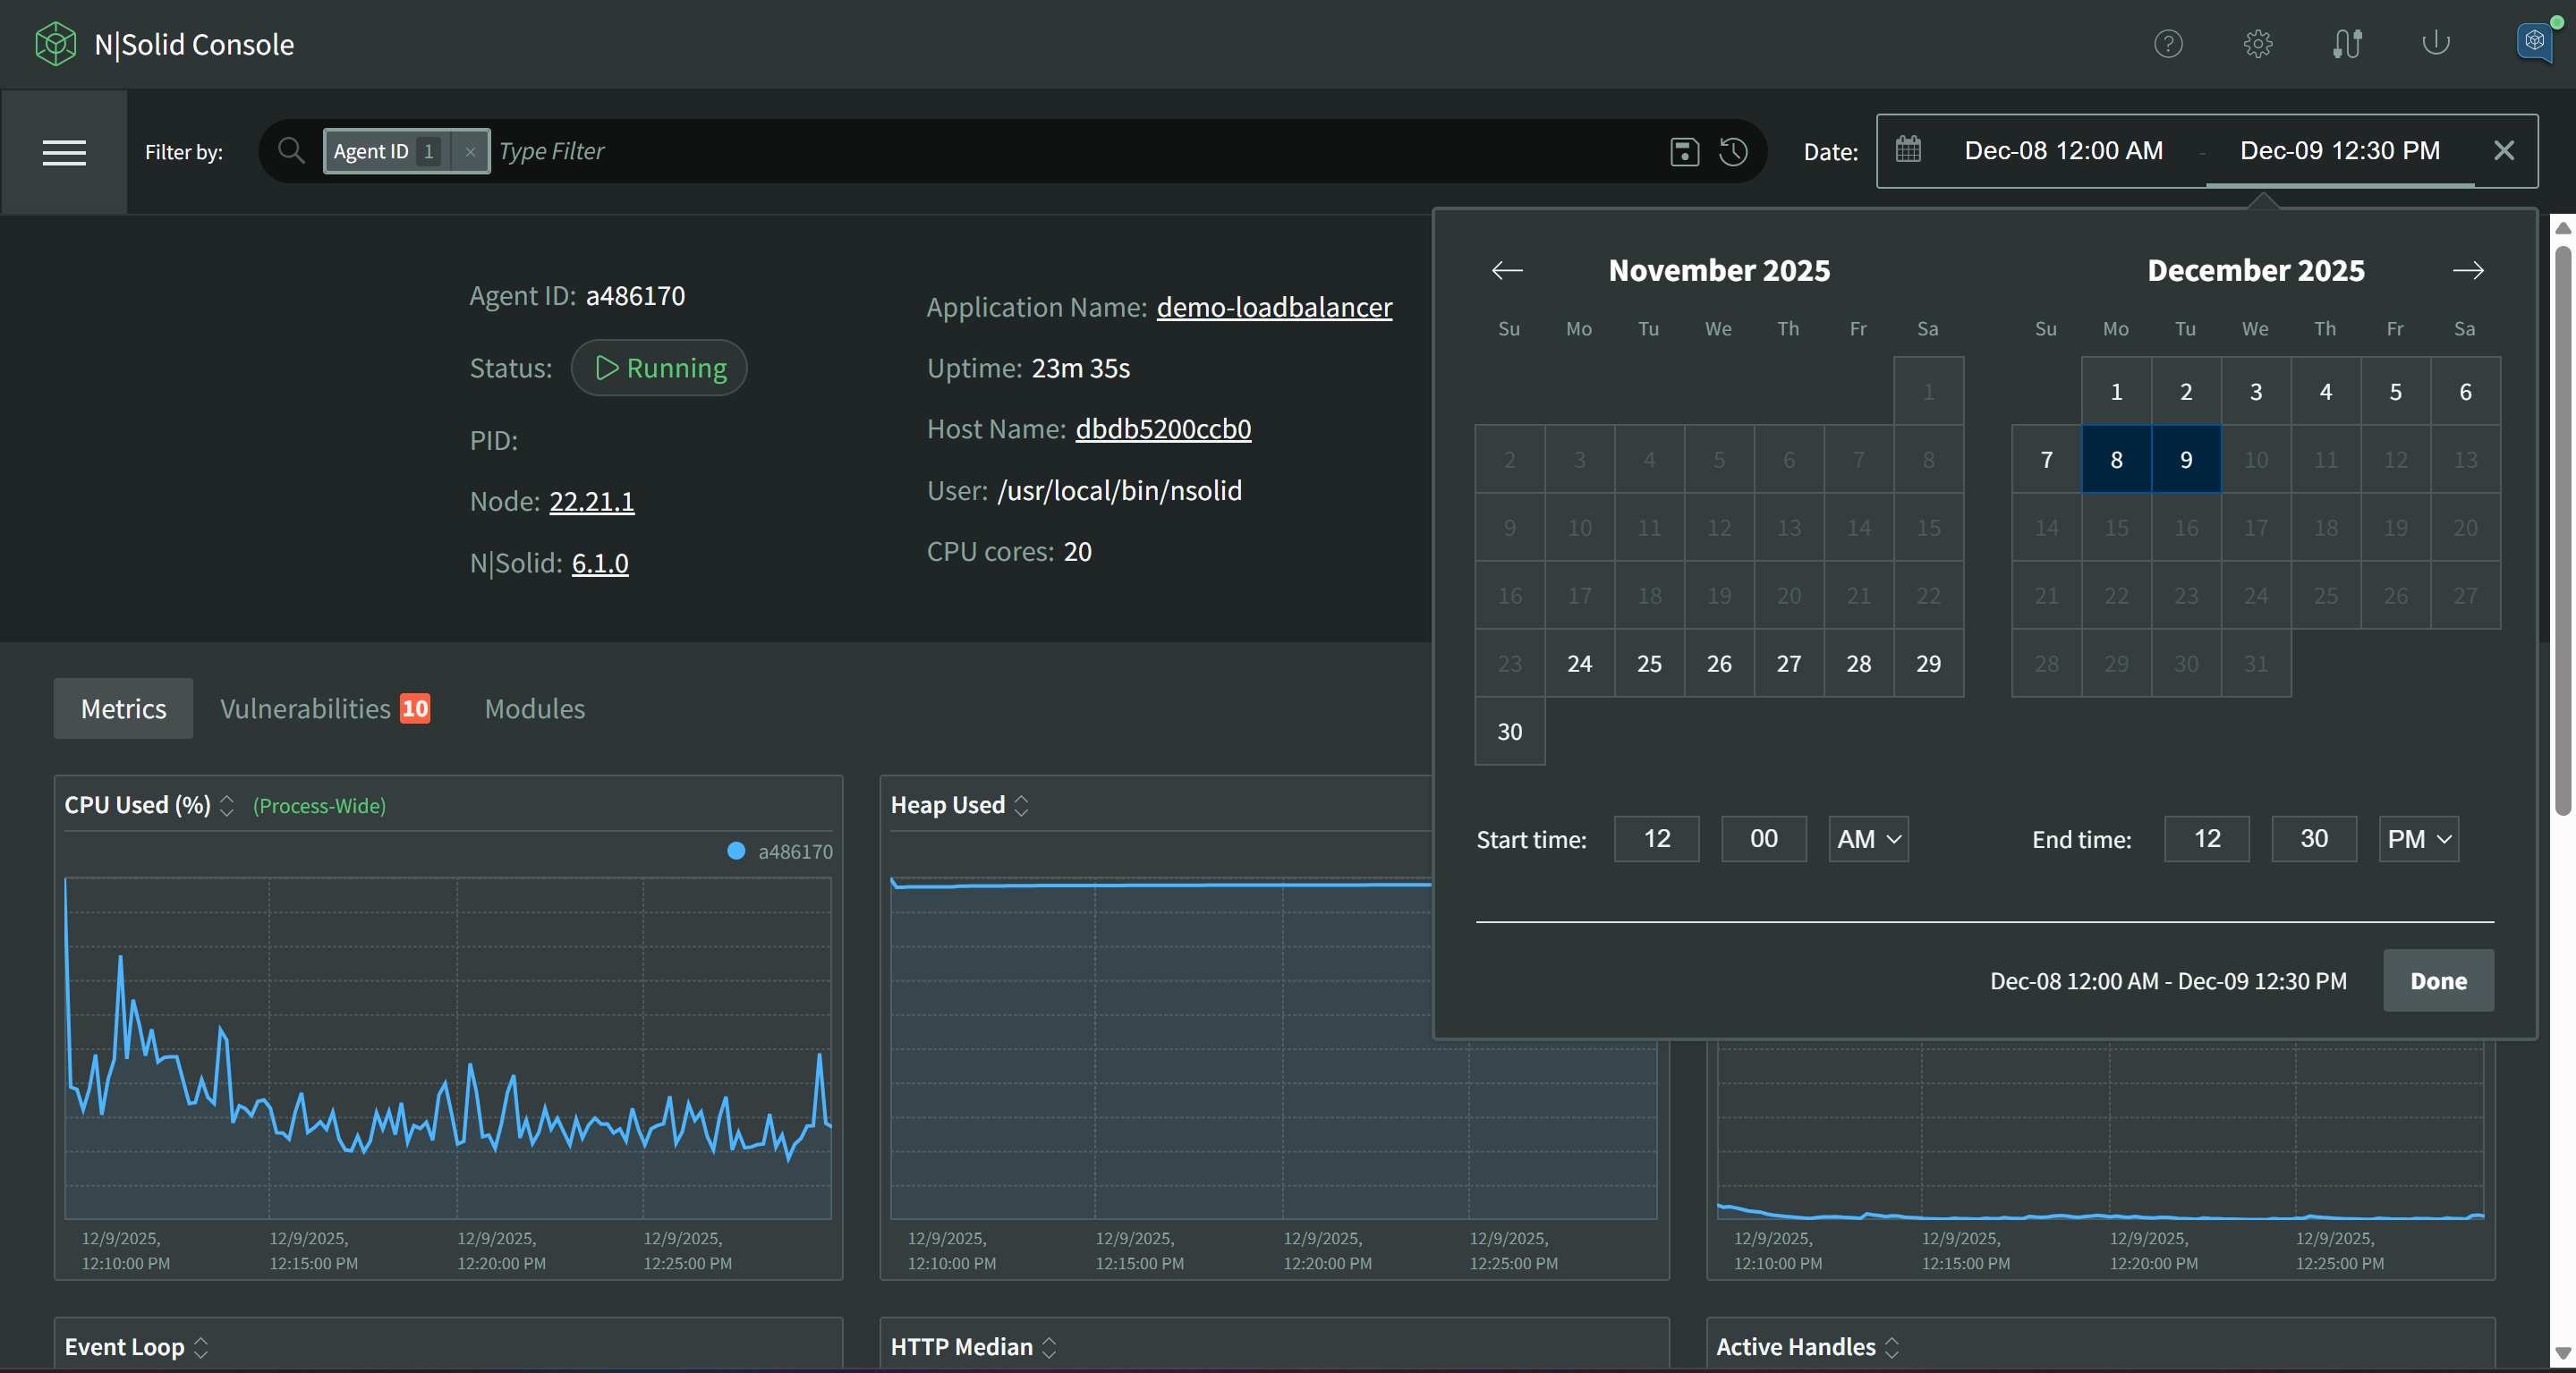
- Historical Data
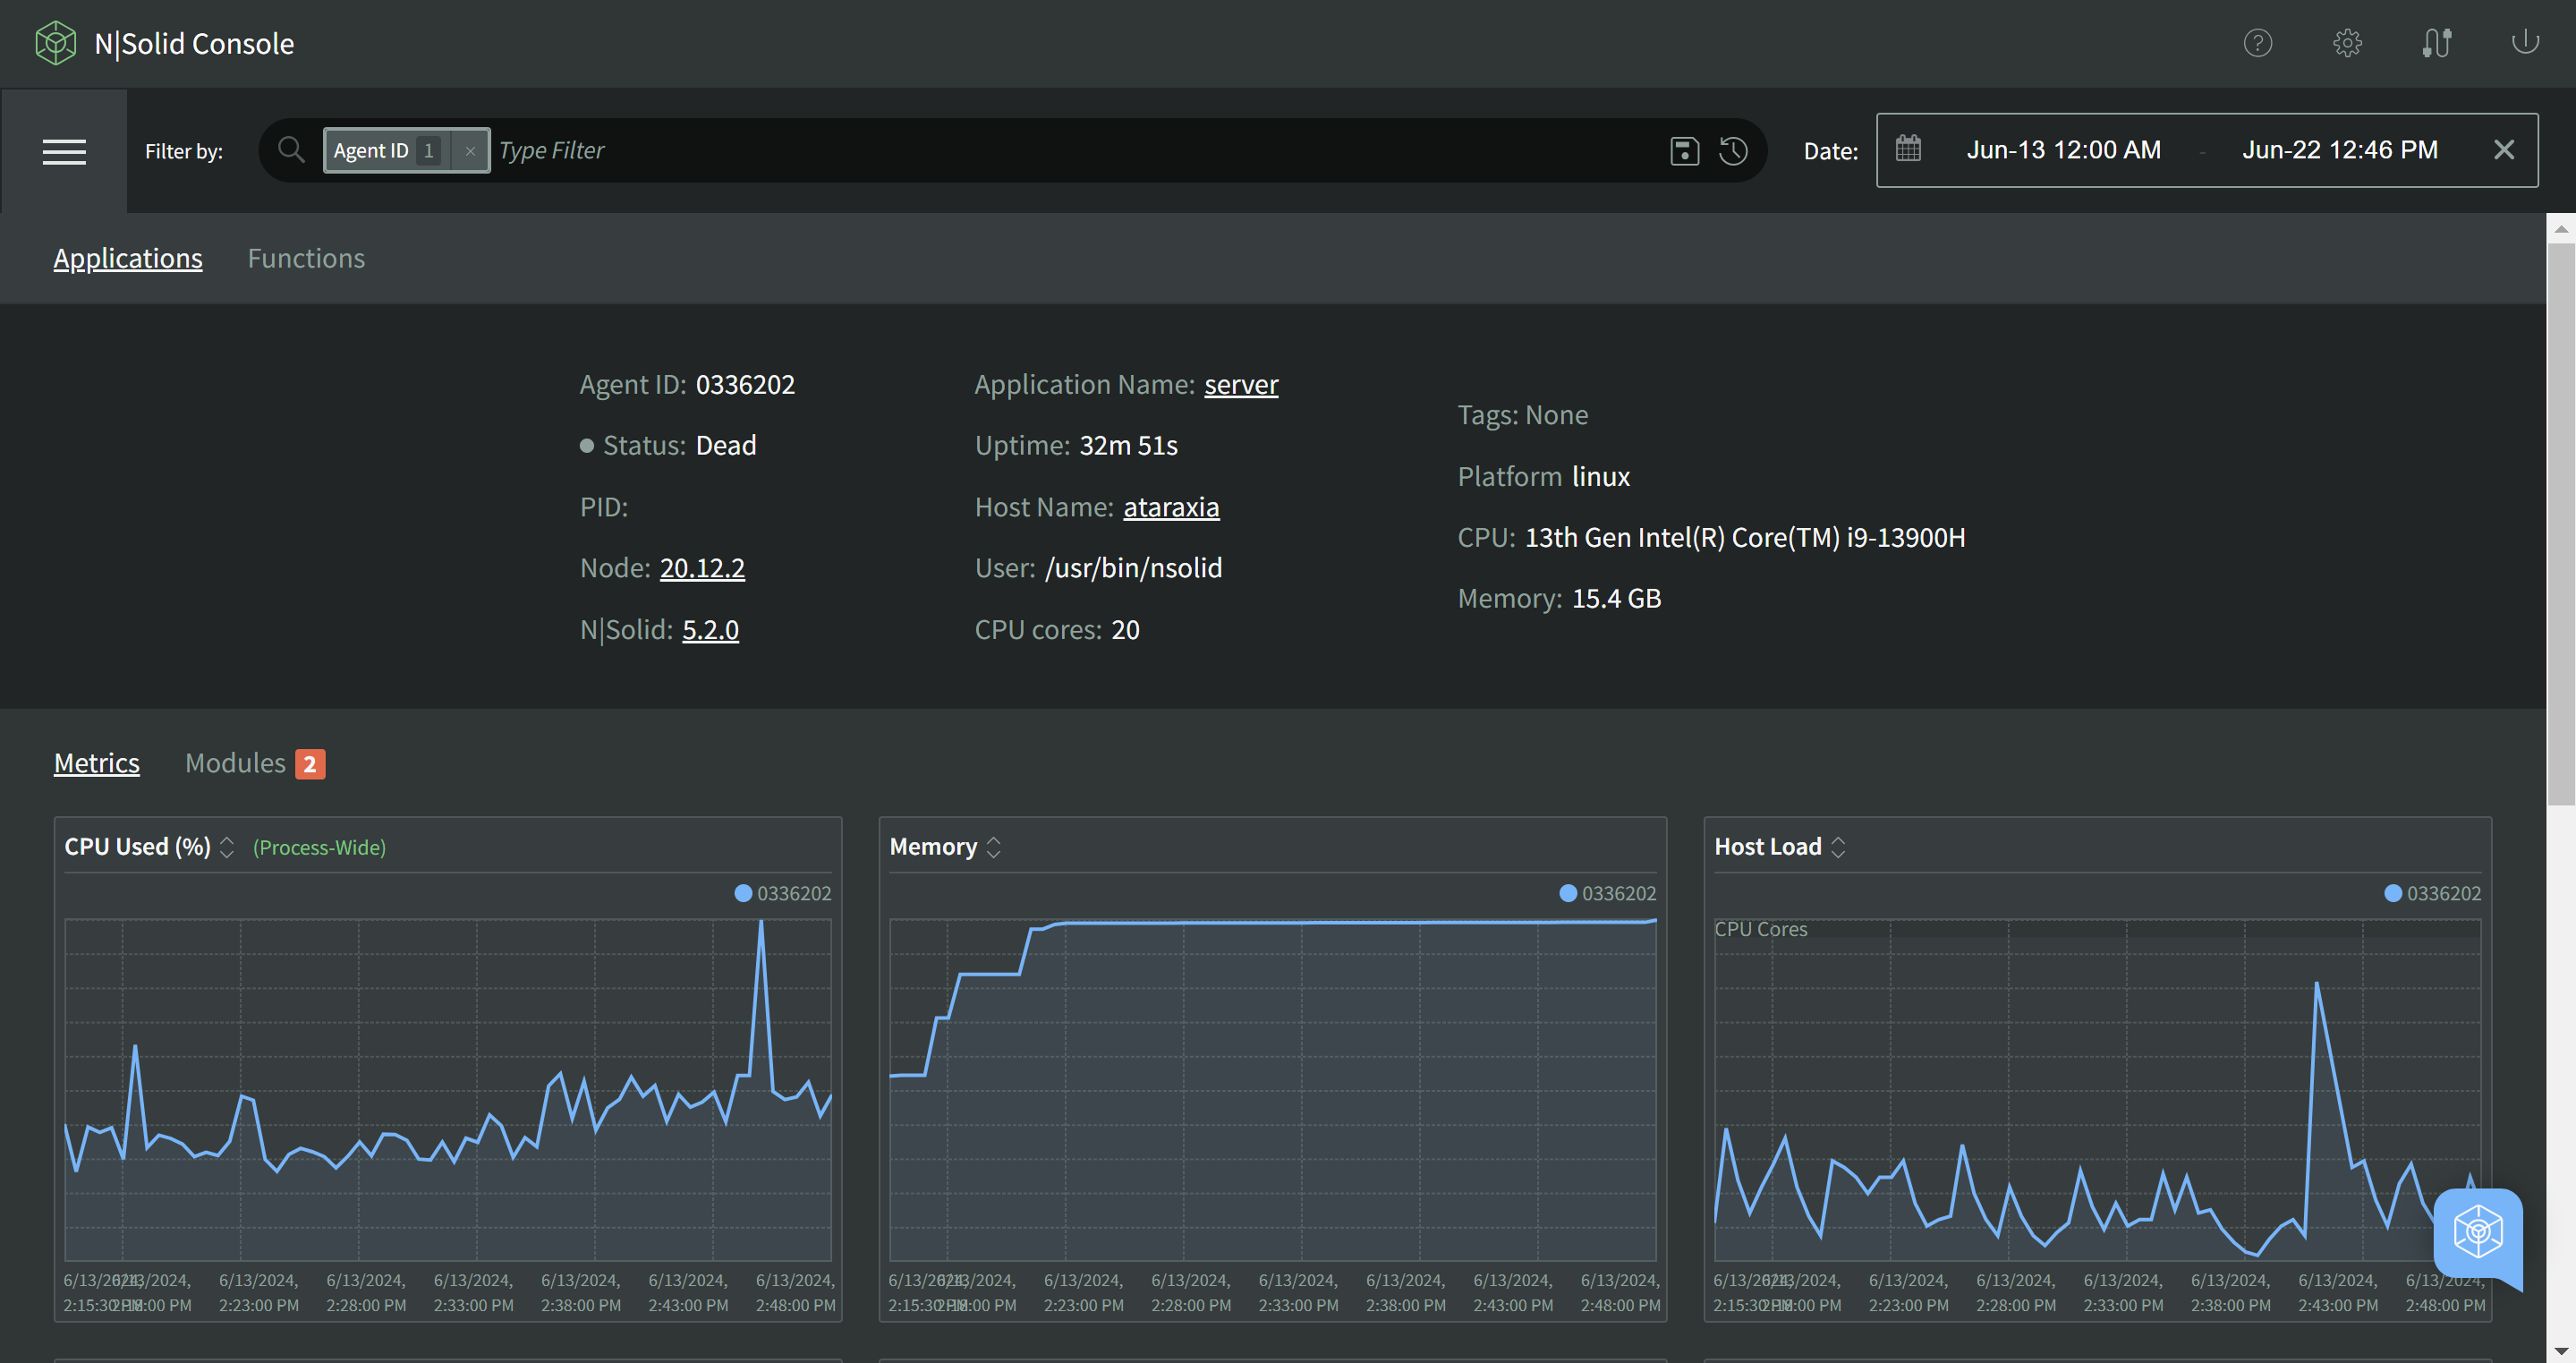
- Dead Process
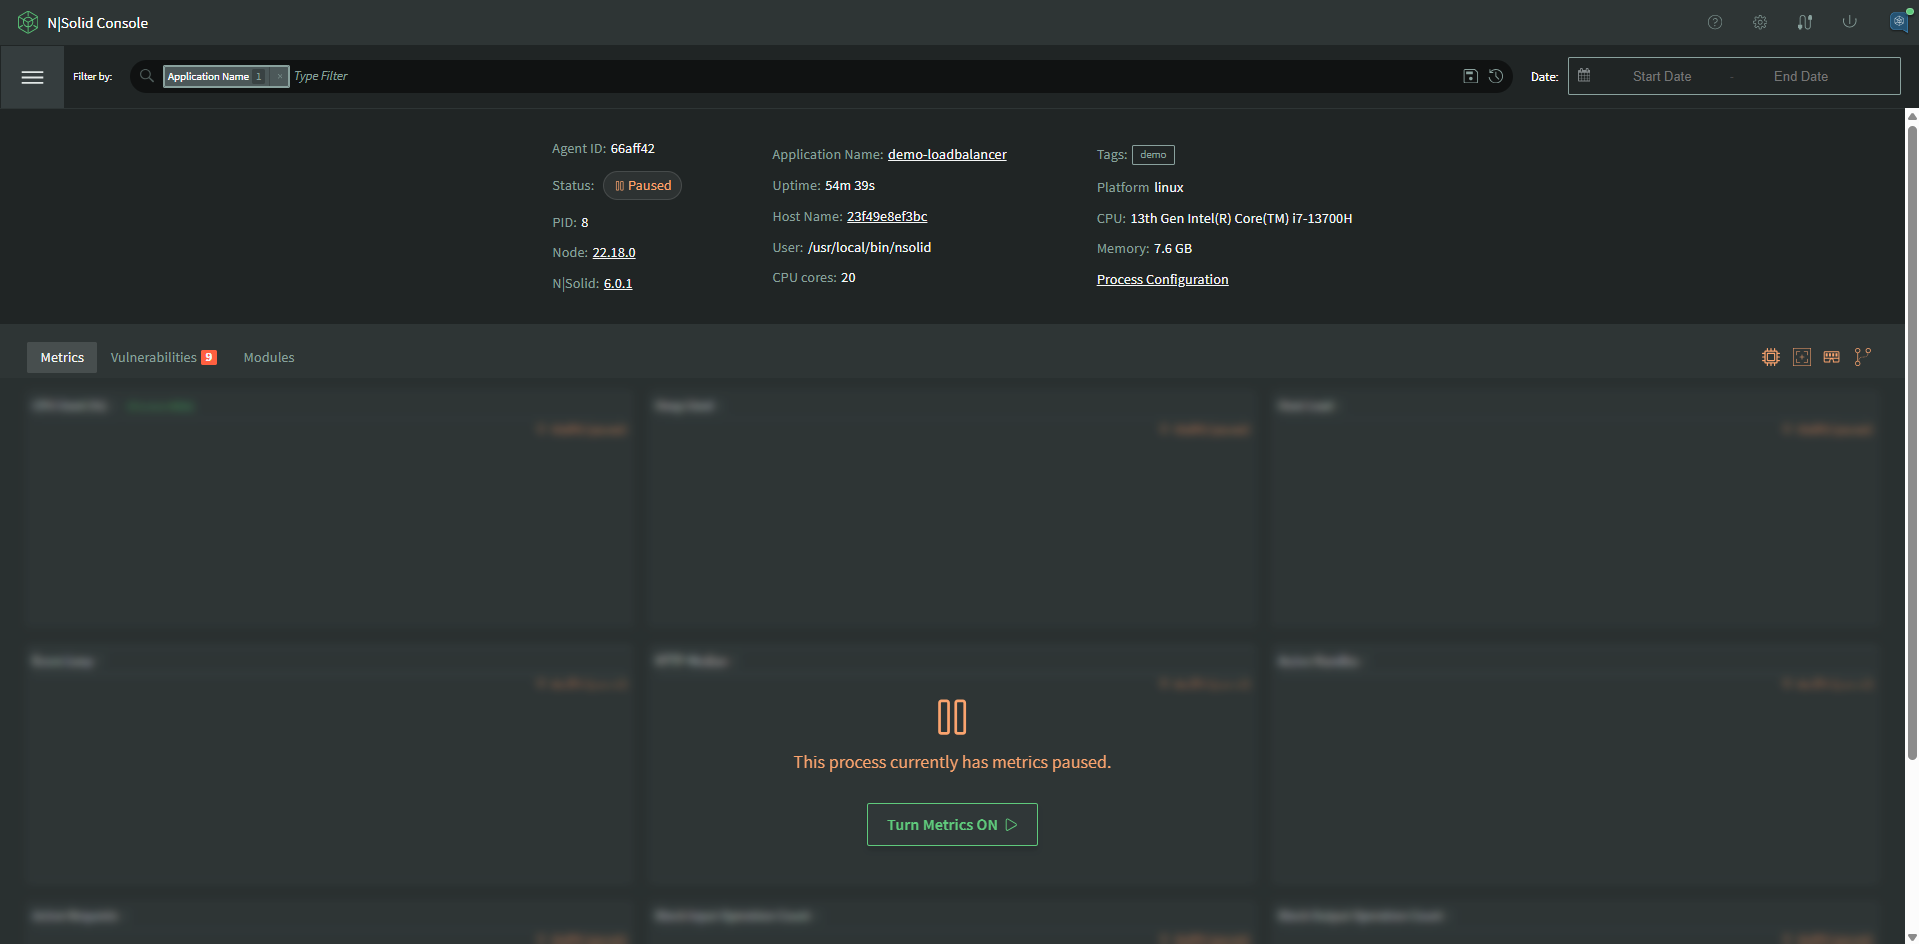
- Paused Process
With no date range selected, it will show you the most recent live data sent by the N|Solid Runtime.
Use the Date Range to view historical data for this process.
Historical data can also be viewed for "dead" processes.
If a process has been paused, the single view dashboard will be replaced with the option to turn metrics for the process on again.
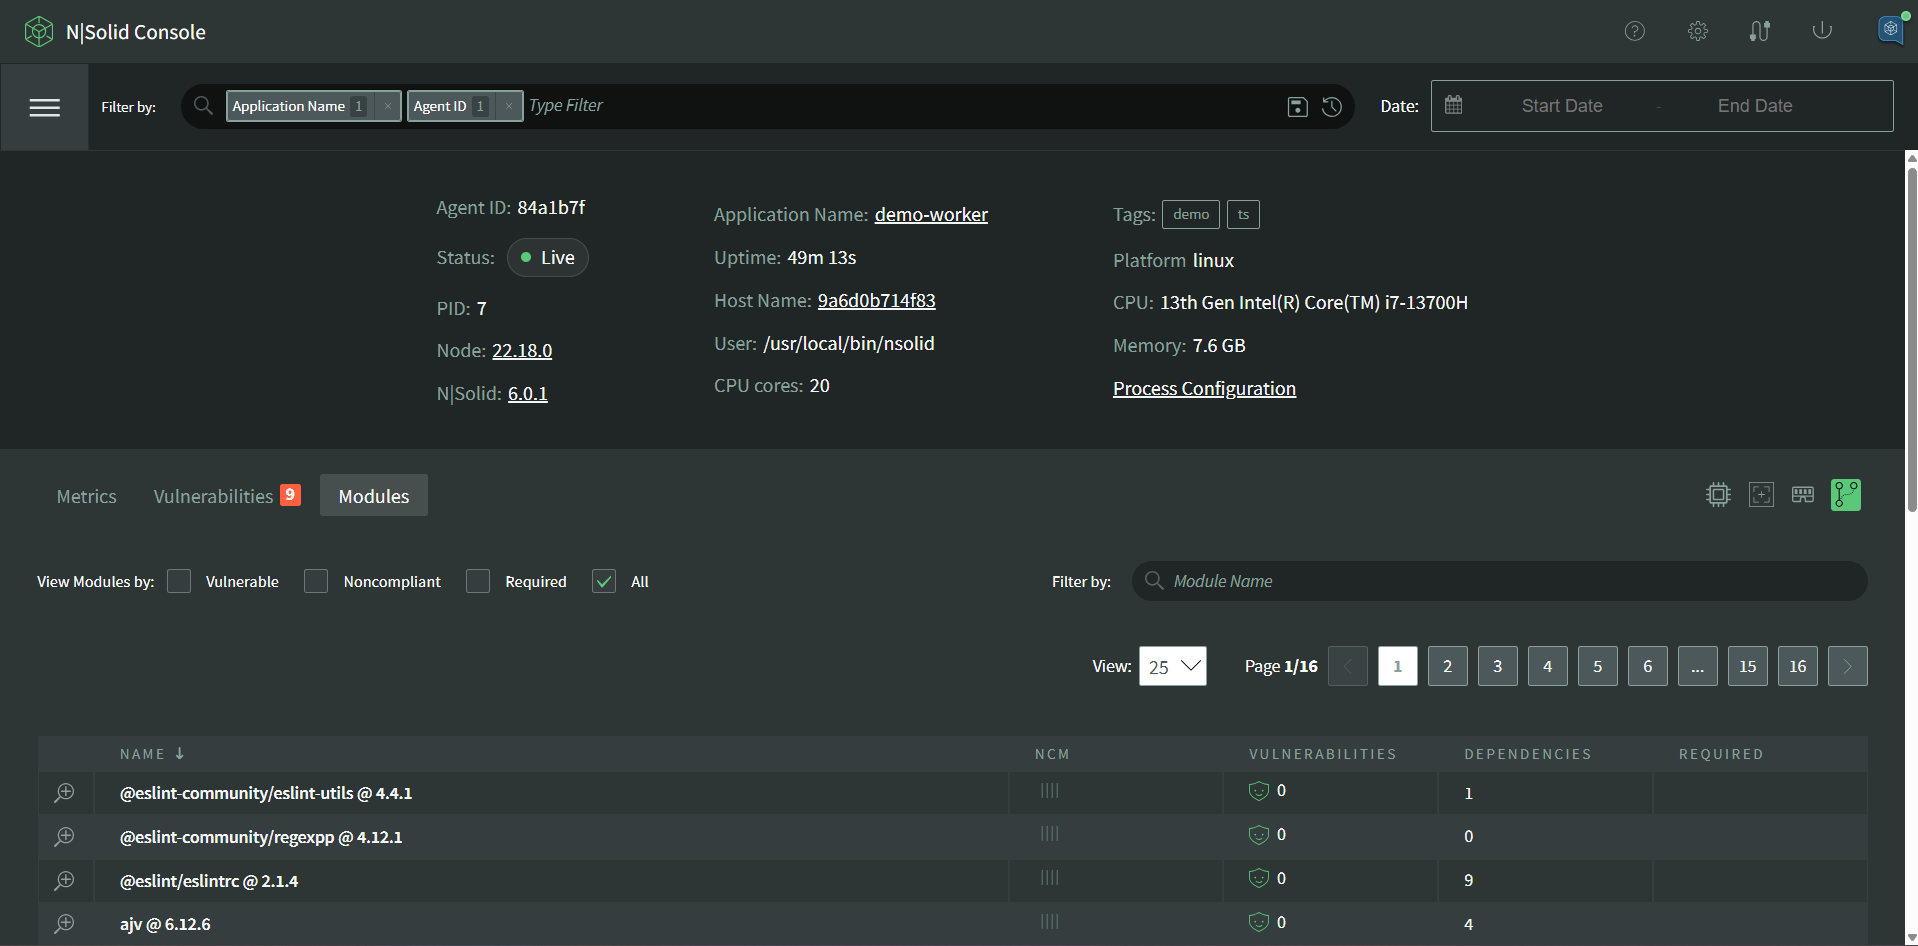
The Single Process View also allows you to browse the entire package set as viewed by the N|Solid Runtime as it started up. If you click where it says 'Modules' you will see the package tree with NCM data with severity ratings, vulnerability counts, and dependency counts. You can also filter the modules by vulnerability, compliance and requirements.
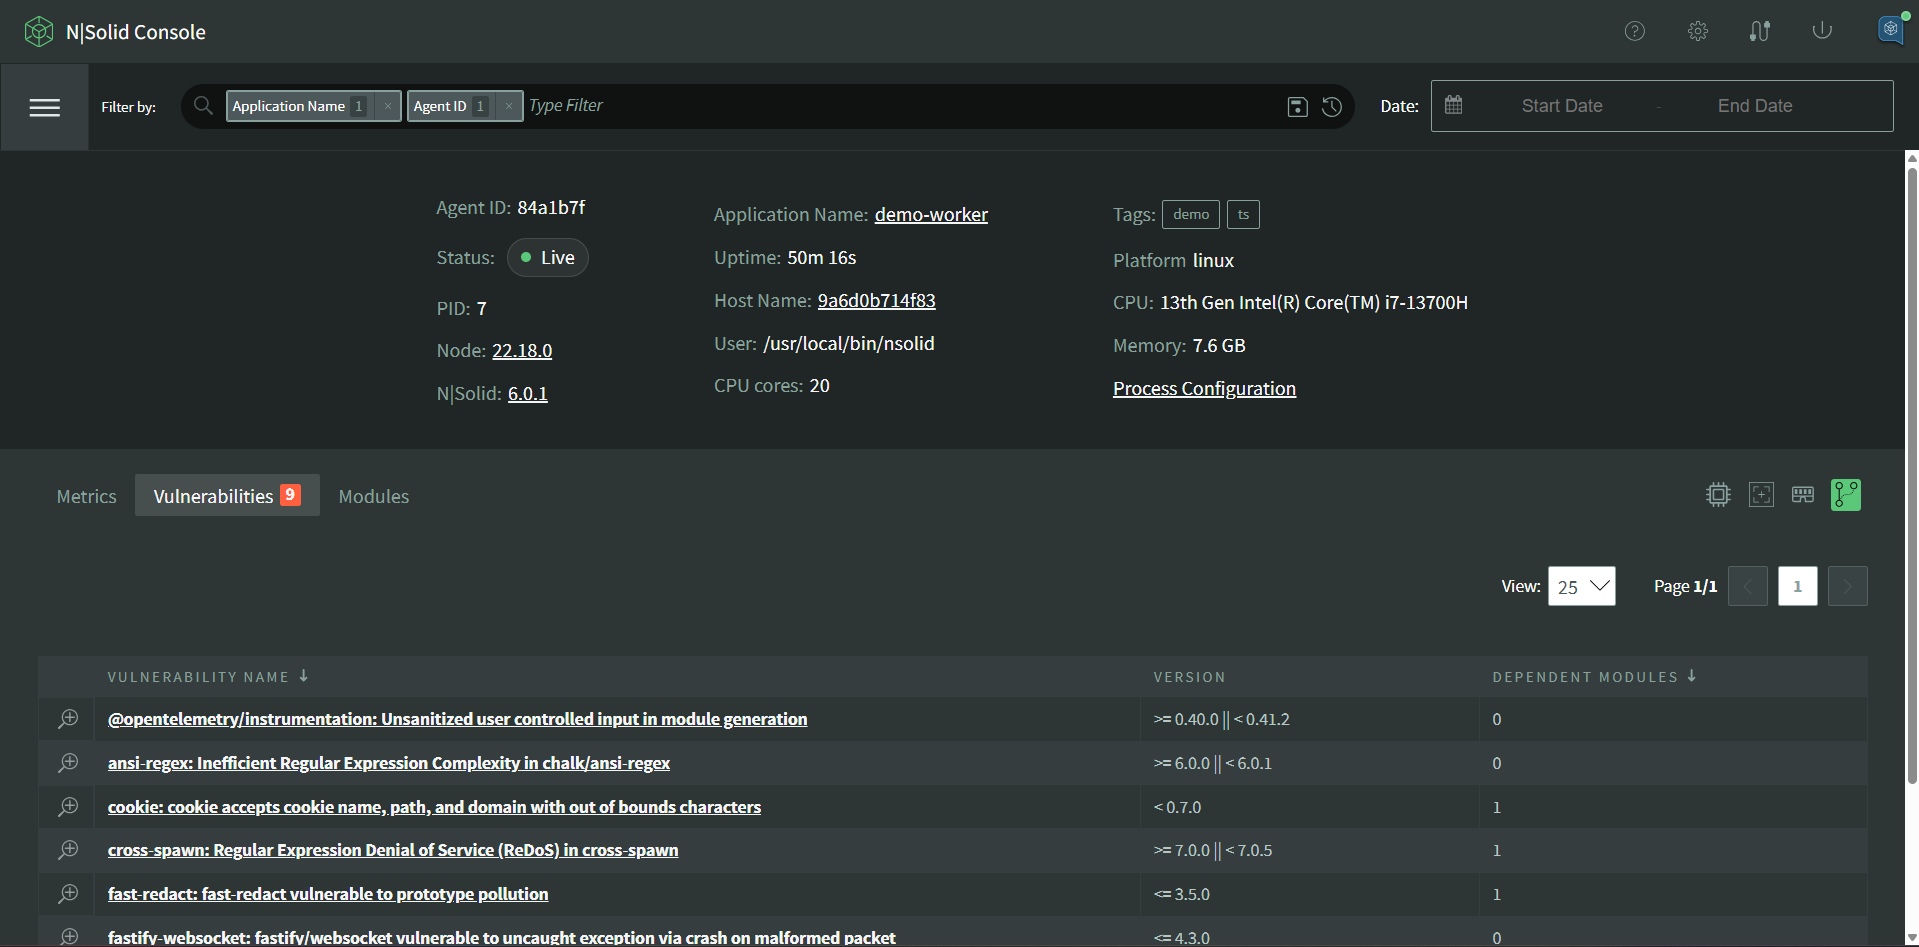
You can also view a single detailed list of vulnerabilities if you click where it says 'Vulnerabilities'
Worker Threads
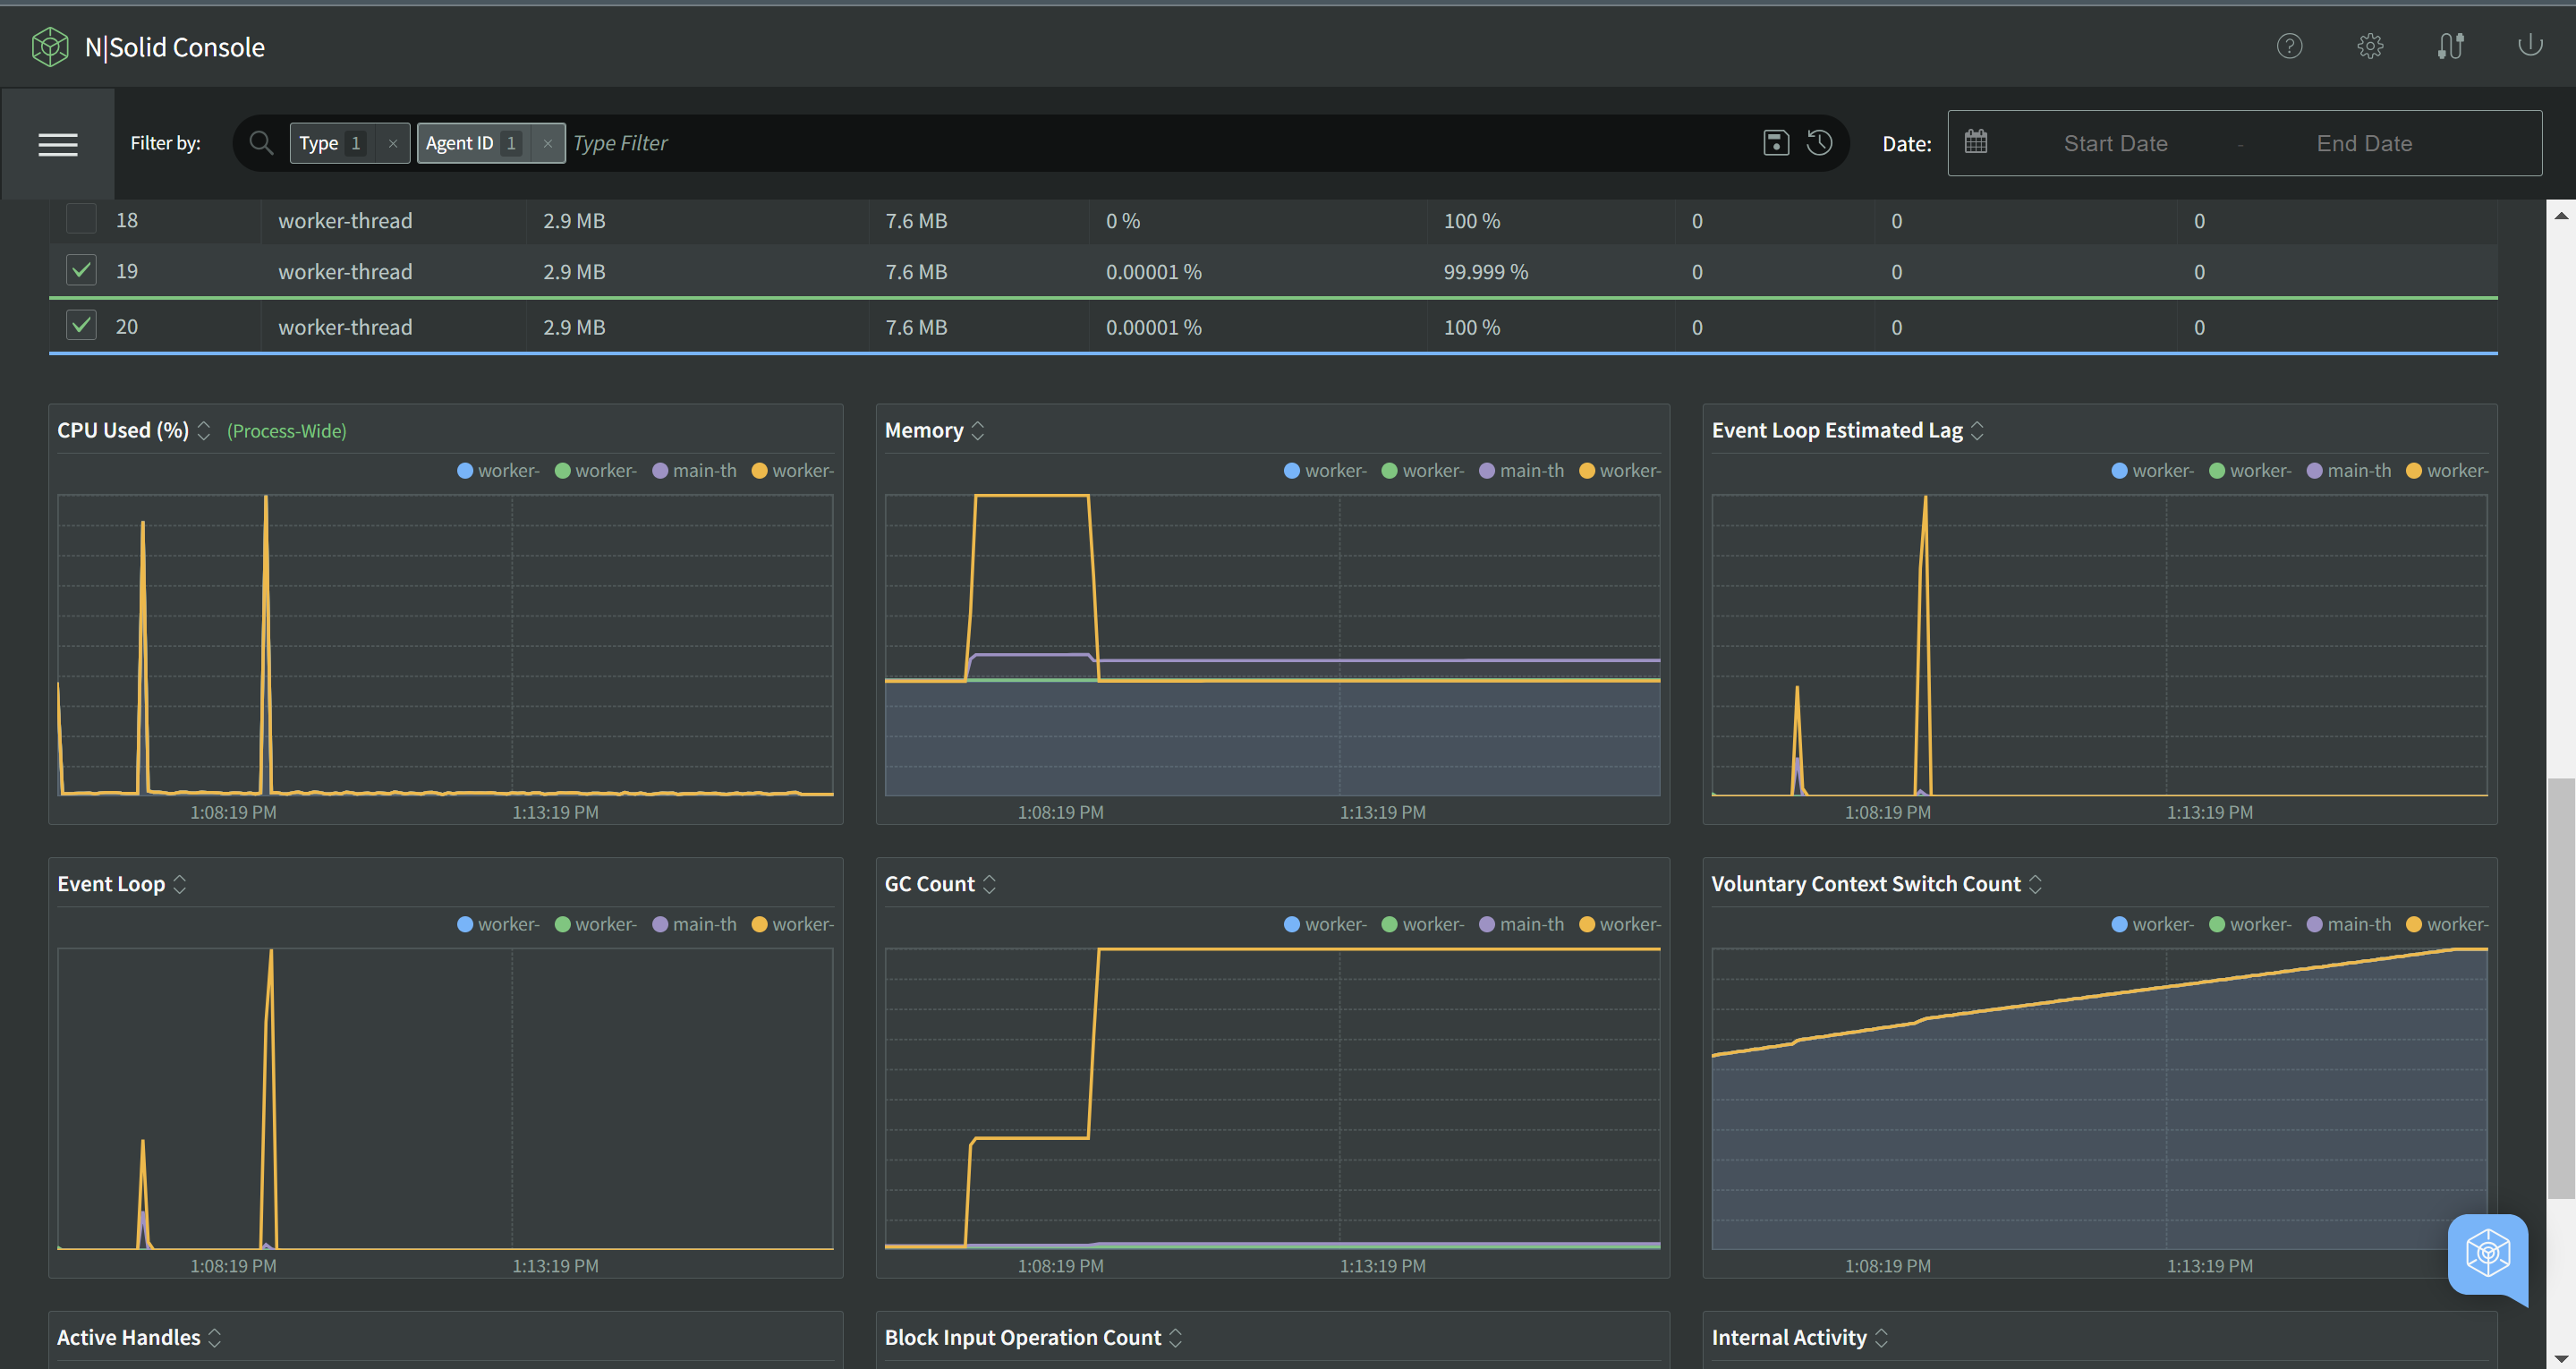
If there are Worker Threads present, a table will be shown listing each worker thread. This table works similarly to the Group By Process view where each thread can be interacted with separately.
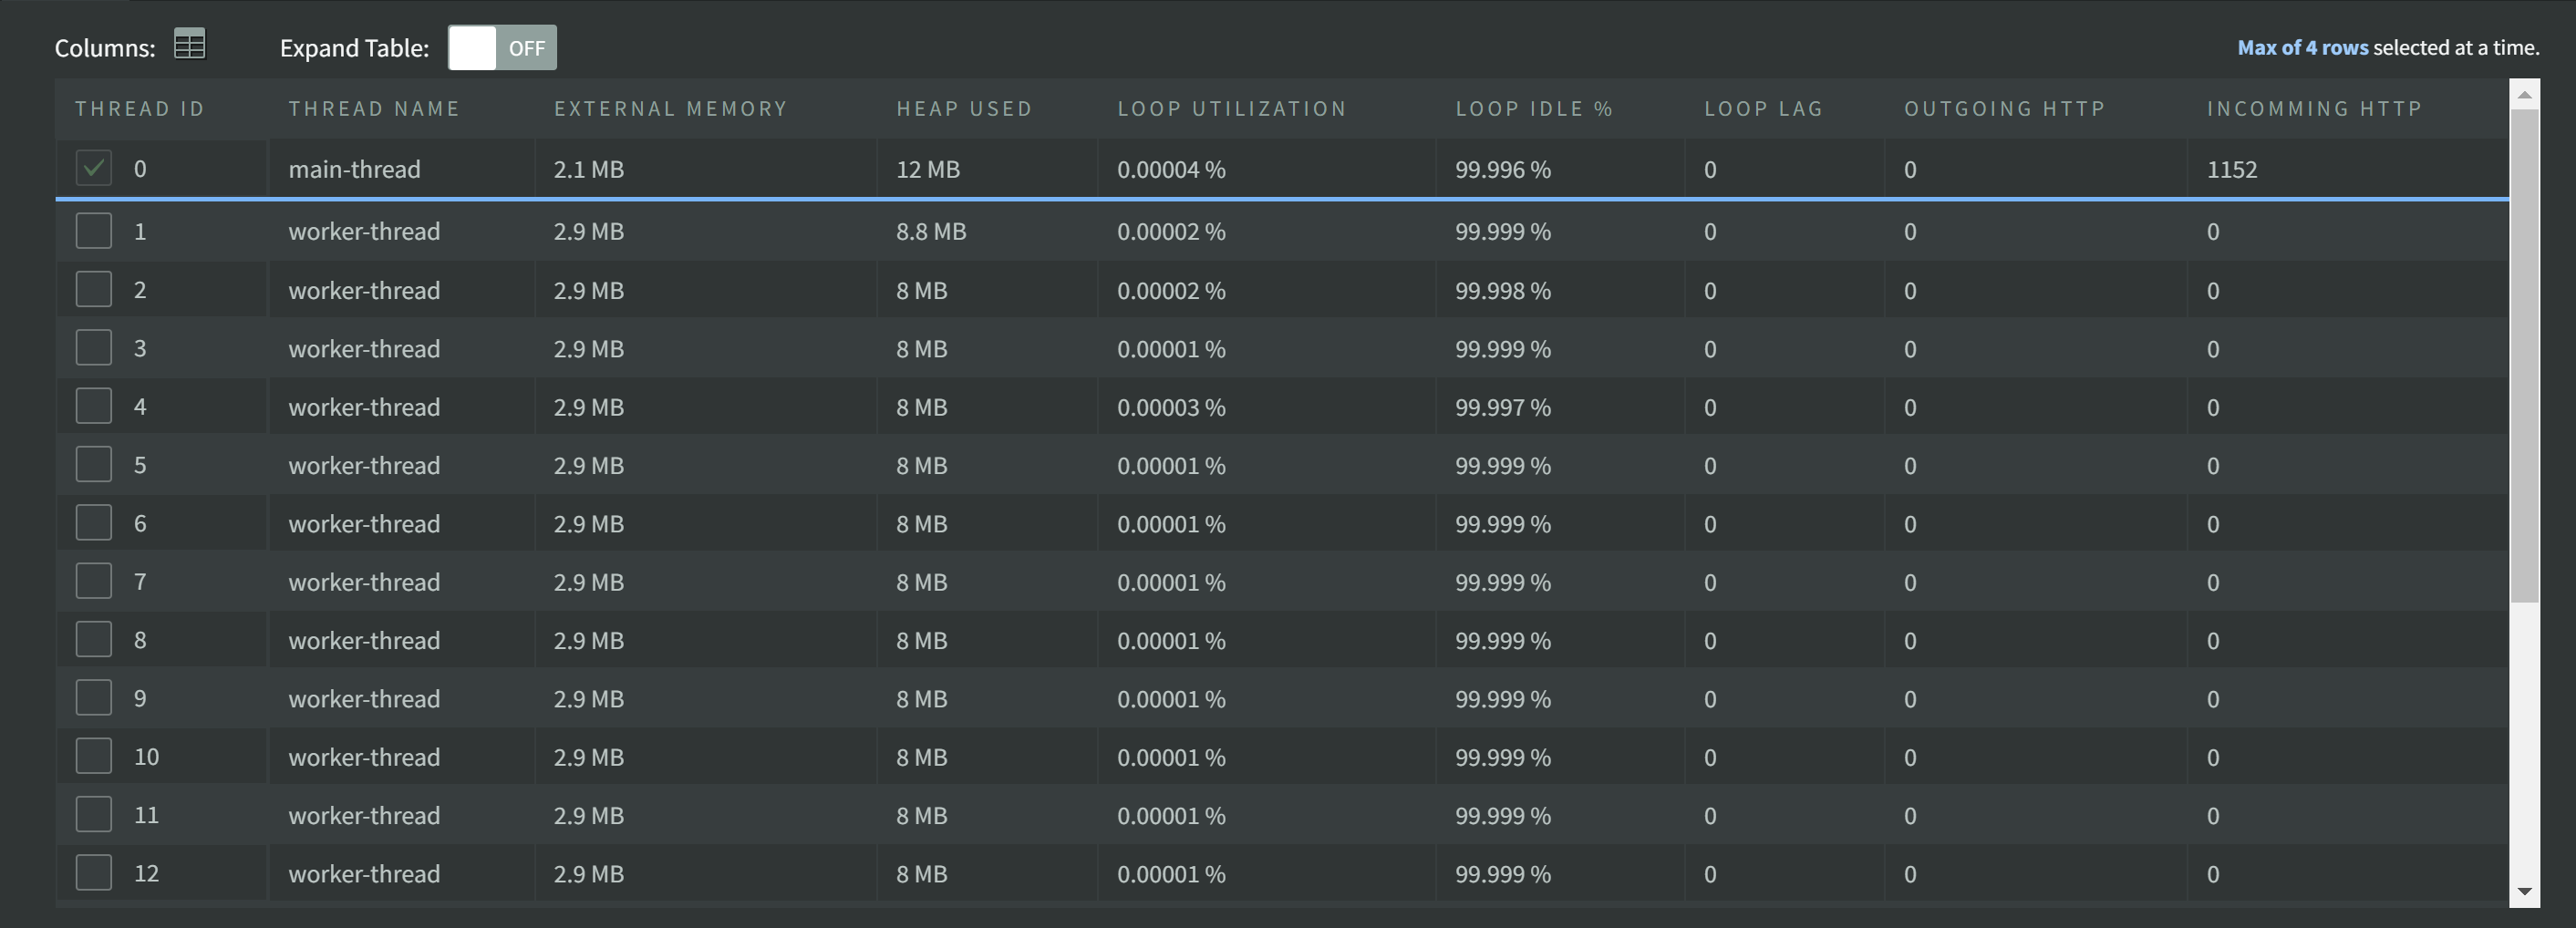
If the results table of a Threads List is over 12 records, it will have an internal scrollbar. If you'd prefer to see all of the list expanded, click the Expand Table switch to remove this viewing window and show all entries.
