Filter Bar
The Global Filter bar has become the centerpiece of N|Solid 6.0 and is shown on and controls the contents of every view in the N|Solid UI. It allows you to rapidly search through your data and save any view you create, and even create alerts that can trigger if any processes match your filter criteria.
Global Filter Bar Basics
The default state of the Filter Bar matches all processes (the Filter field is empty) at the current point in time (the Date Range selection is empty).

The Filter Bar can be used to narrow the contents of whatever section the main portion of the N|Solid UI is showing below the Filter Bar. Here I am restricting the results to a single Application.

When multiple filters are present, each is combined with the AND operator, narrowing the results to processes that match ALL entered criteria. Here we are showing all processes of a specific Application that have more than 5MB of JavaScript Heap Used.

Date ranges can be selected to query historical data. When empty, the Filter Bar results will only show currently connected N|Solid Processes. If a date range is specified, it will extract data for all processes matching the Filter Bar that may have been alive during that time, whether or not they are still connected or live.

When using the Date Range selector, the results may contain a mixture of dead processes and live processes.
Using the Filter Modal
Selecting Filters
Click into the Filter bar and you will open a box listing suggested filters.
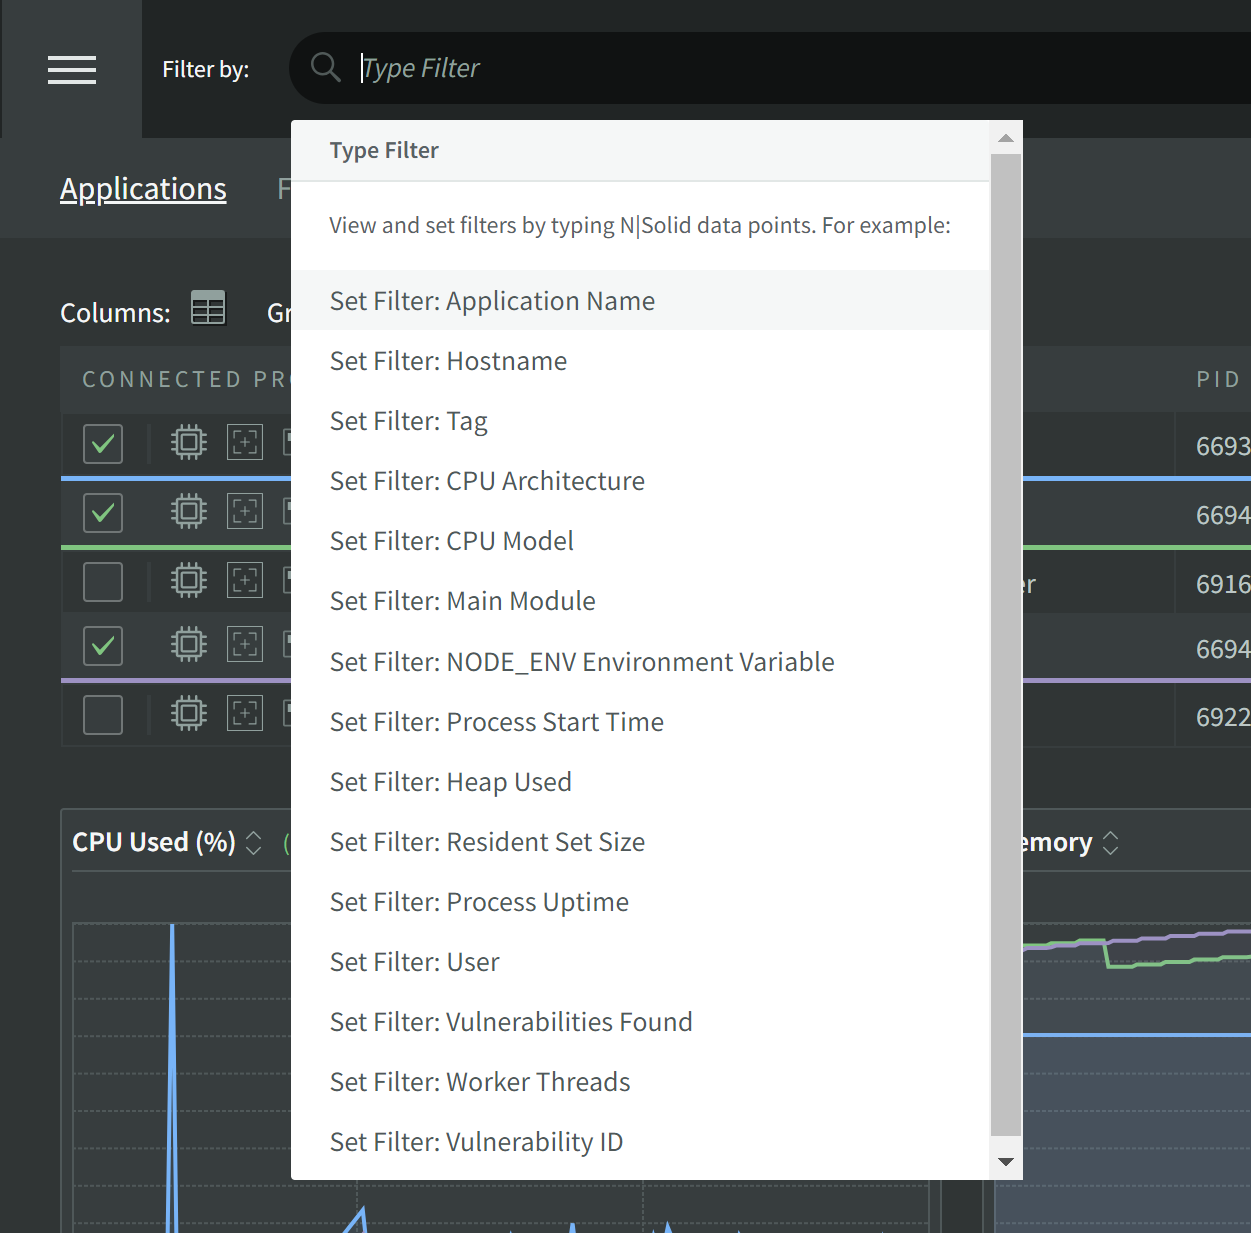 To add a filter, select a listed Filter to open the Filter Modal. Use the plus icon to add one of the options to the filter set.
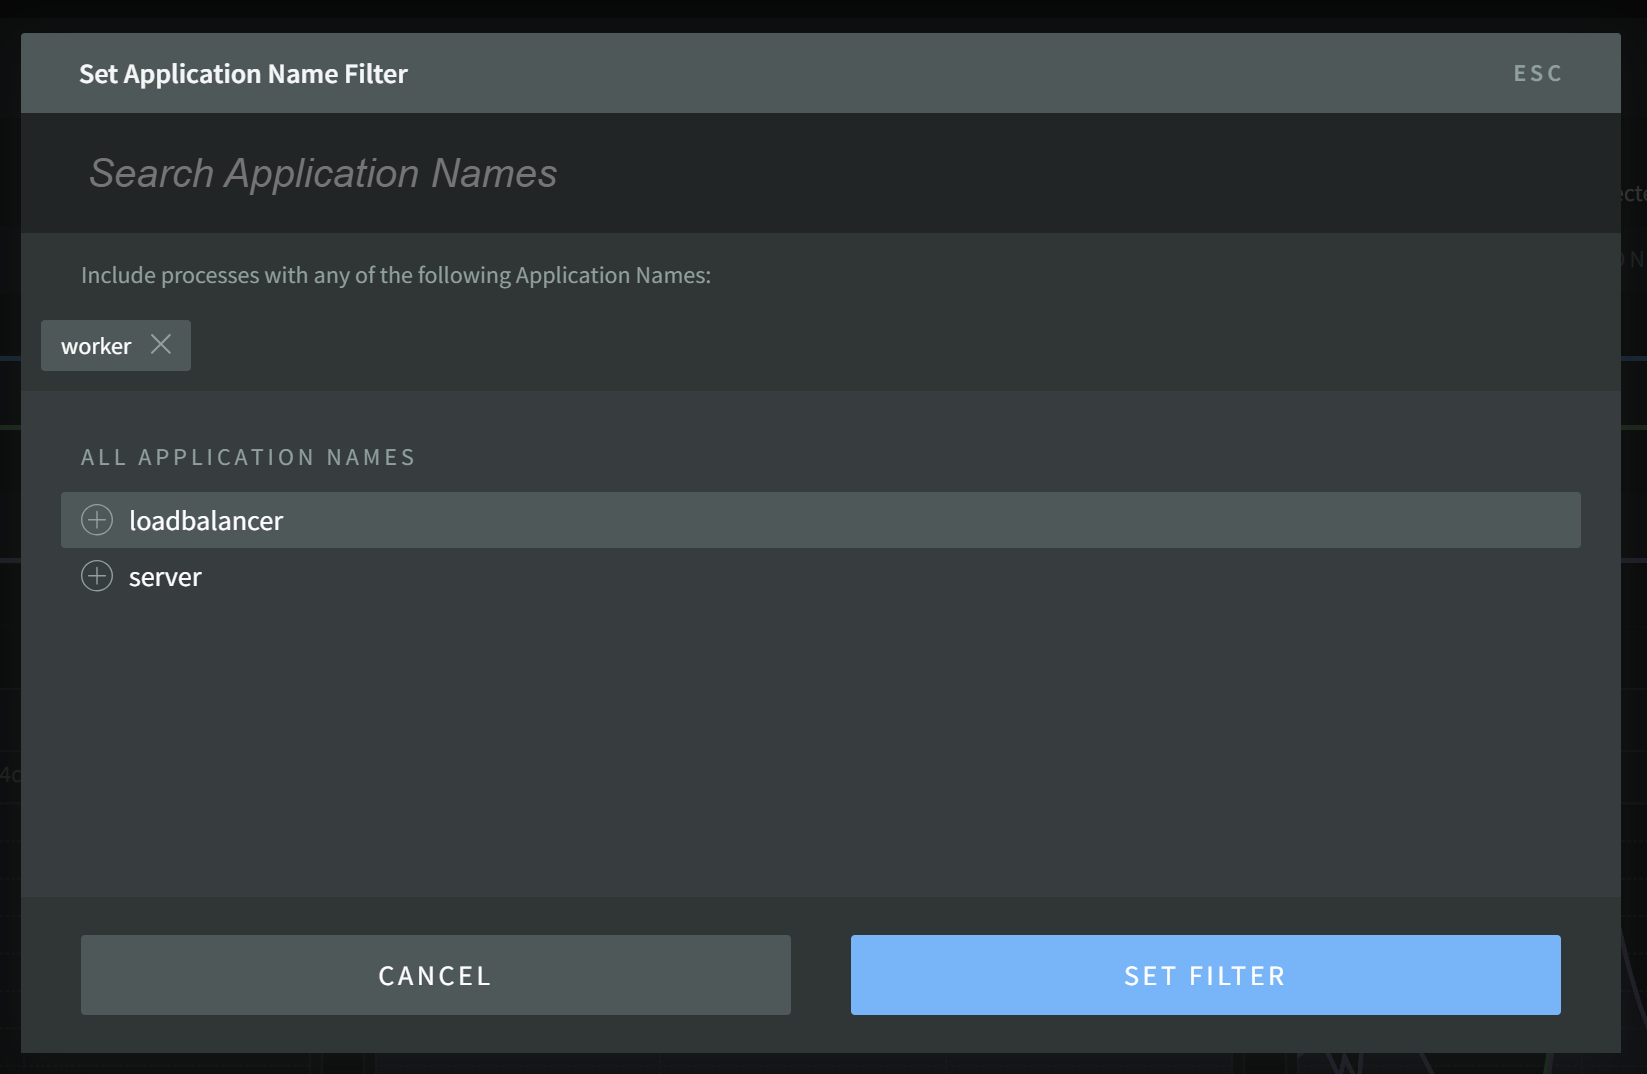
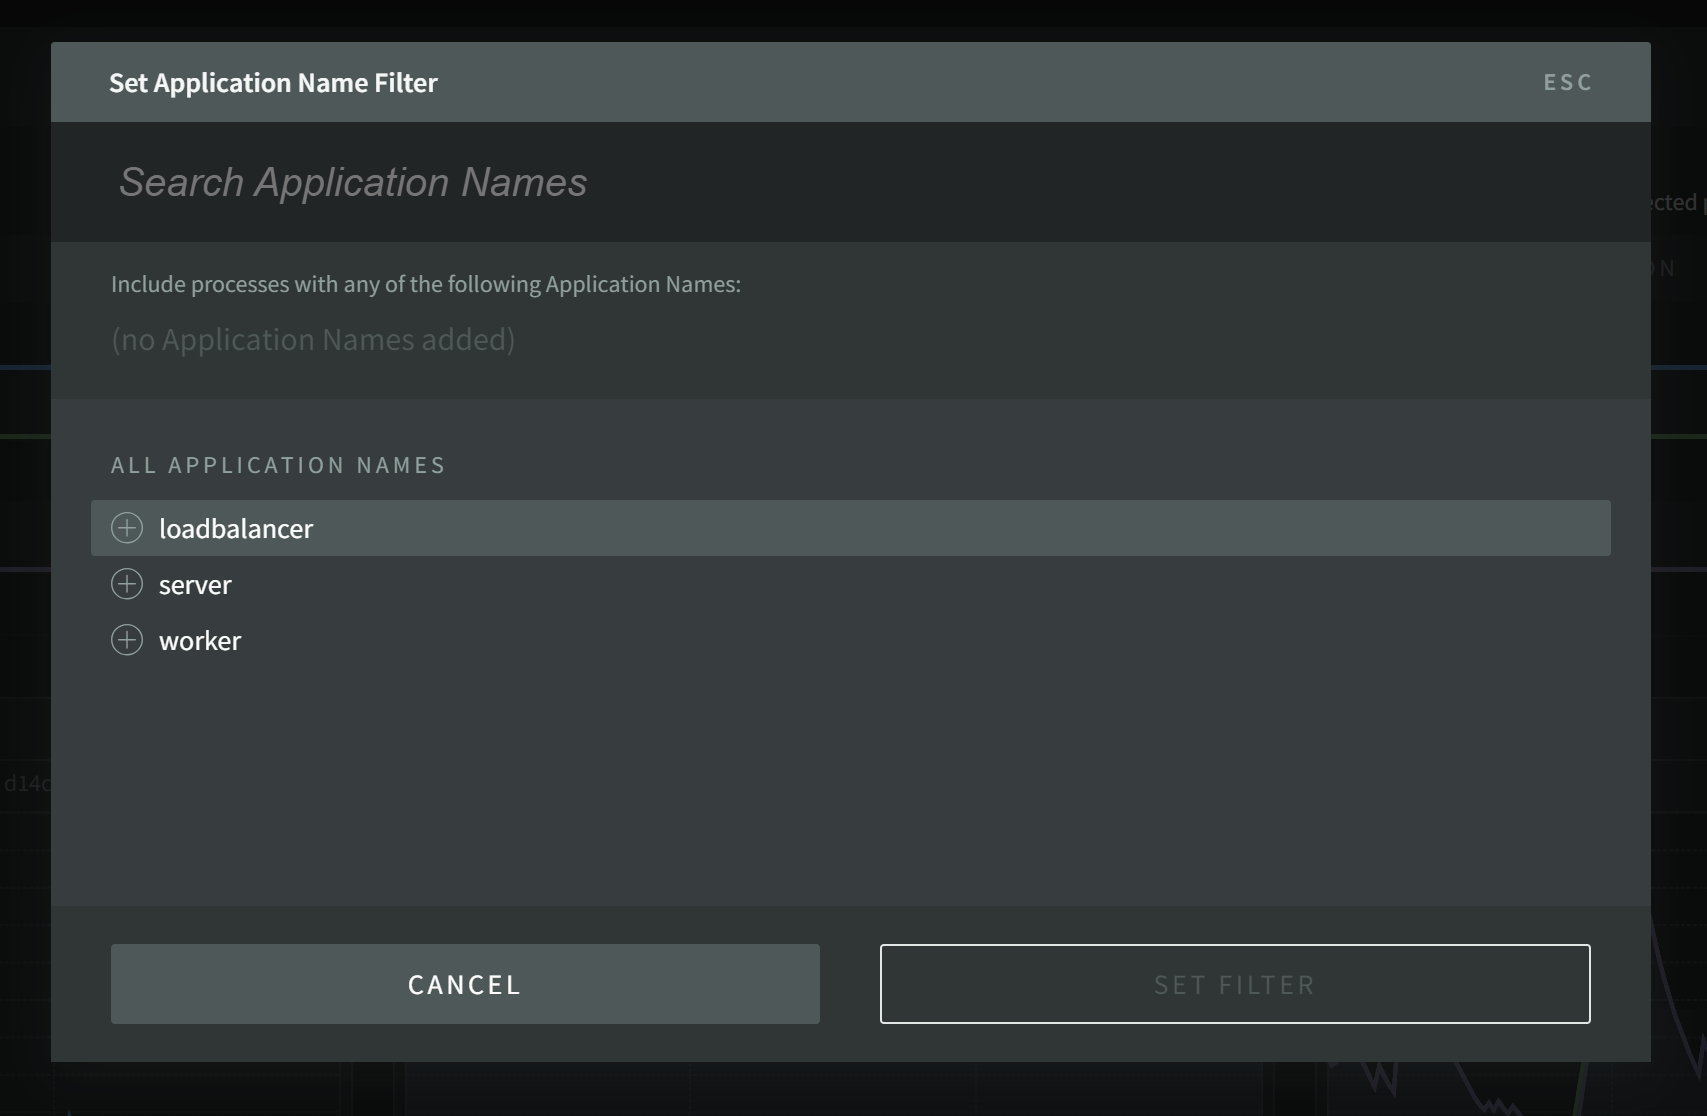 Some parameters allow you to select multiple options of the same filter to OR those values. Here I have selected one Appname--any in the top will be shown, any at the bottom will not.
Start typing to narrow the parameter options to those matching what you type.
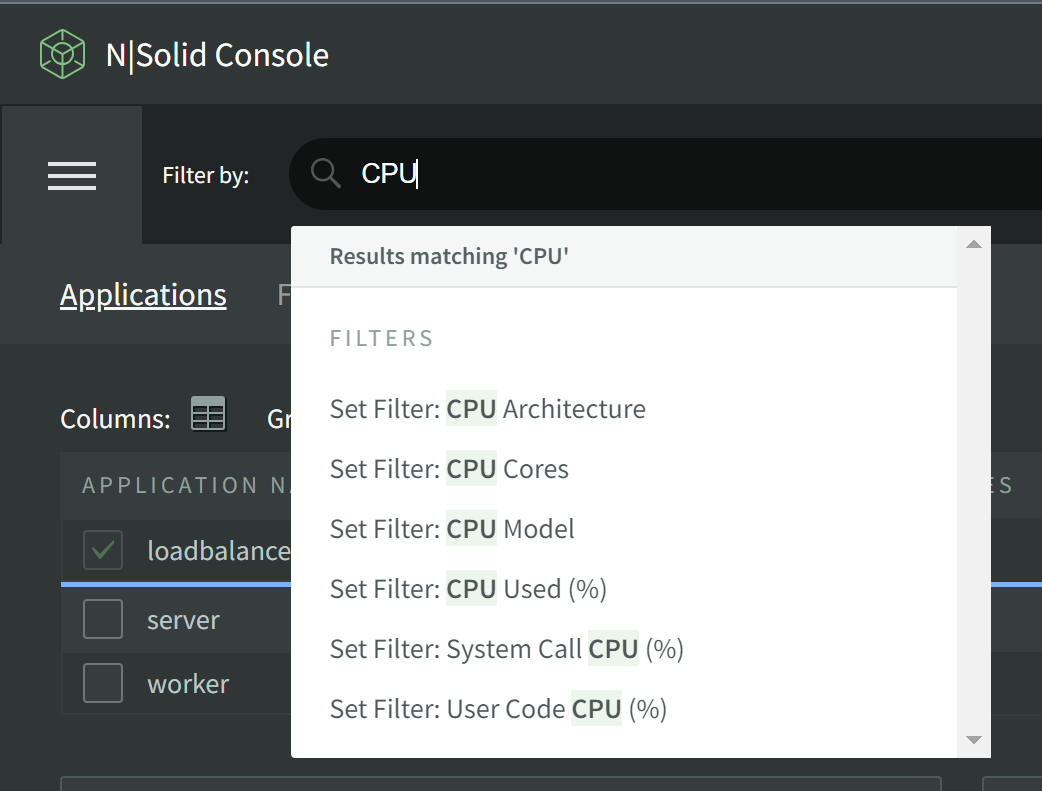 Data fields will allow you to set logical operators to add a data filter.
 The result set will include any processes with at least one matching record combined with the rest of the Filter Bar and Date Range settings.

Using the Date Range tool
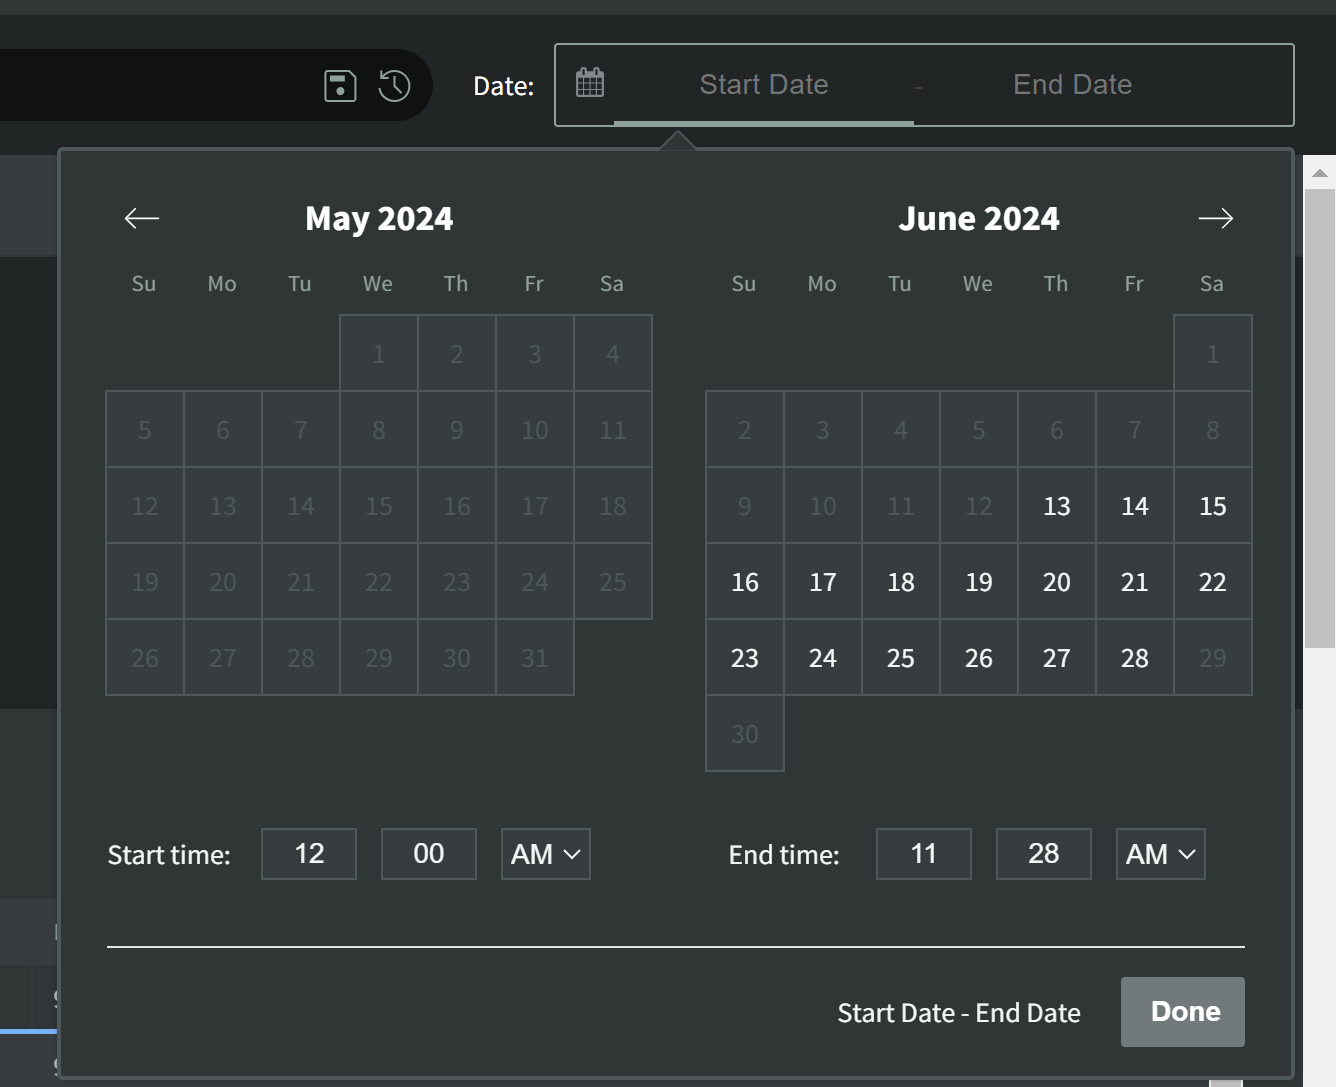
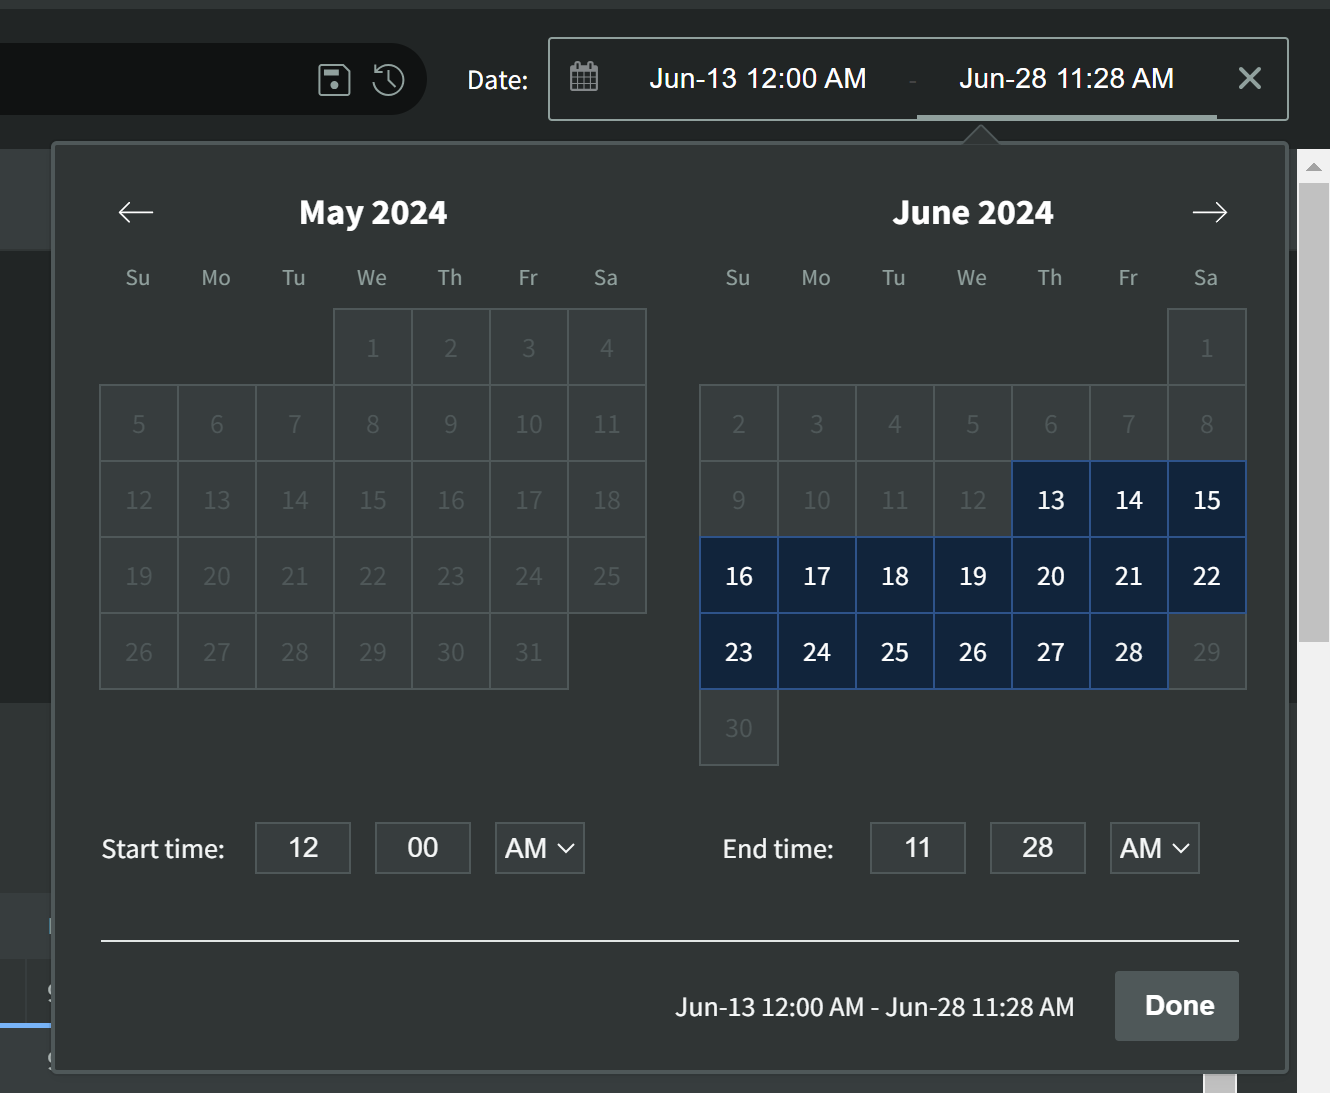
When querying historical data, the date range tool will show you what date ranges have data available to query. Click on the date(s) in question and adjust the time ranges and click "Done" to set the filter.
Saving Filters
Click the icon to save the current filter for future recall or to create a recurring Alert.


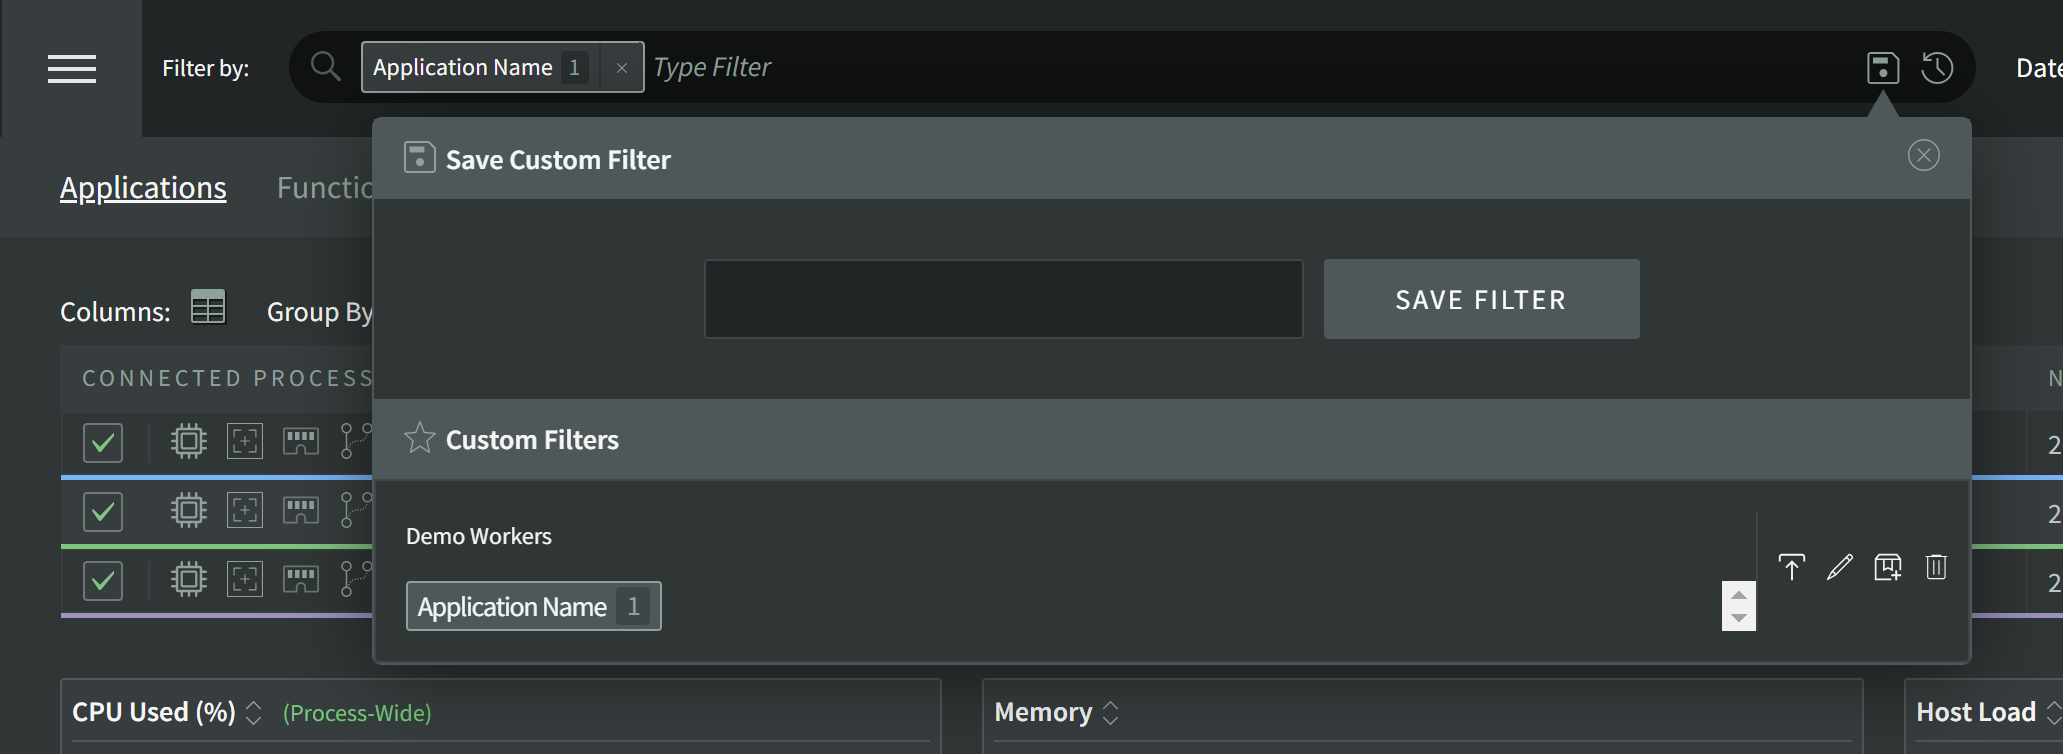
There are four icons shown on the far right of the list of Saved Filters.
The first Loads this set of saved filter parameters into the global Filter Bar.
Pressing the Pencil-shaped icon will switch to edit mode, allowing you to rename or change the filter parameters.

The box icon will allow you to create Actions such as Alerts that will can be sent to whenever a process lingers in this filter criteria.
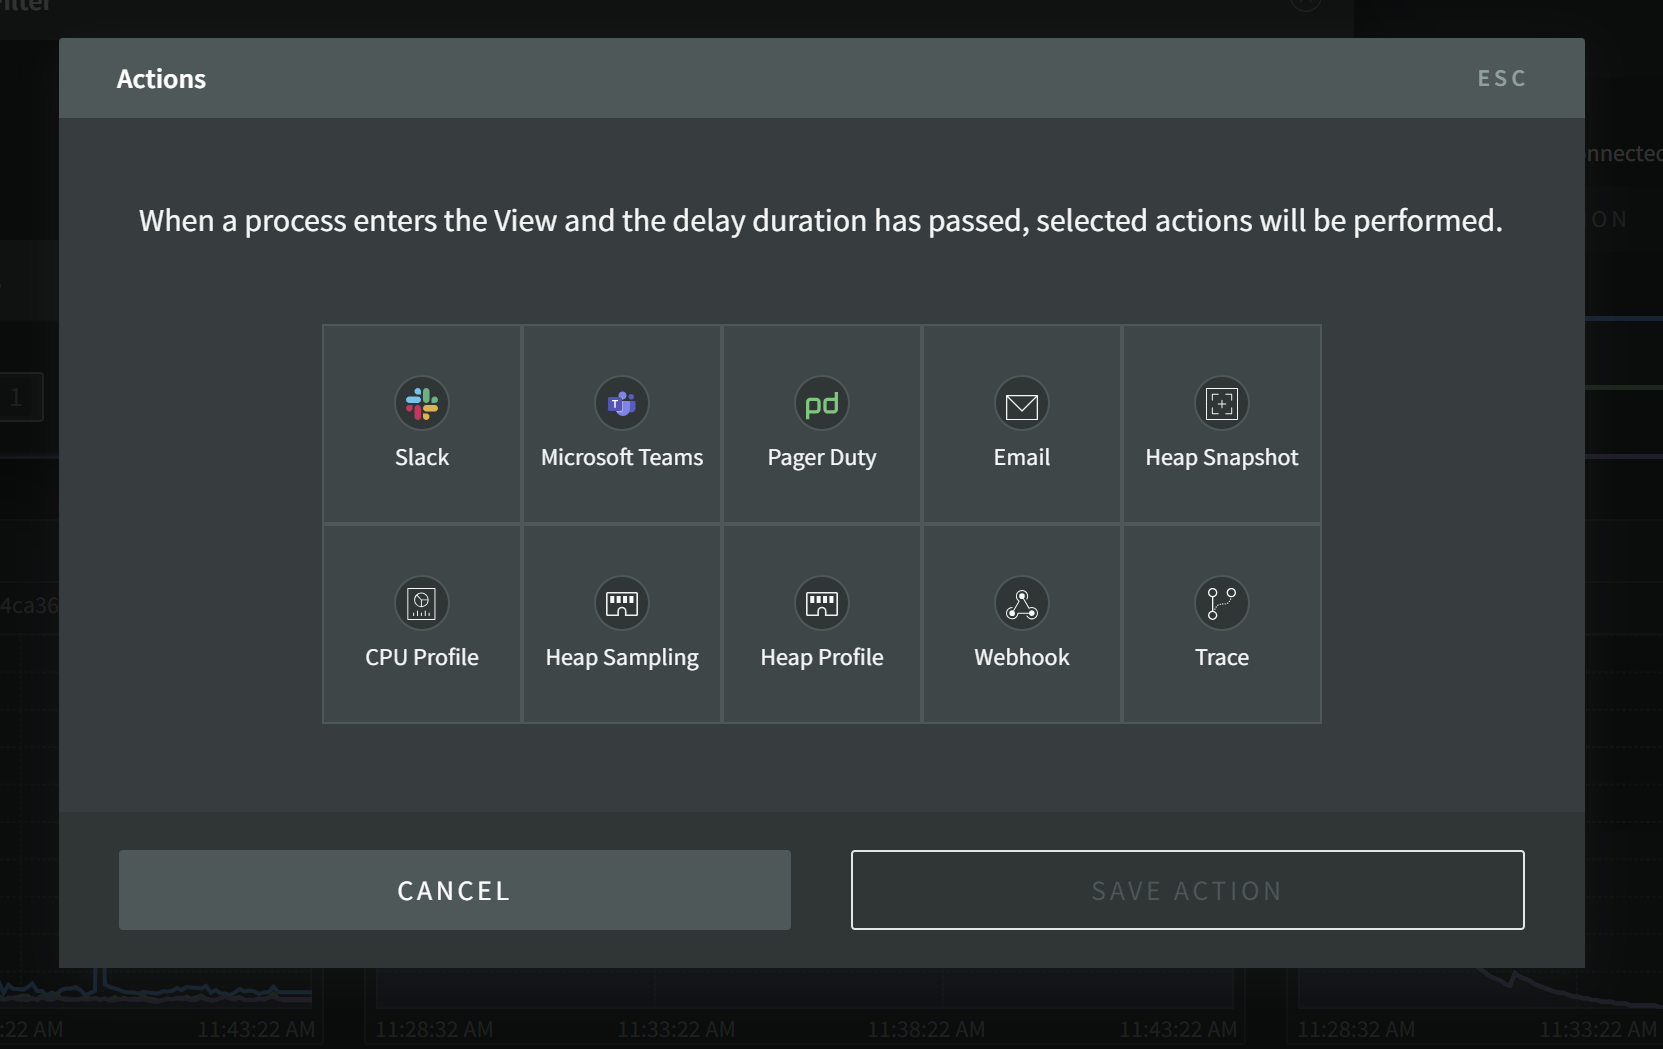
There are many options for Actions to take, each with their own various settings for you to explore.
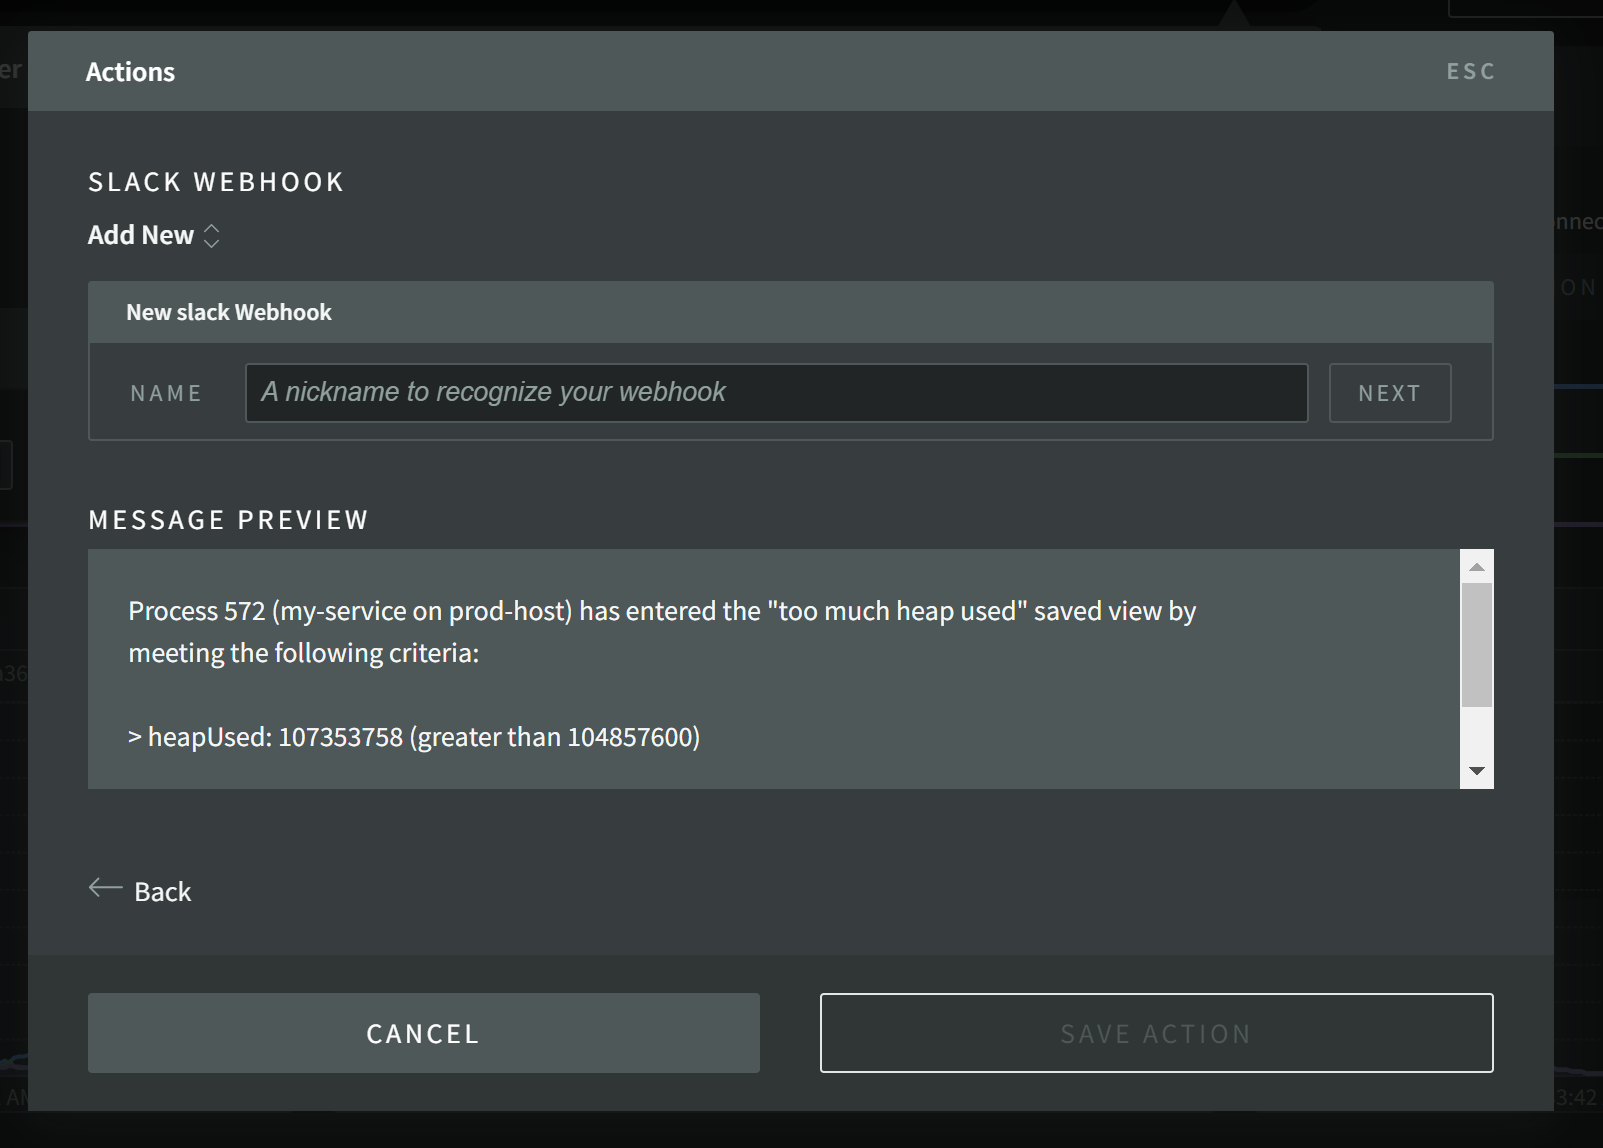
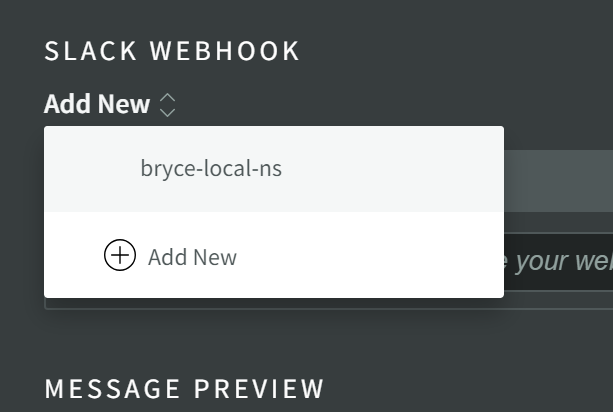
Actions you have created in the past can be reused by other Saved Filters, allowing you to route multiple Actions to the same endpoints.
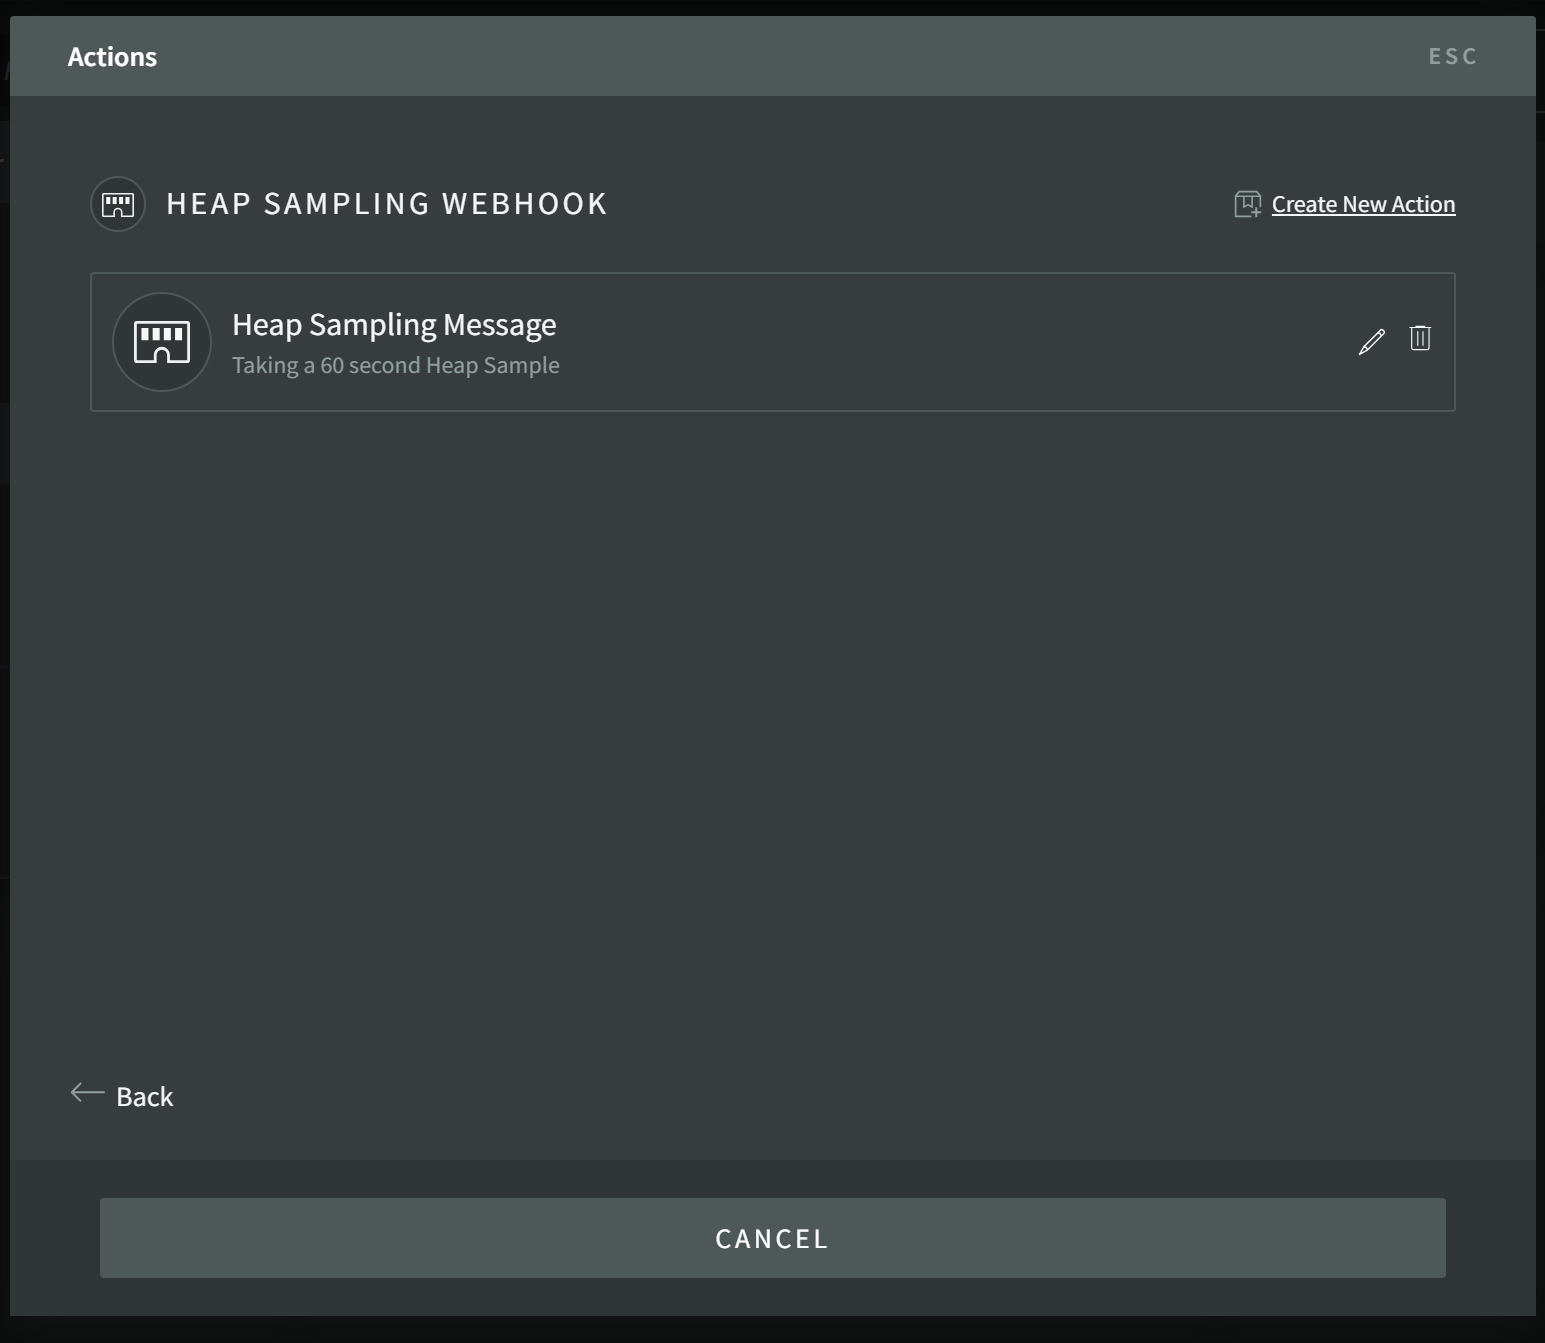
Saved Filters with Actions will have additional icons that allow you to view and modify actions configured for this saved filter.
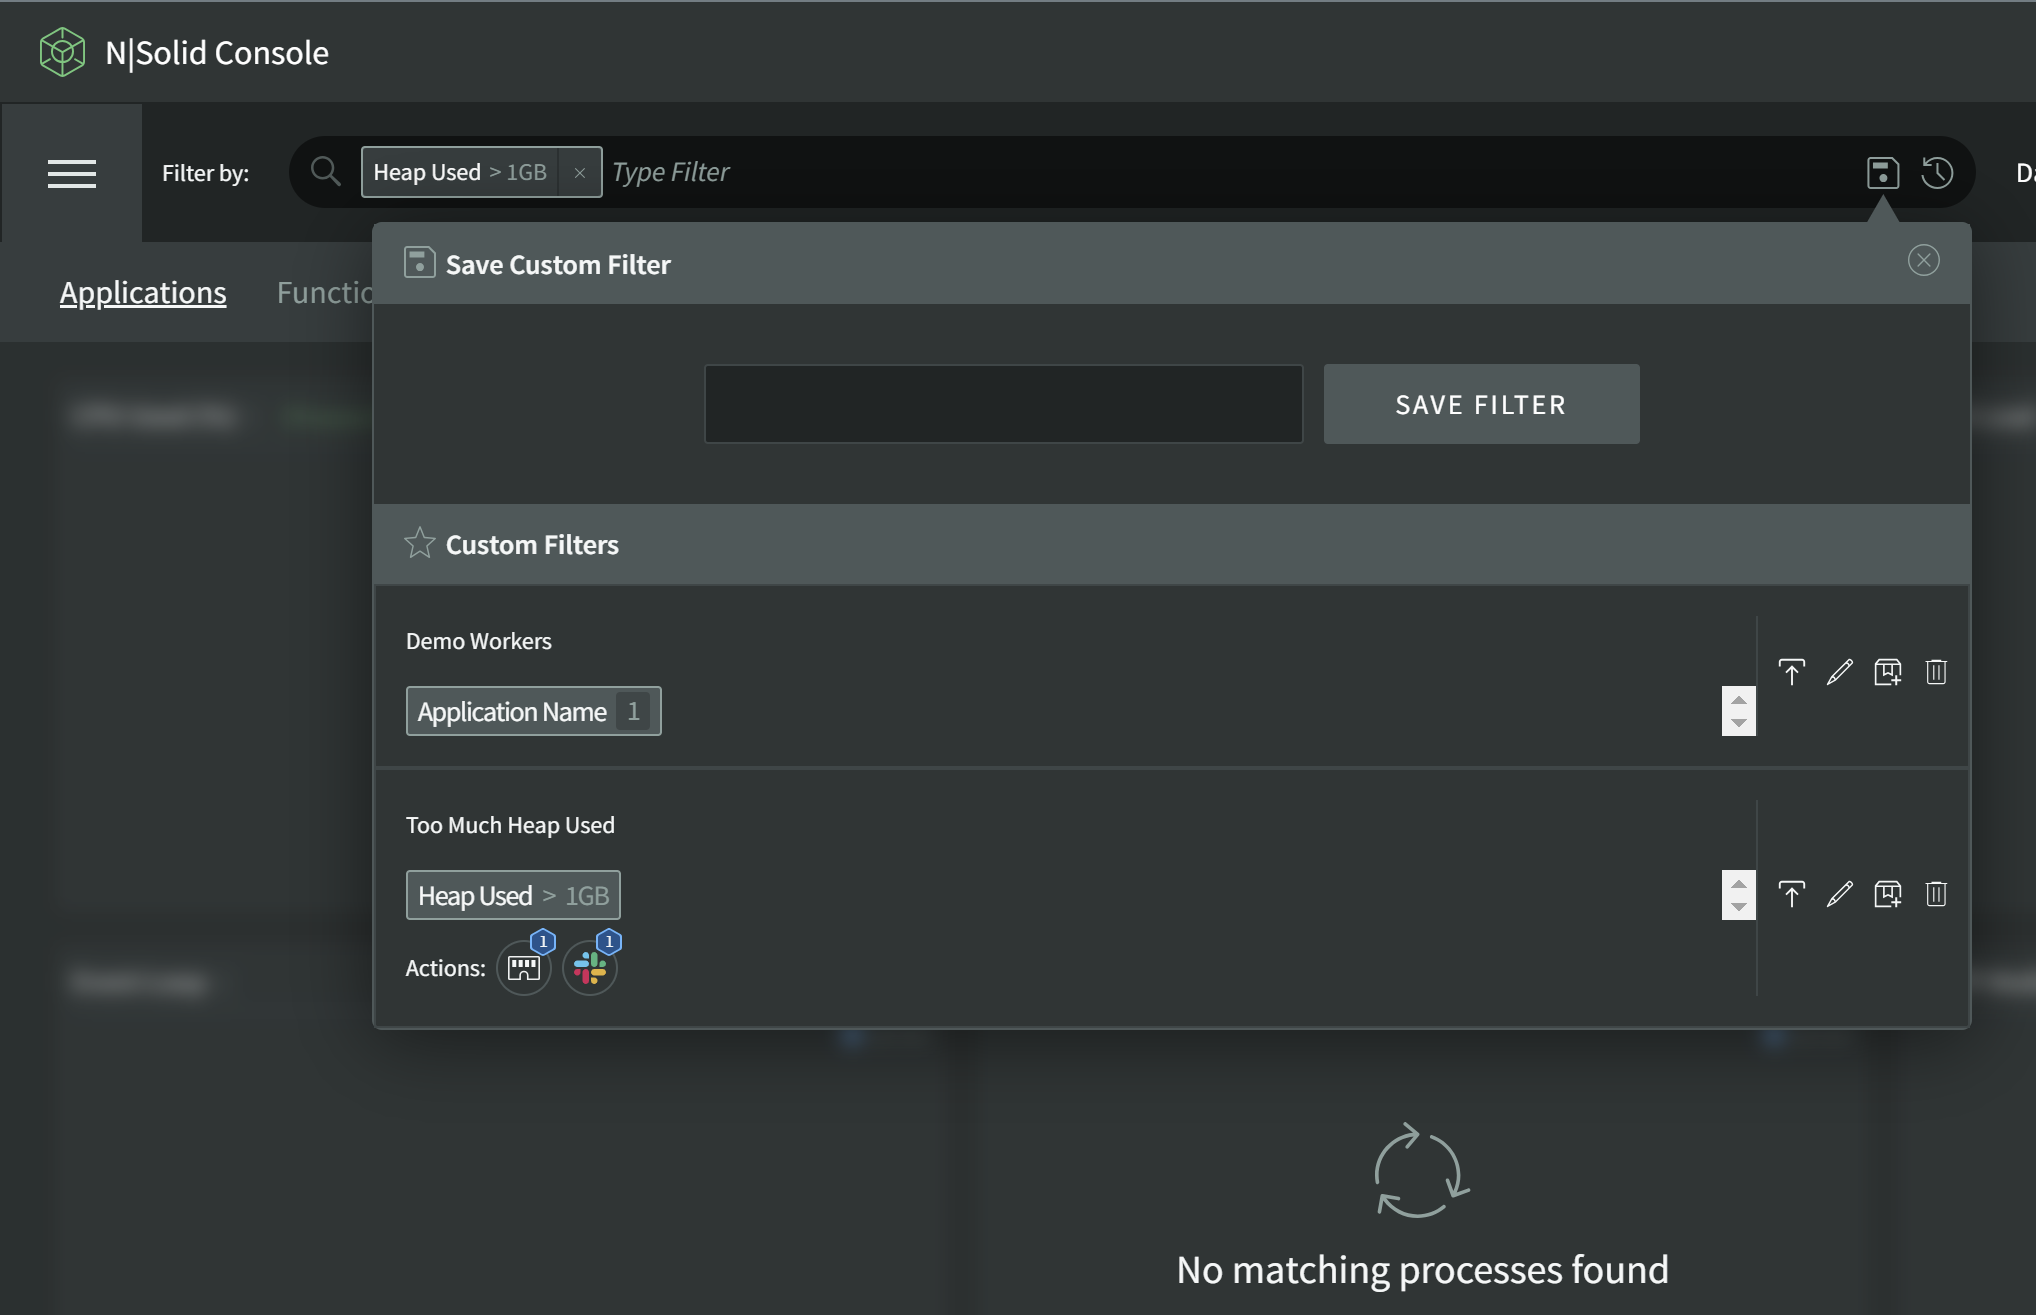
Clicking on the Actions will show the full set of configured actions.
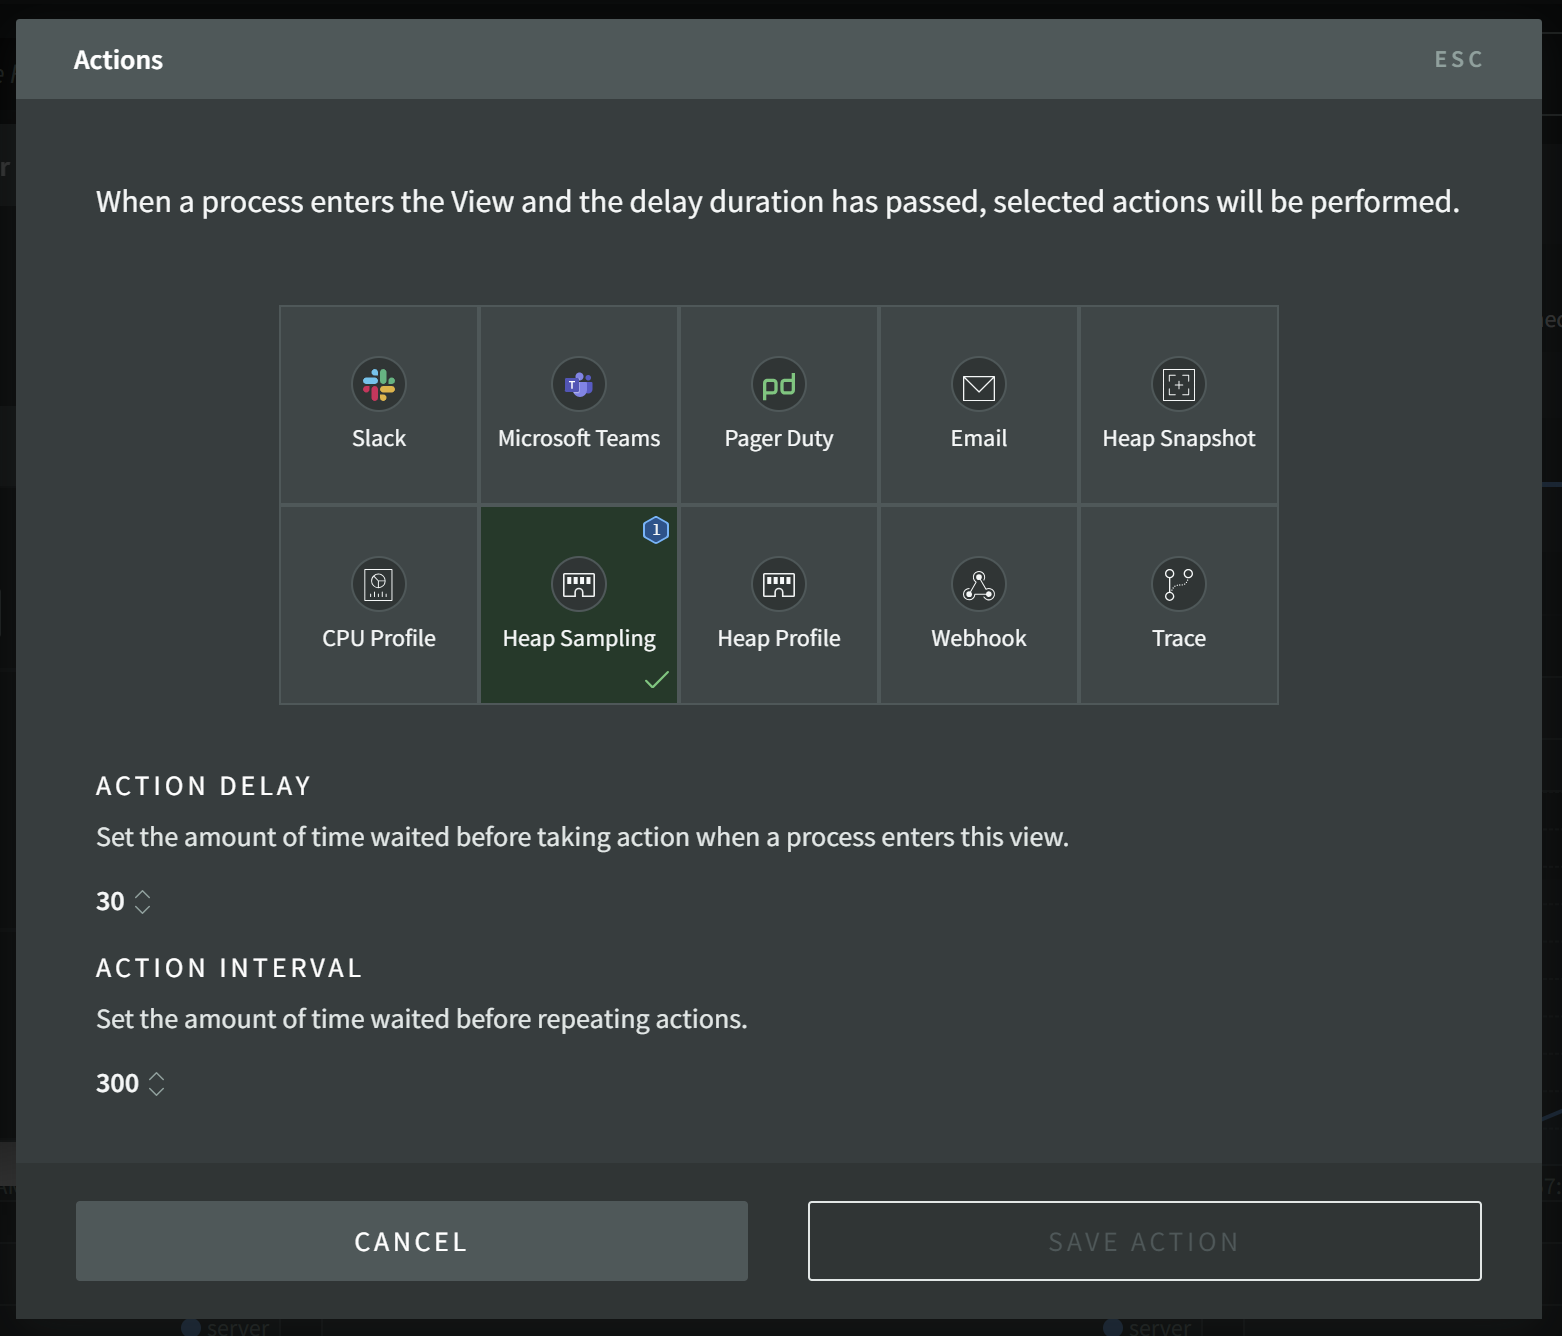
Clicking on the Box icon will allow you to configure the Delay and re-trigger Interval settings for the Actions you have configured. In this example, the process will have to match the filter for 30 seconds continuously for the Alert to trigger. After it triggers, it will not re-trigger for another 300 seconds (5 minutes).
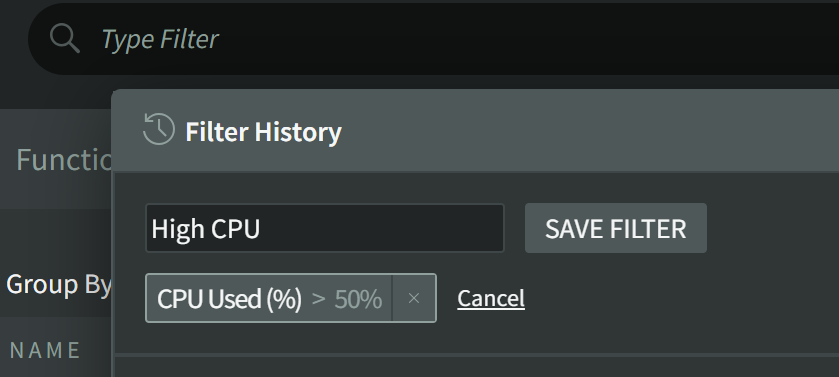
Filter History
Your recent filter history is available as well, allowing you to recall or save any recent filters you've found useful.
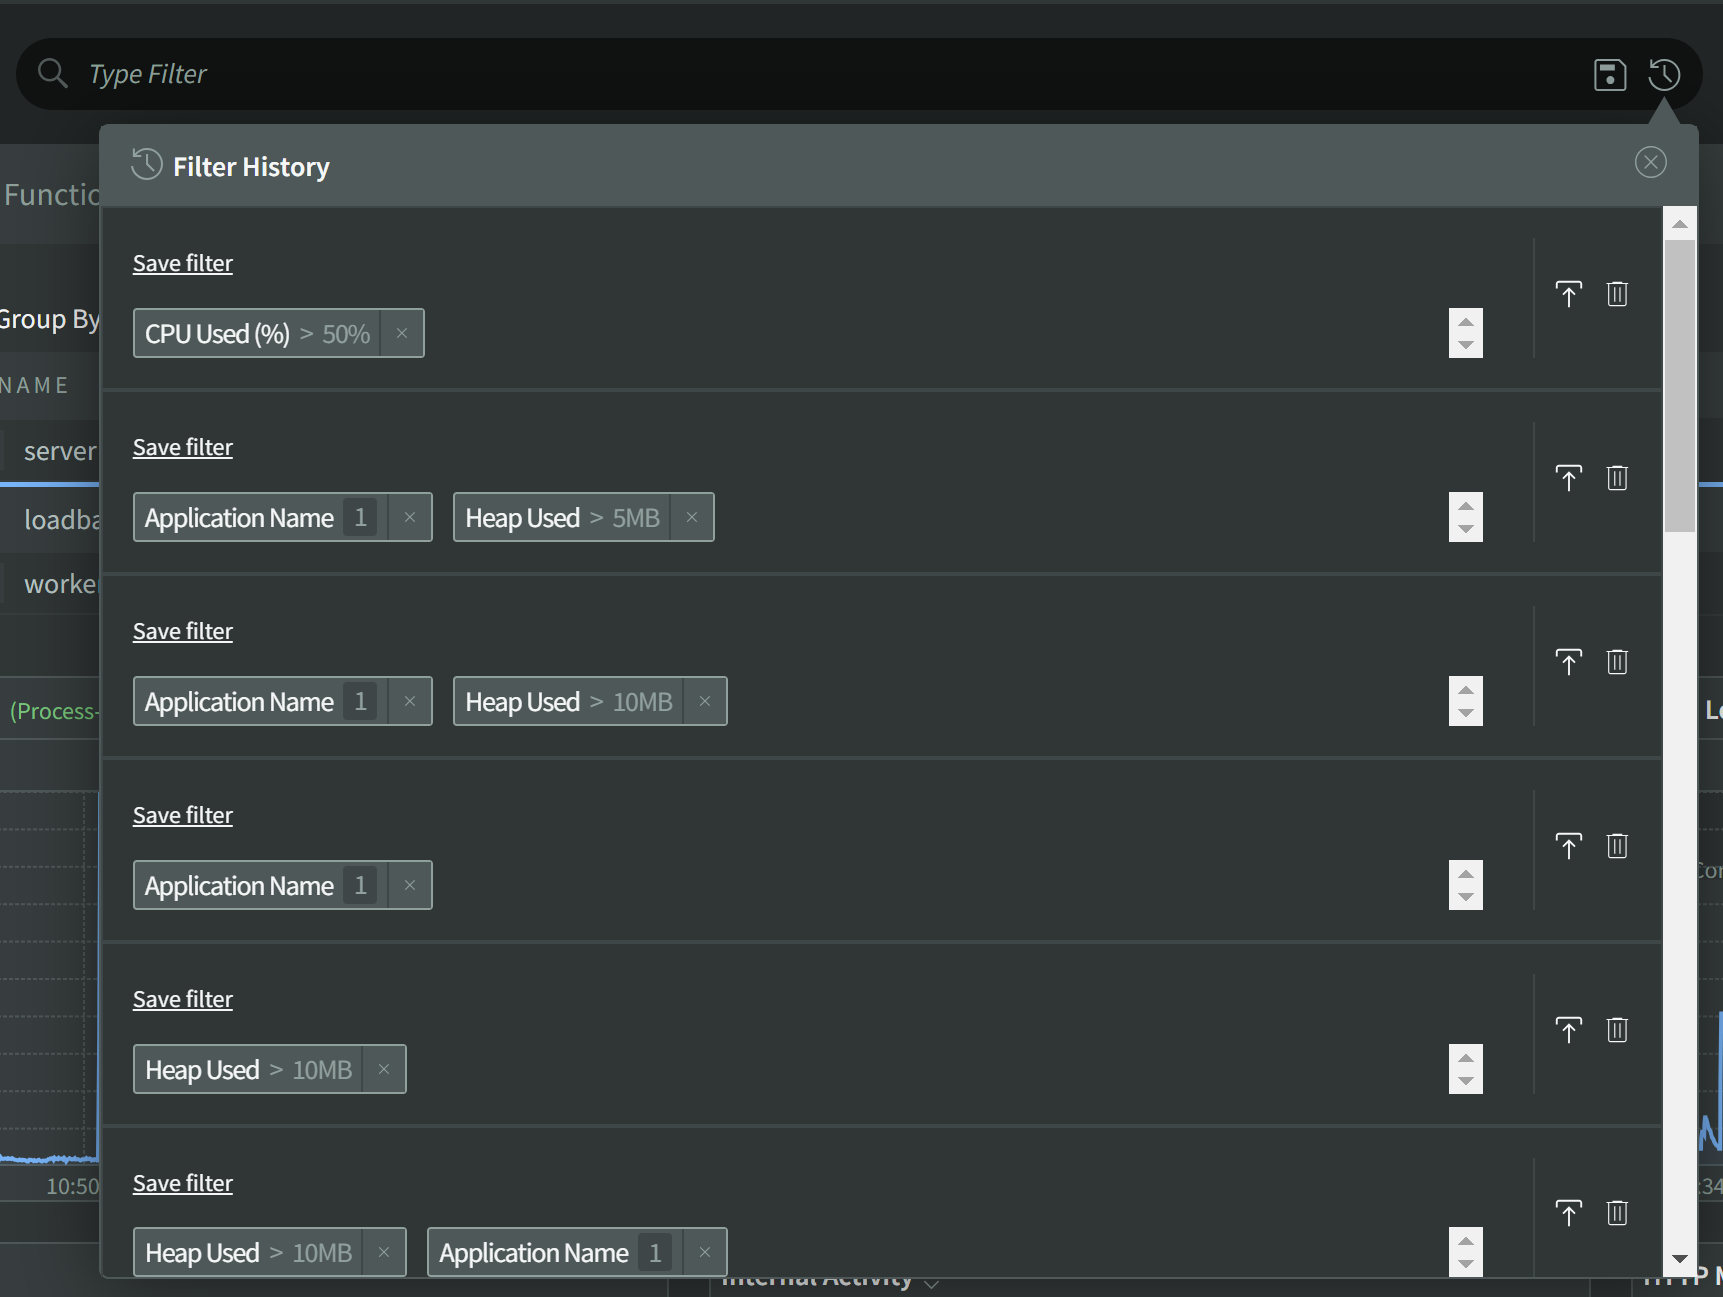
The icons on the right side of the filter history allow you to either Load this historical filter into the current Filter Bar, or to Delete this historical filter criteria set.
Historical Filters can also be retroactively found and saved for future recall or to create a saved Alert.
