Use OpenTelemetry
In this How To section, we'll discuss OpenTelemetry and how to use it to locate IO bottlenecks in your application.
HTTP Tracing
NodeSource has introduced Tracing support, a facility to gather information throughout the lifecycle of an HTTP/DNS/Other request. The collected information can be used for debugging latency issues, service monitoring, and more. This is a valuable addition for users interested in debugging request latency. Tracing traces user requests through a Node application, collecting data that can help find the cause of latency issues, errors, and other problems.
Enabling Tracing via N|S Console UI
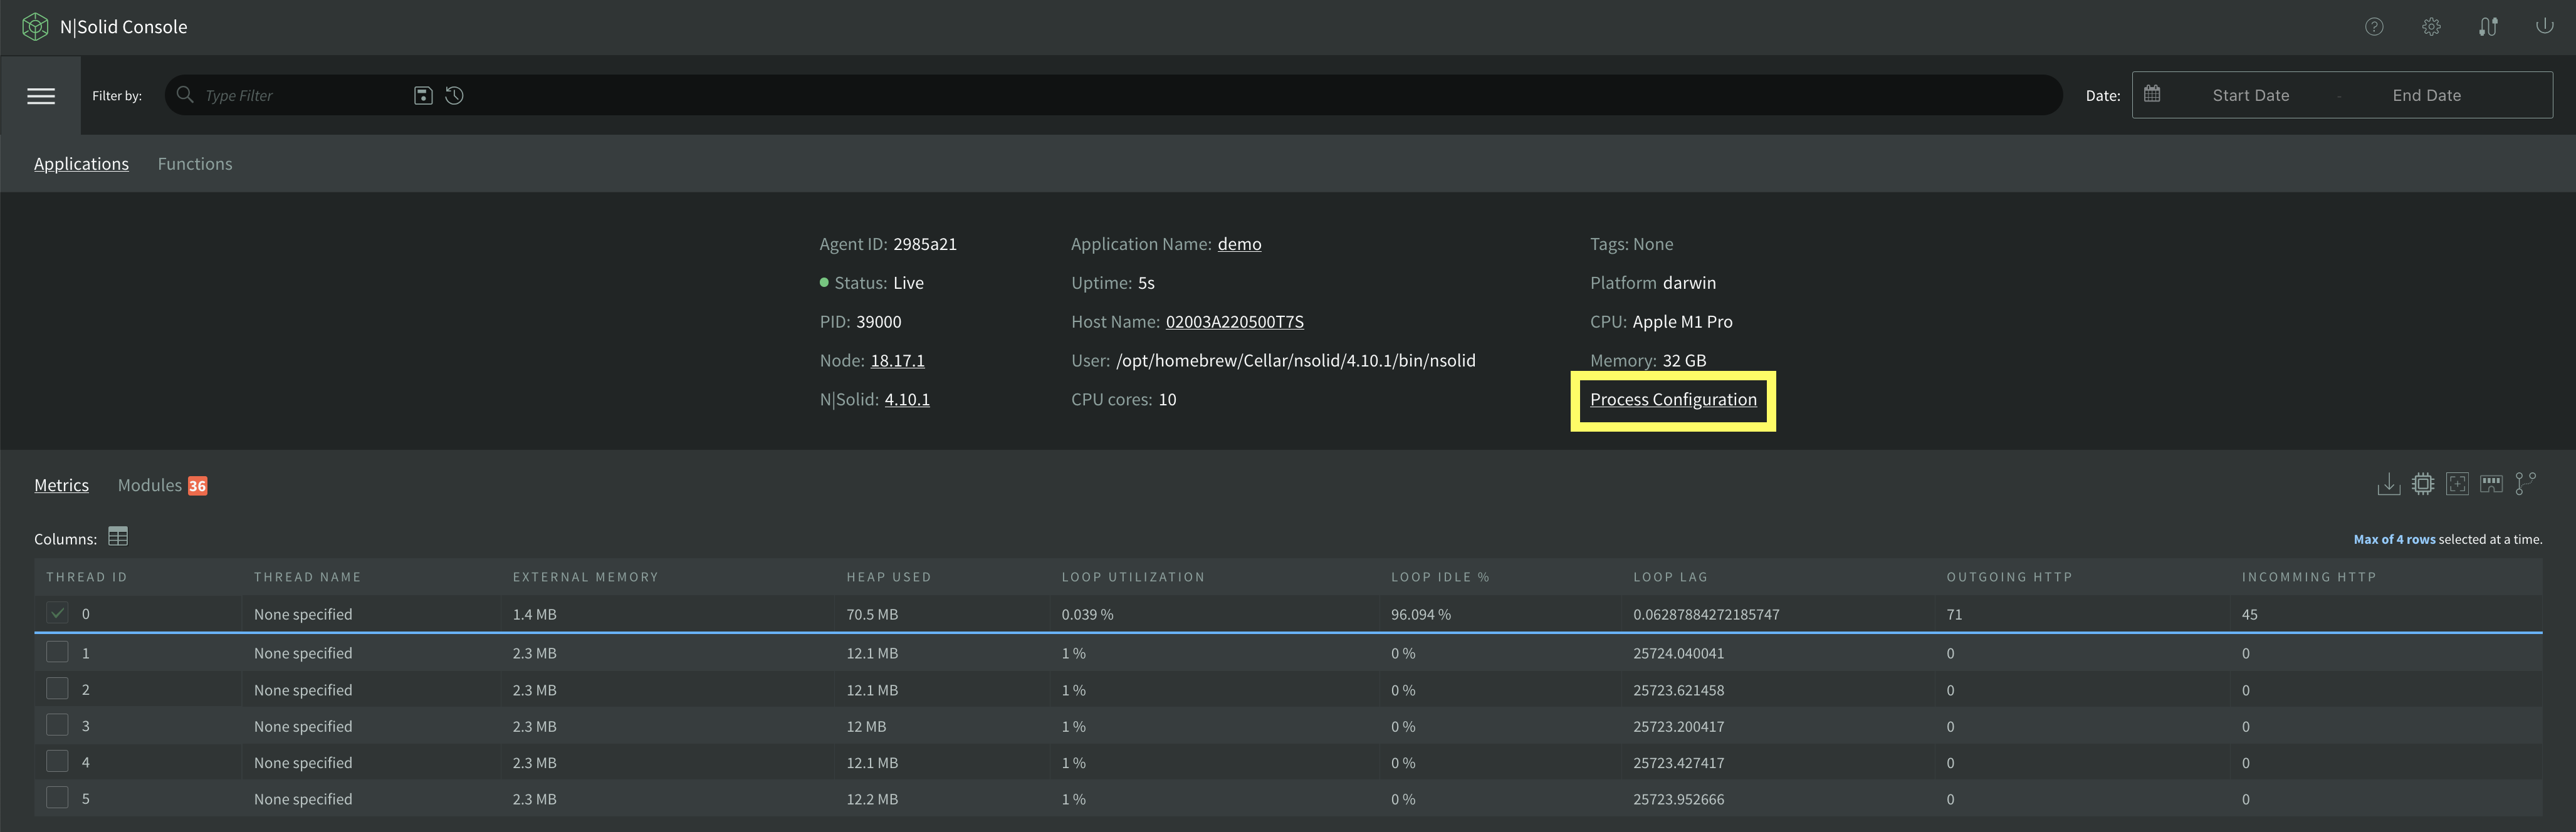
- Enter your process.
- Click on Process configuration.
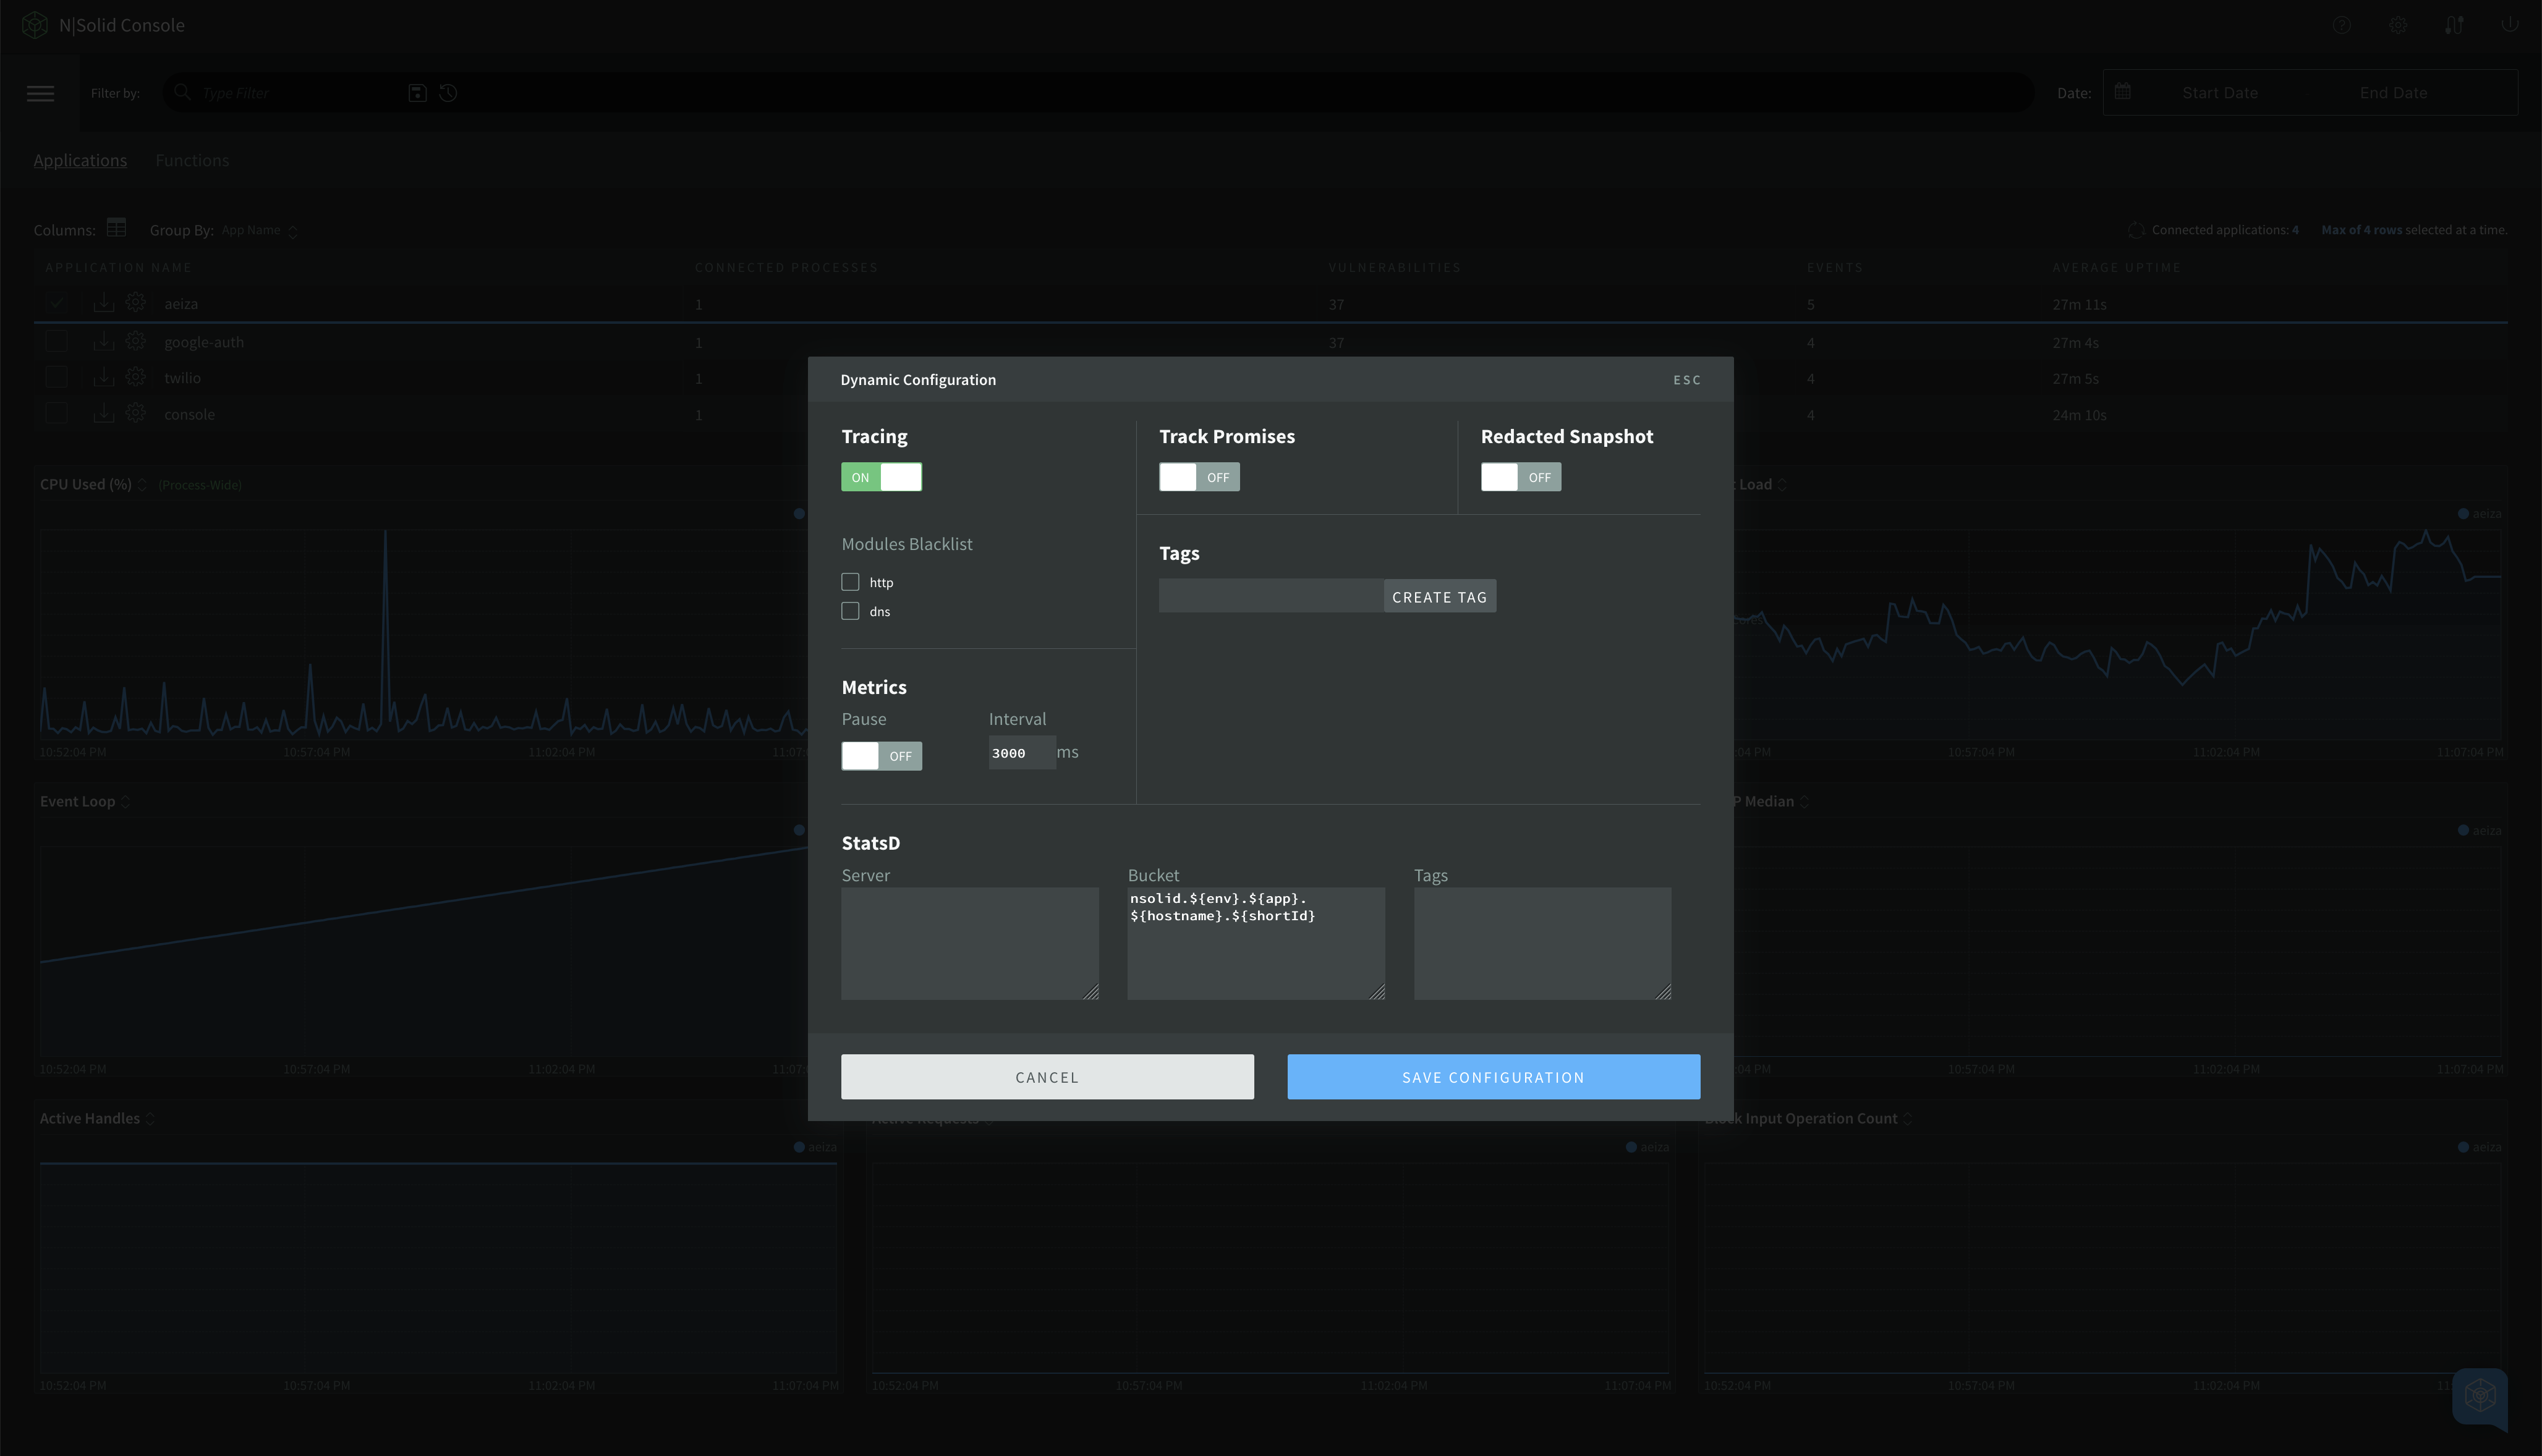
- Activate the toggle for Tracing.
Distributed Tracing UI
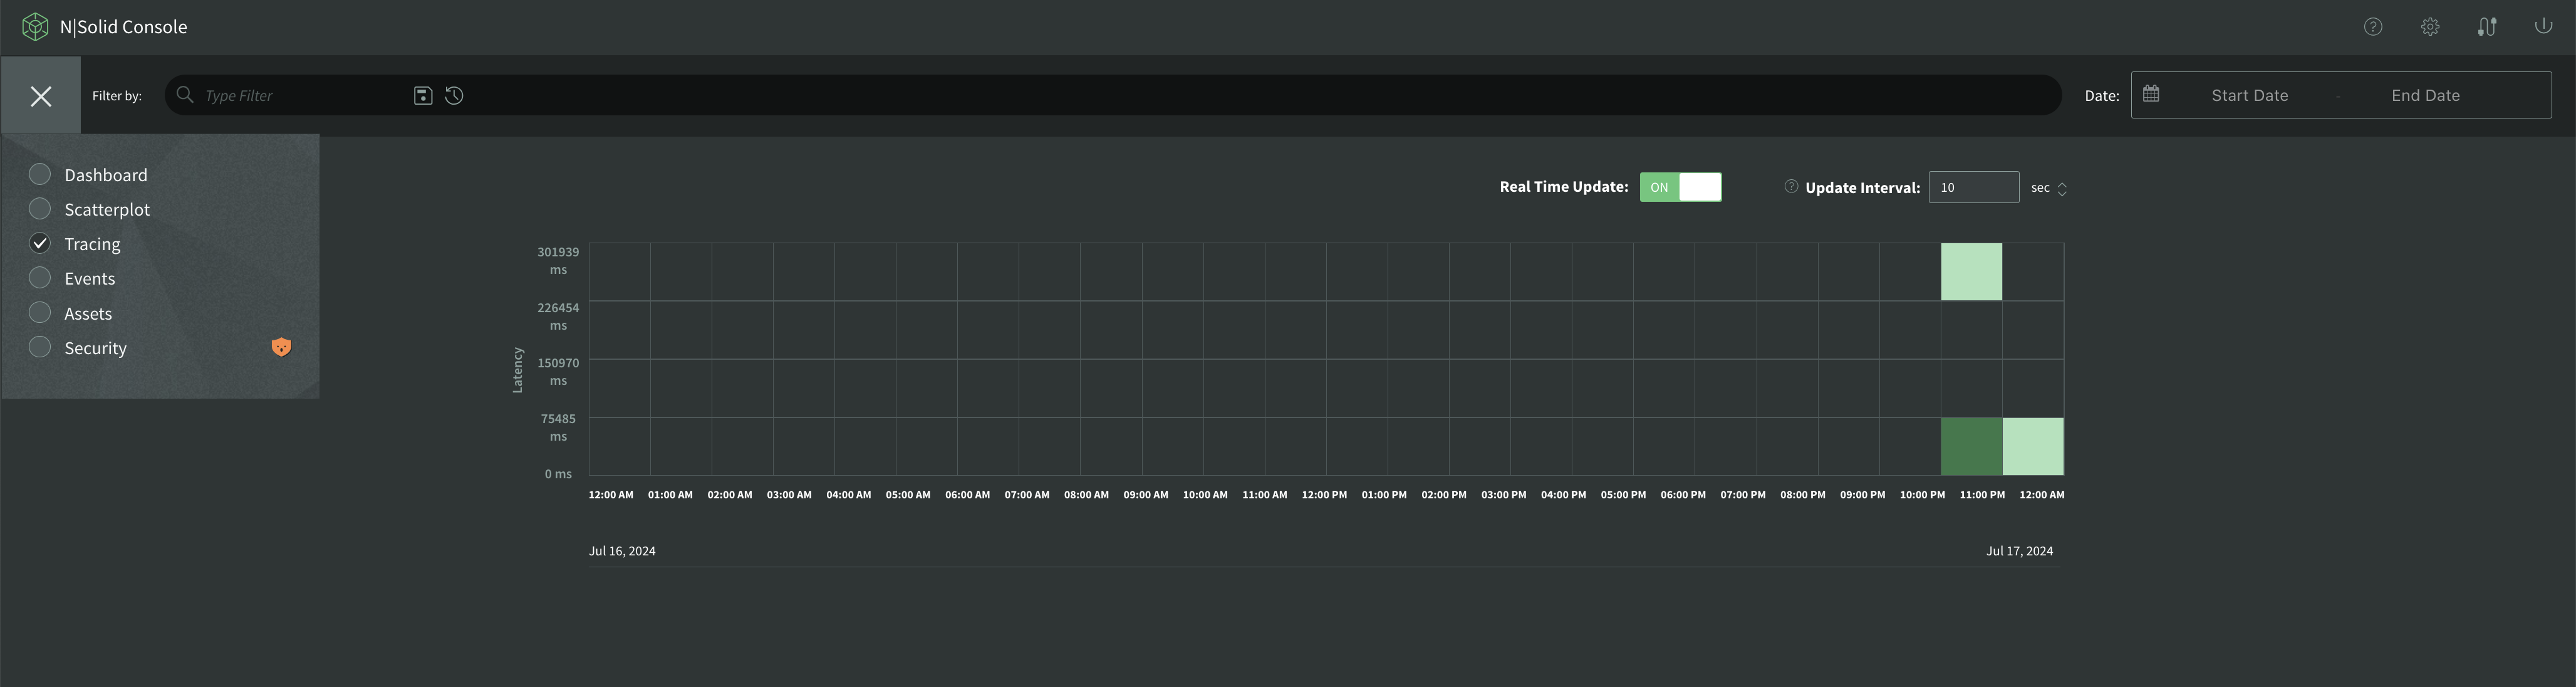
In the N|Solid Console, select Tracing from the global filter menu bar.
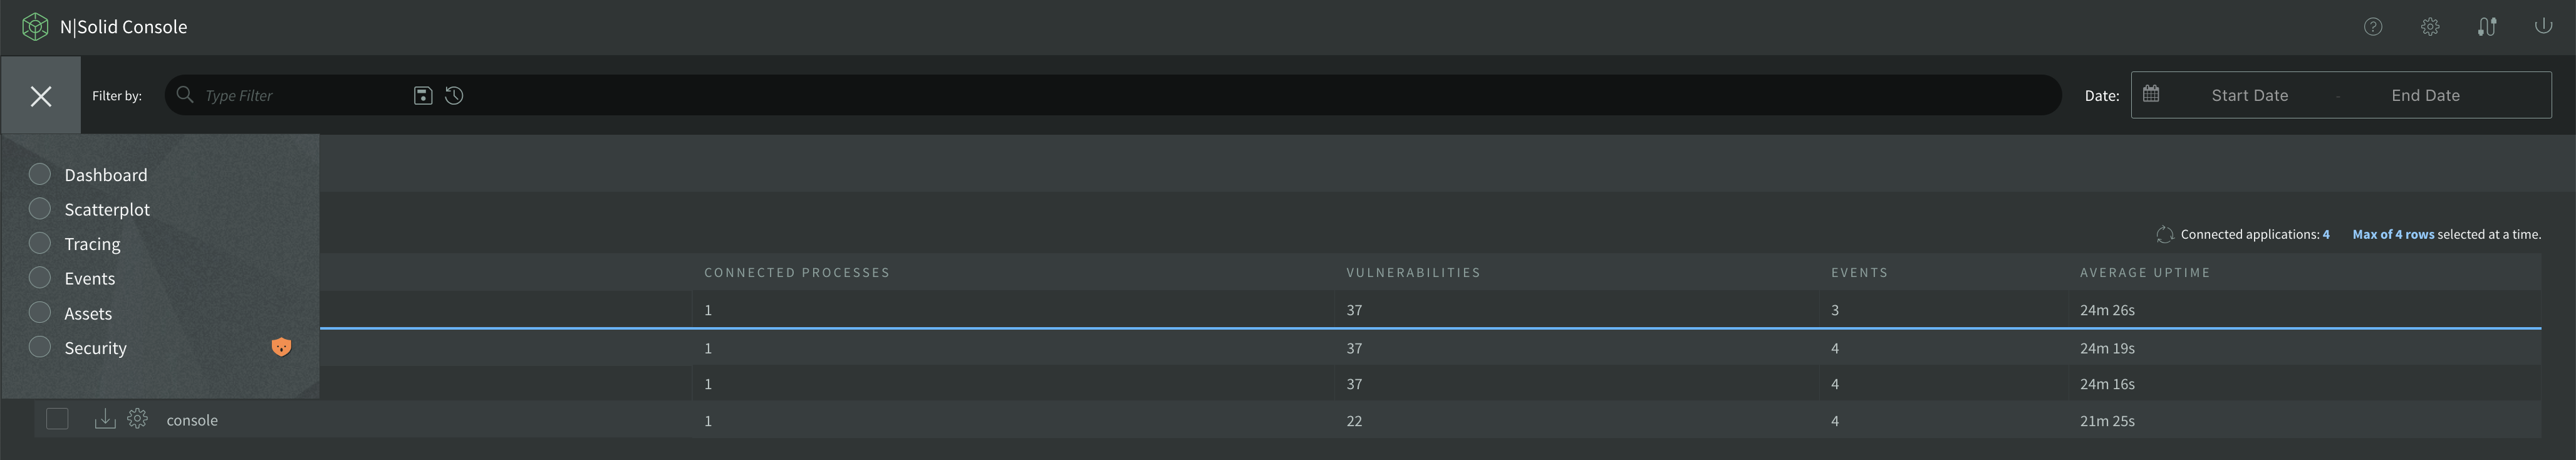
The view will be shown as below:
Tracing consists of three key components:
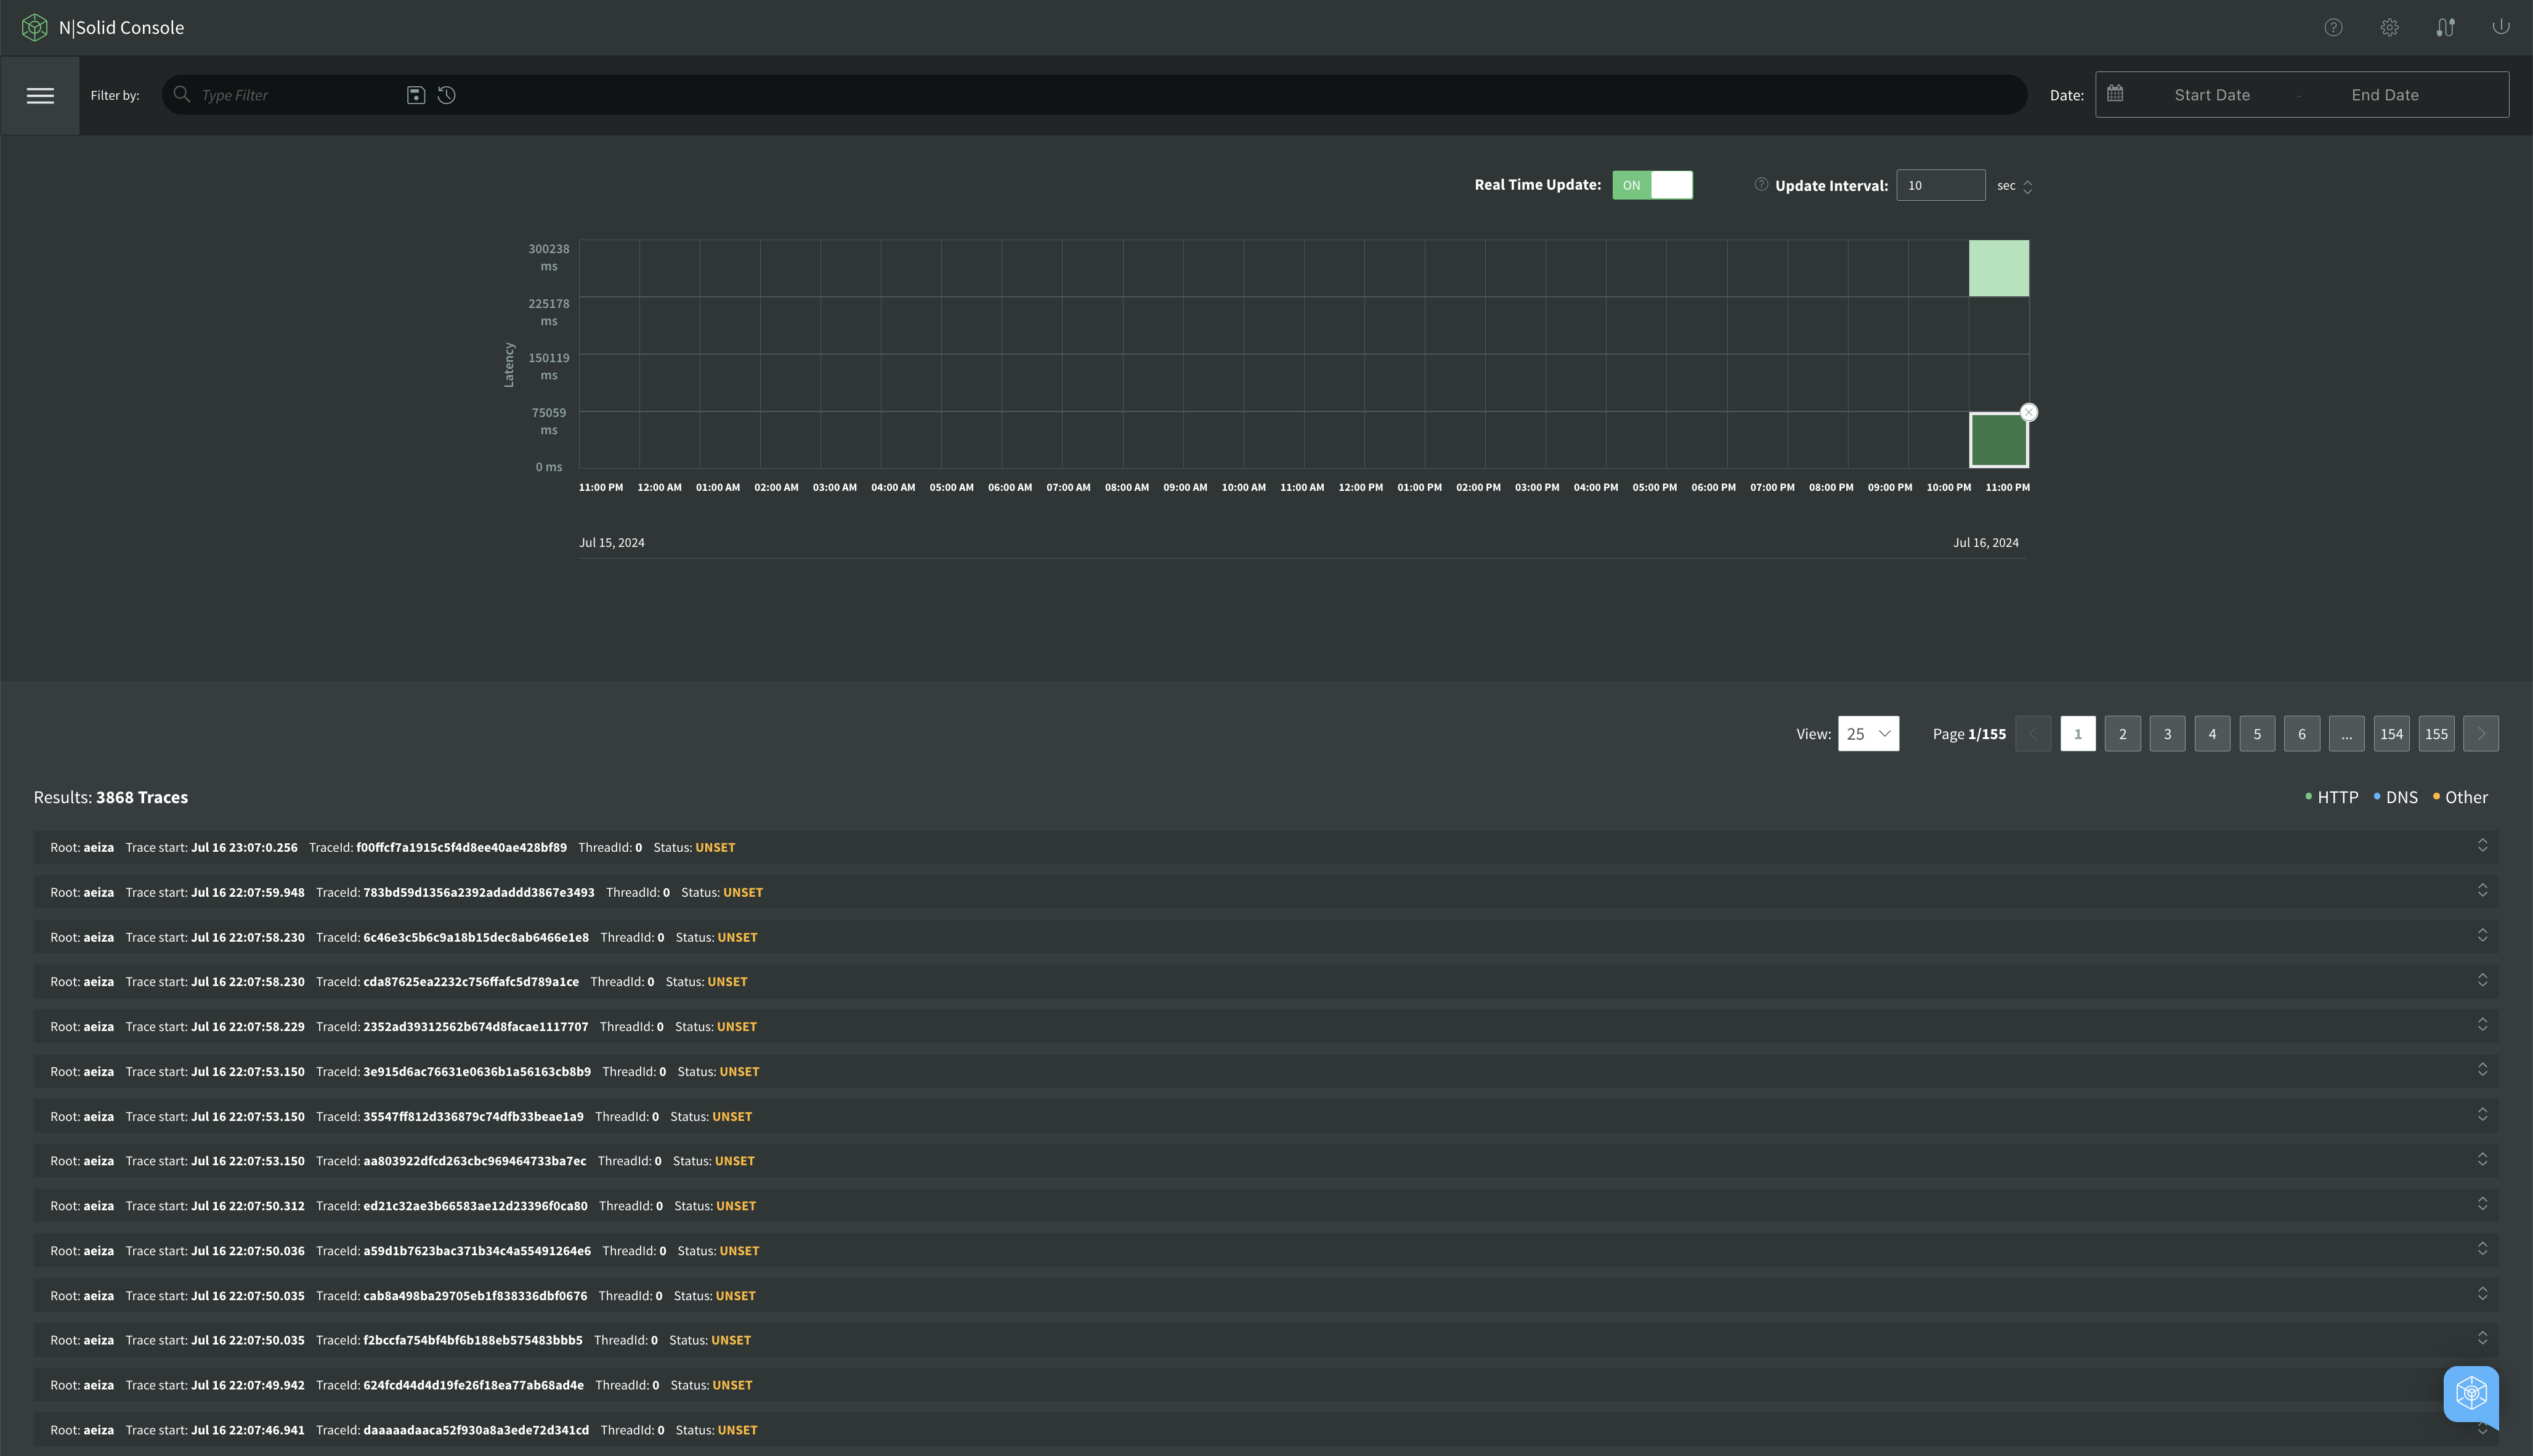
- Timeline Graph: a timeline graph of tracing data showing the density of the number of tracing spans.
- Filter: a filter input area to filter the results by attributes of the span.
- Spans (Results): a span is the building block of a trace and is a named, timed operation that represents a piece of the workflow in the distributed system. Multiple spans are pieced together to create a trace.
Timeline Graph
A timeline graph displays the density of the number of tracing spans. Below is the description of the color of a slot on the timeline graph:
| Color | Description |
|---|---|
| green | everything is ok |
| yellow | maybe you should look at this |
| red | definitely you should look at this |
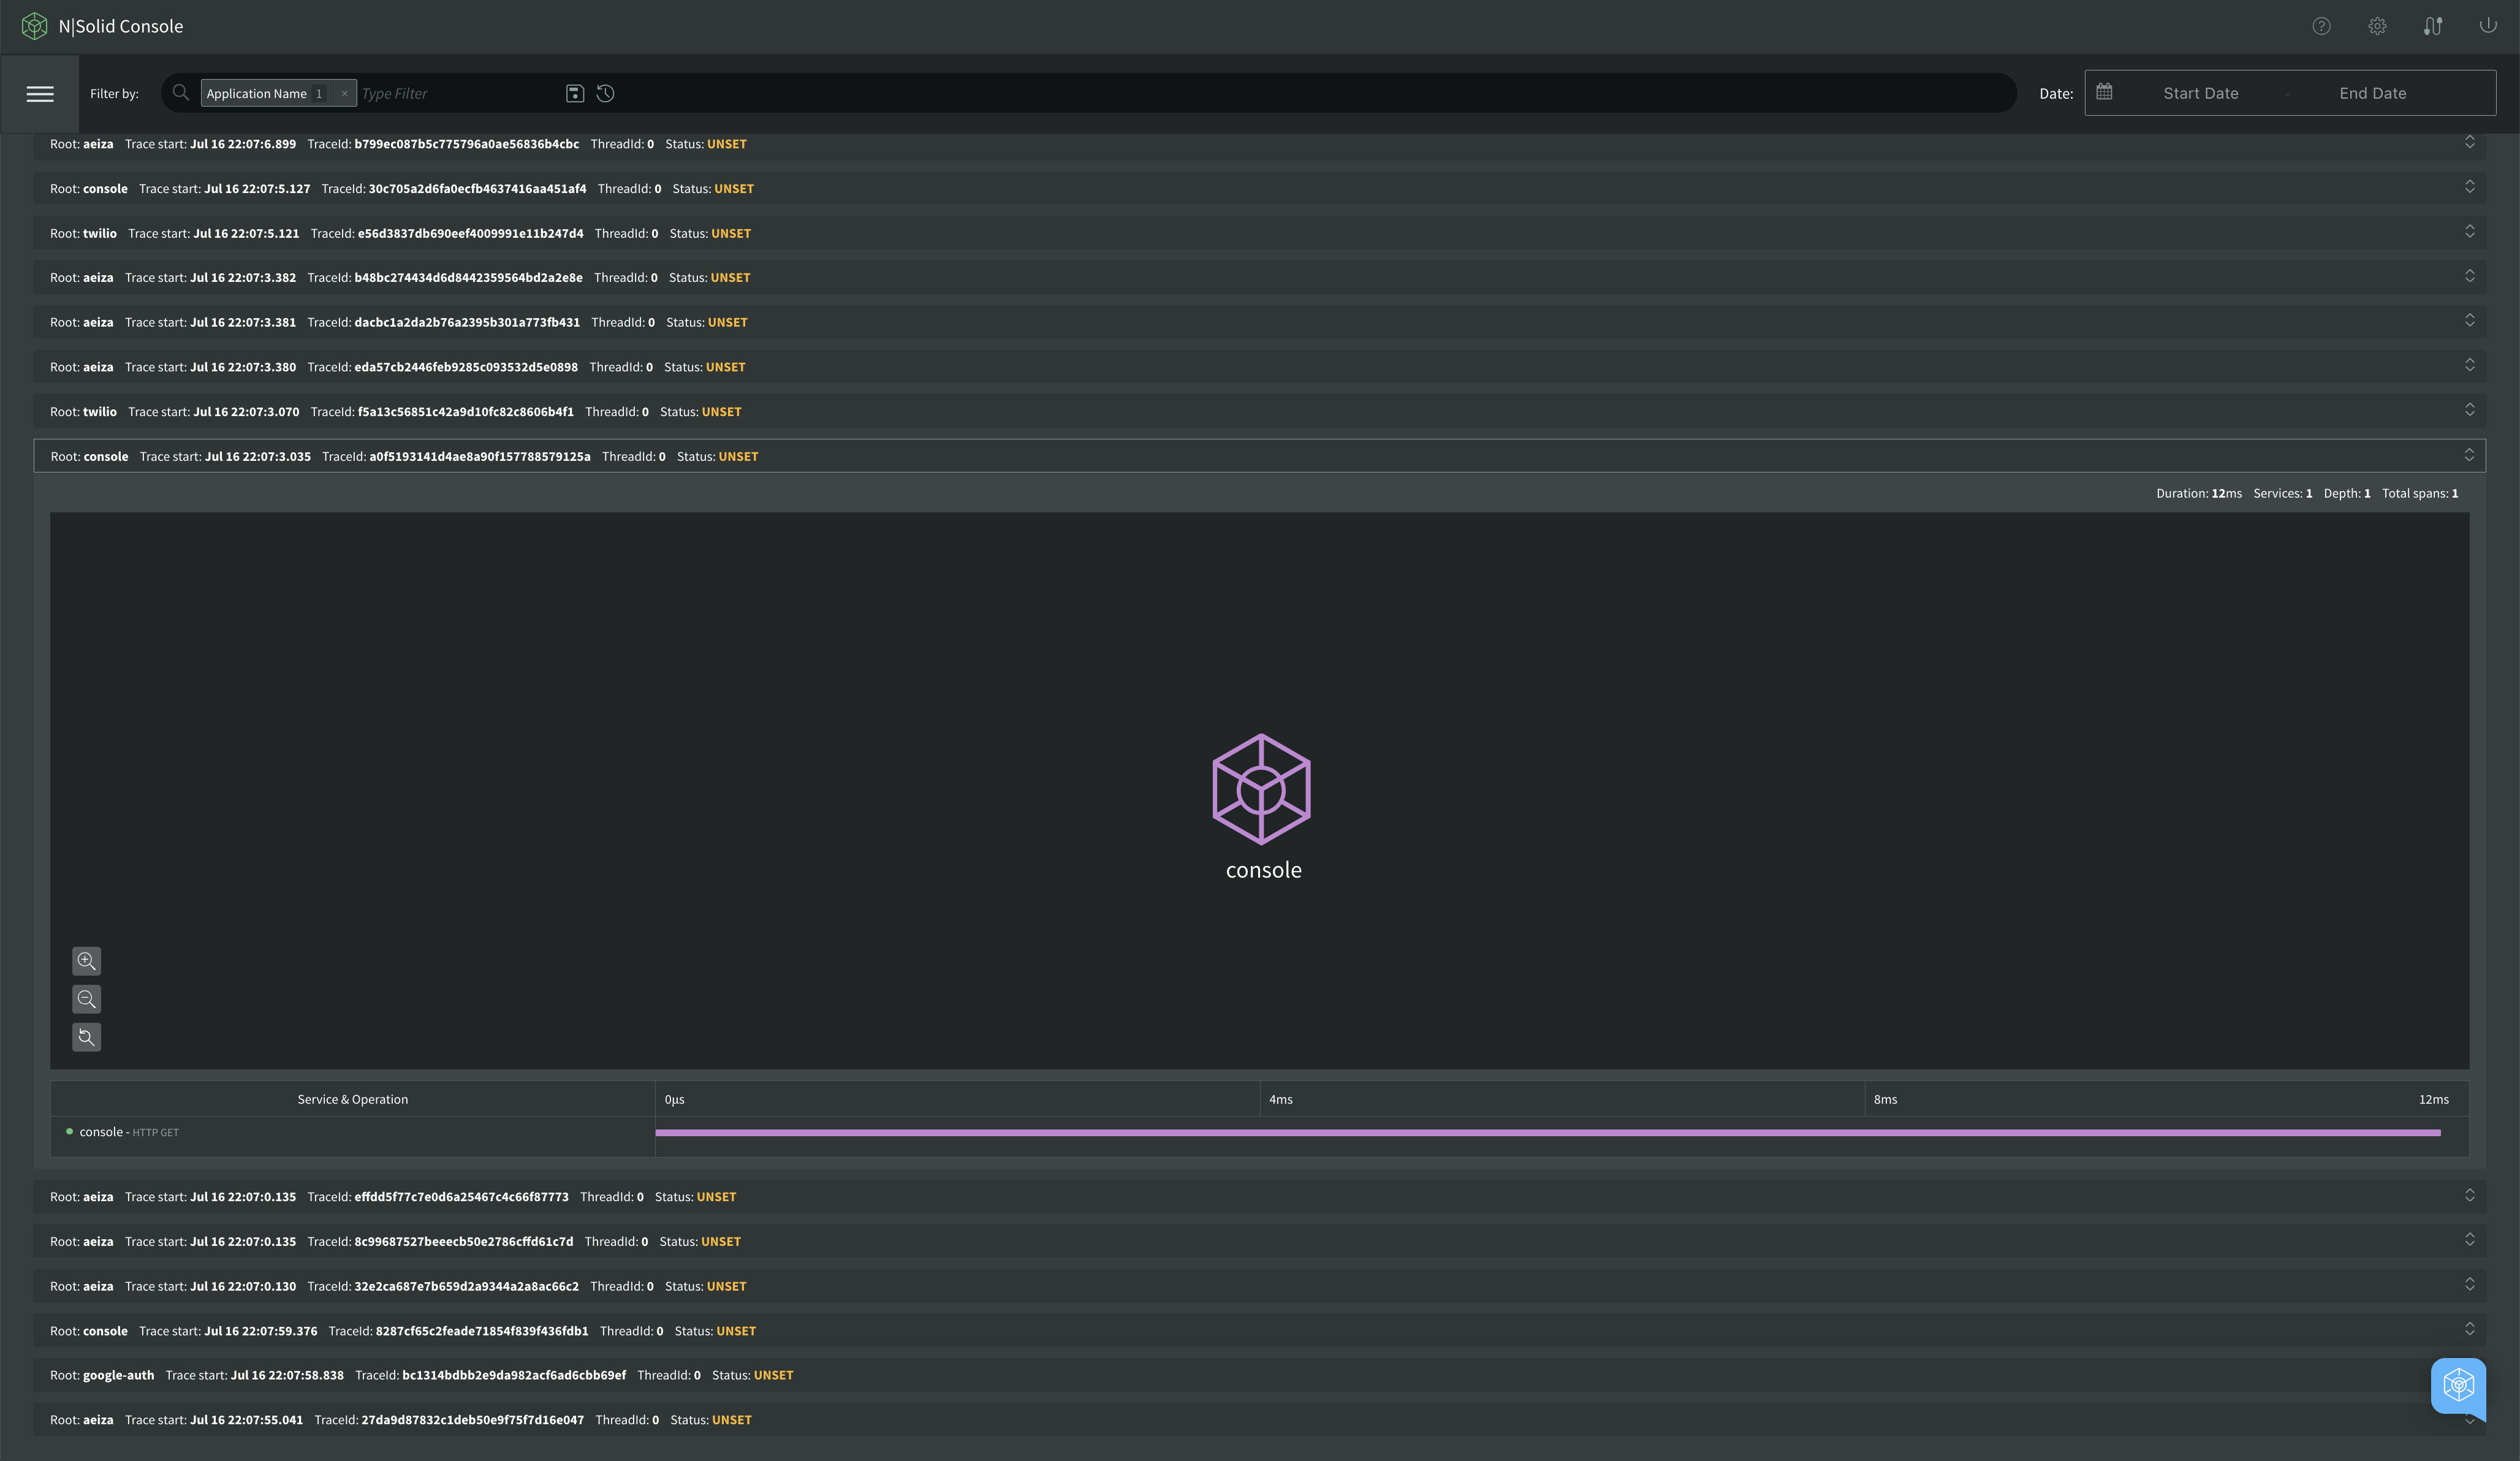
Assume that a simple request was made to the “console” service to monitor traces:
As a result, the Console displays the whole “span” information.
Span
A span is the building block of a trace and is a named, timed operation that represents a piece of the workflow in the distributed system. Multiple spans are pieced together to create a trace.
Traces are often viewed as a tree of spans that reflects the time that each span started and completed. It also shows you the relationship between spans. A trace starts with a root span where the request starts. This root span can have one or more child spans, and each one of those child spans can have child spans.
Inspecting Span Details
To inspect the span details of a span, click on the title Service & Operation:
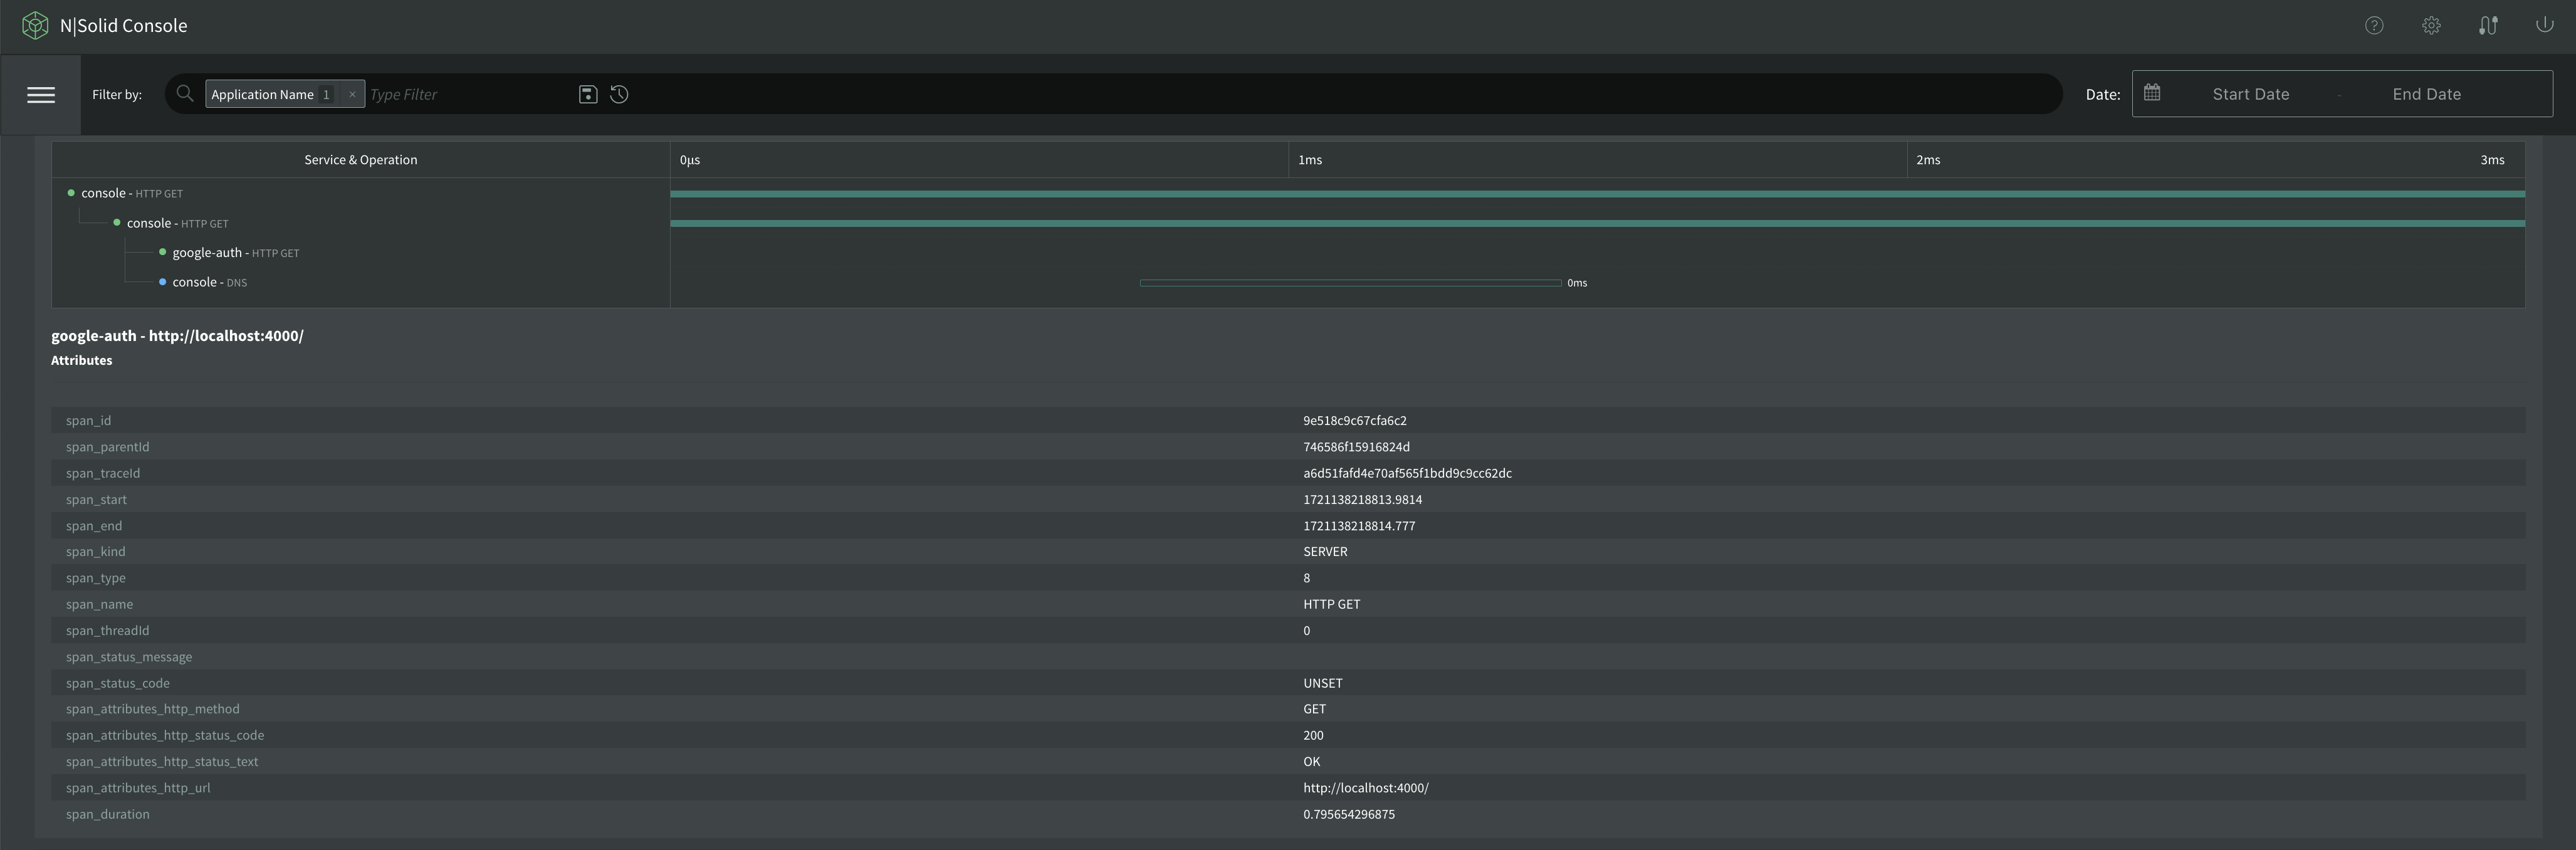
Below are the attributes of the span:
| Attribute | Description |
|---|---|
| id | the id of the application |
| app | the name of application |
| hostname | the name of the host machine |
| tags | the tags of the application |
| span_attributes_http_method | the http method of span attributes |
| duration | the duration of the span |
| span_attributes_http_status_code | the http status code of the span attributes |
| span_attributes_http_status_text | the http status text of the span attributes |
| span_attributes_http_url | the http url of the span attributes |
| span_end | the end time of the span |
| span_id | the id of the span |
| span_name | the name of the span |
| span_parentId | the parent ID of the span |
| span_start | the start time of the span |
| span_status_code | the status code of the span |
| span_threadId | the thread ID of the span |
| span_traceId | the trace ID of the span |
| span_type | the type of the span |
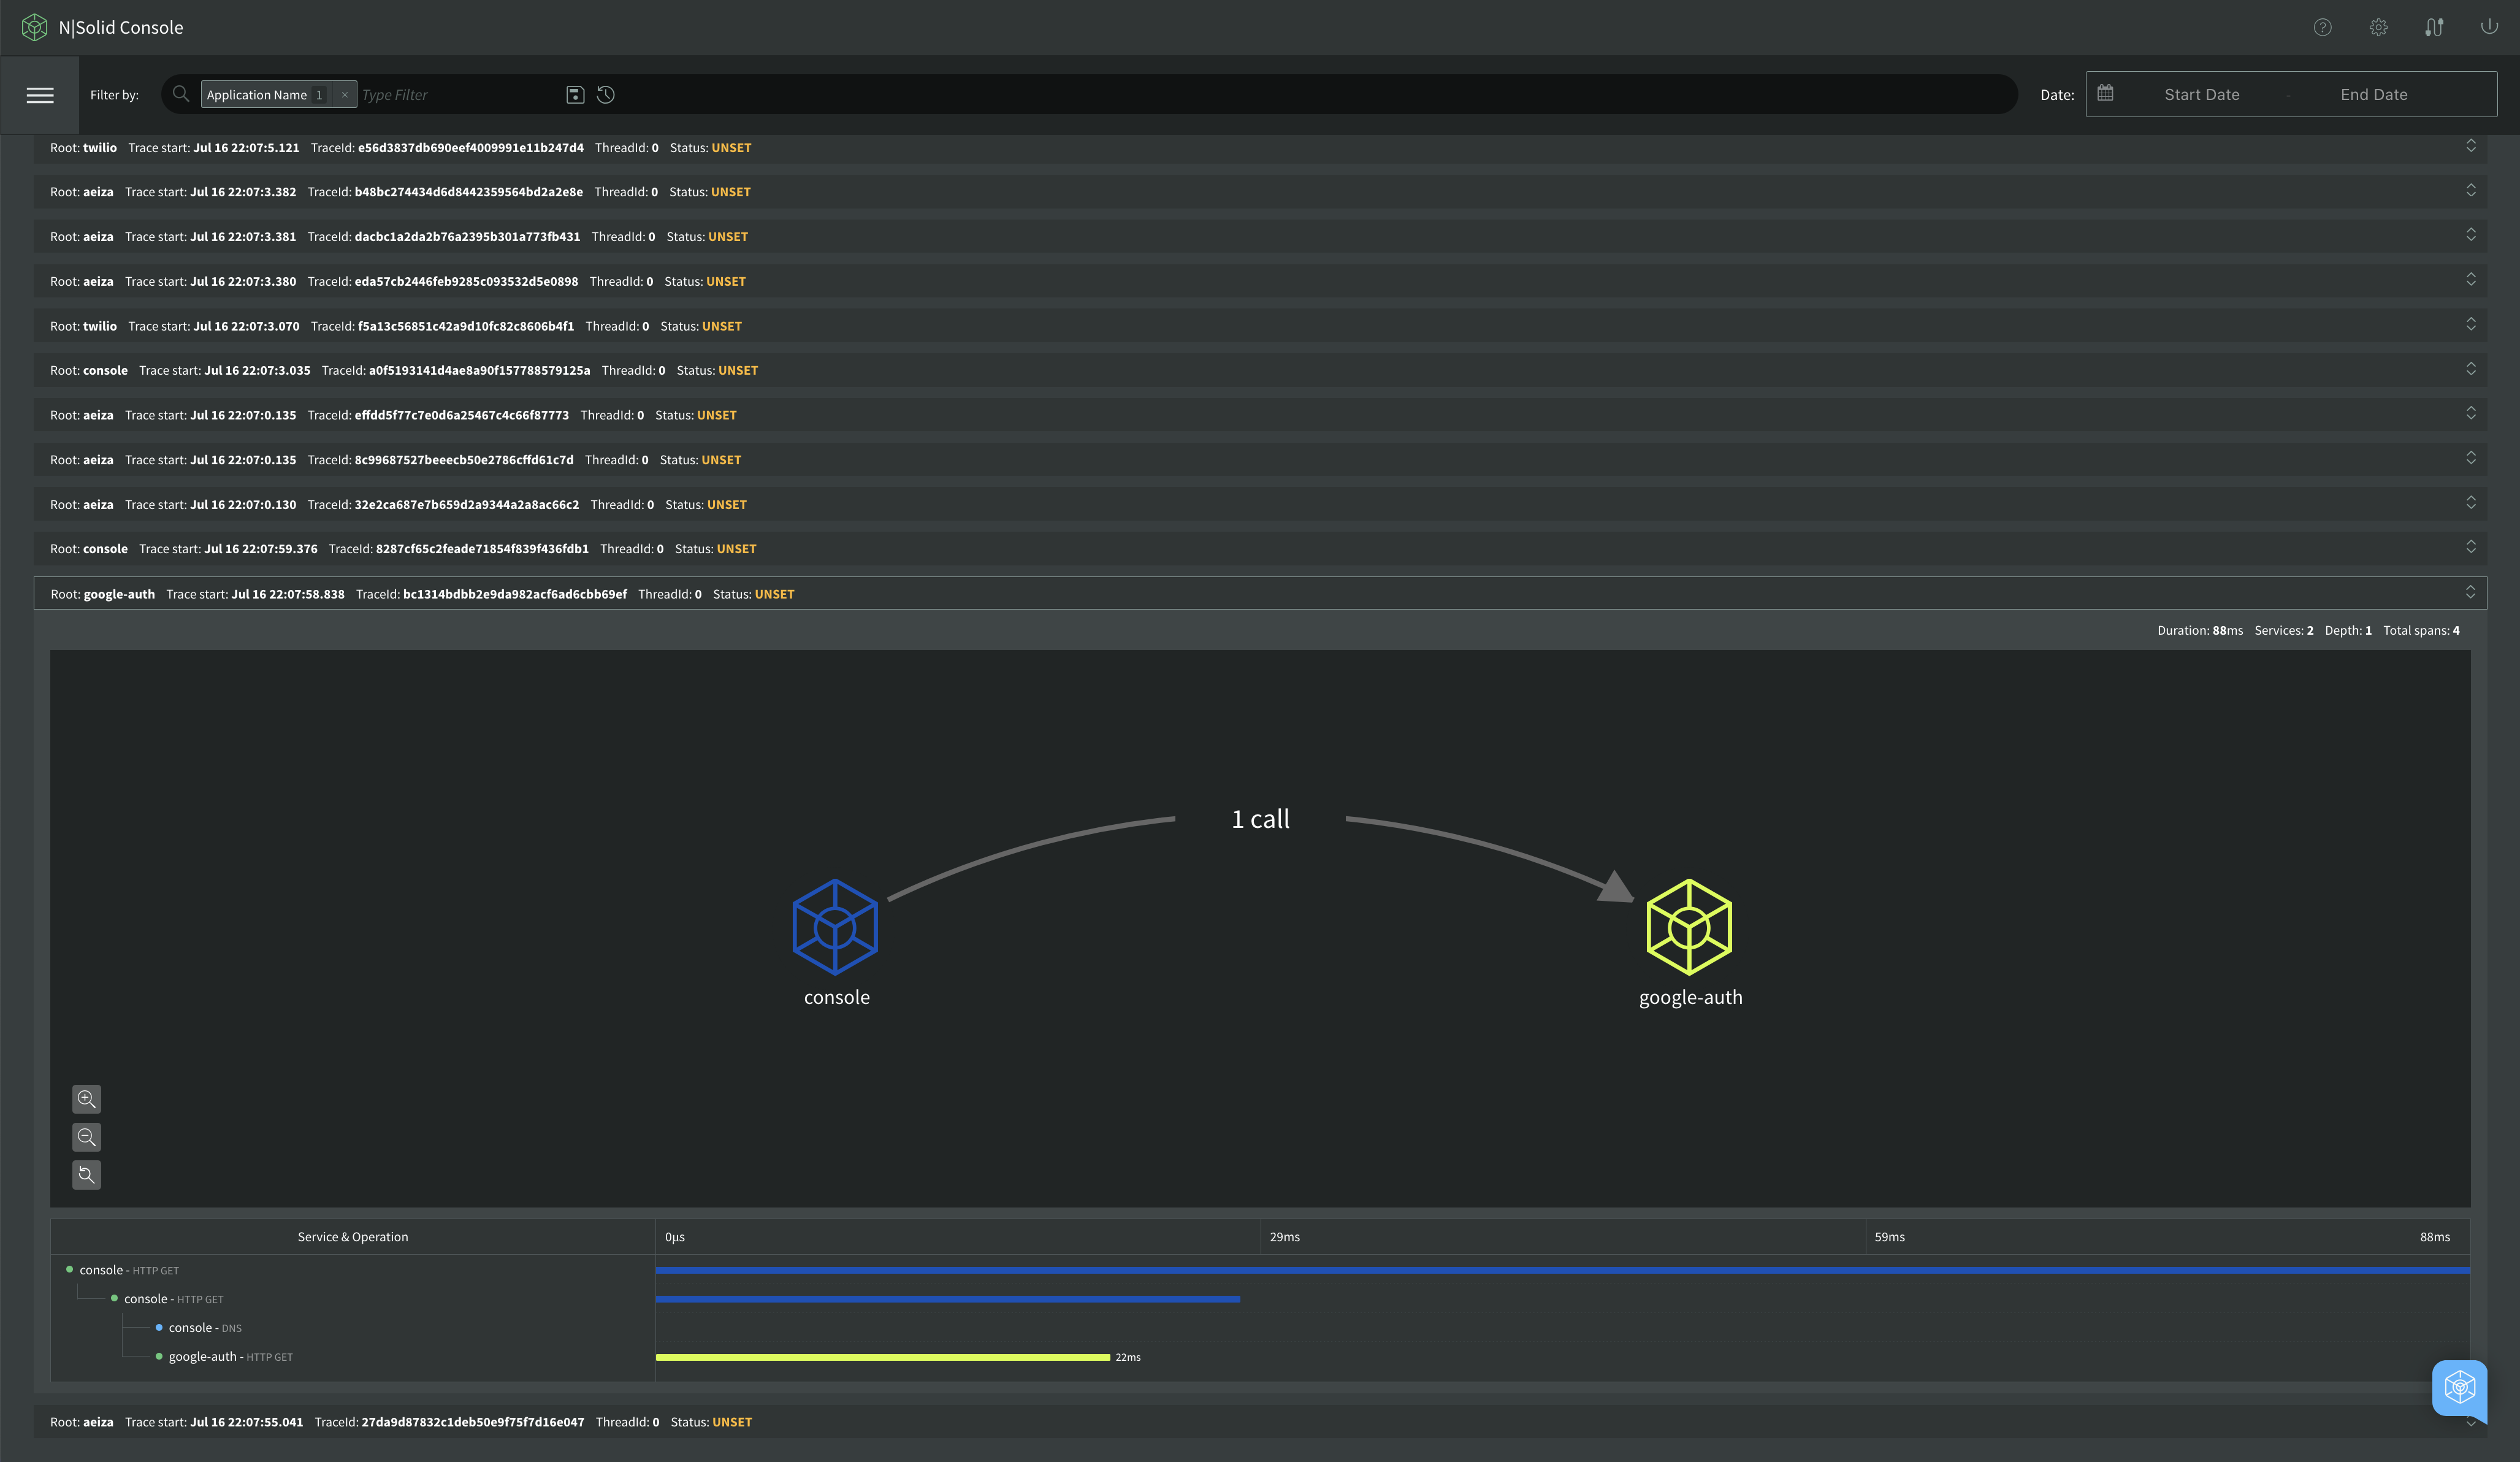
Let's authenticate using the console service, which is going to perform a request to the google-auth-service to authenticate the user.
The graph below represents a “path”, from the console service to the authentication service, N|Solid will monitor the HTTP traces in this distributed system.
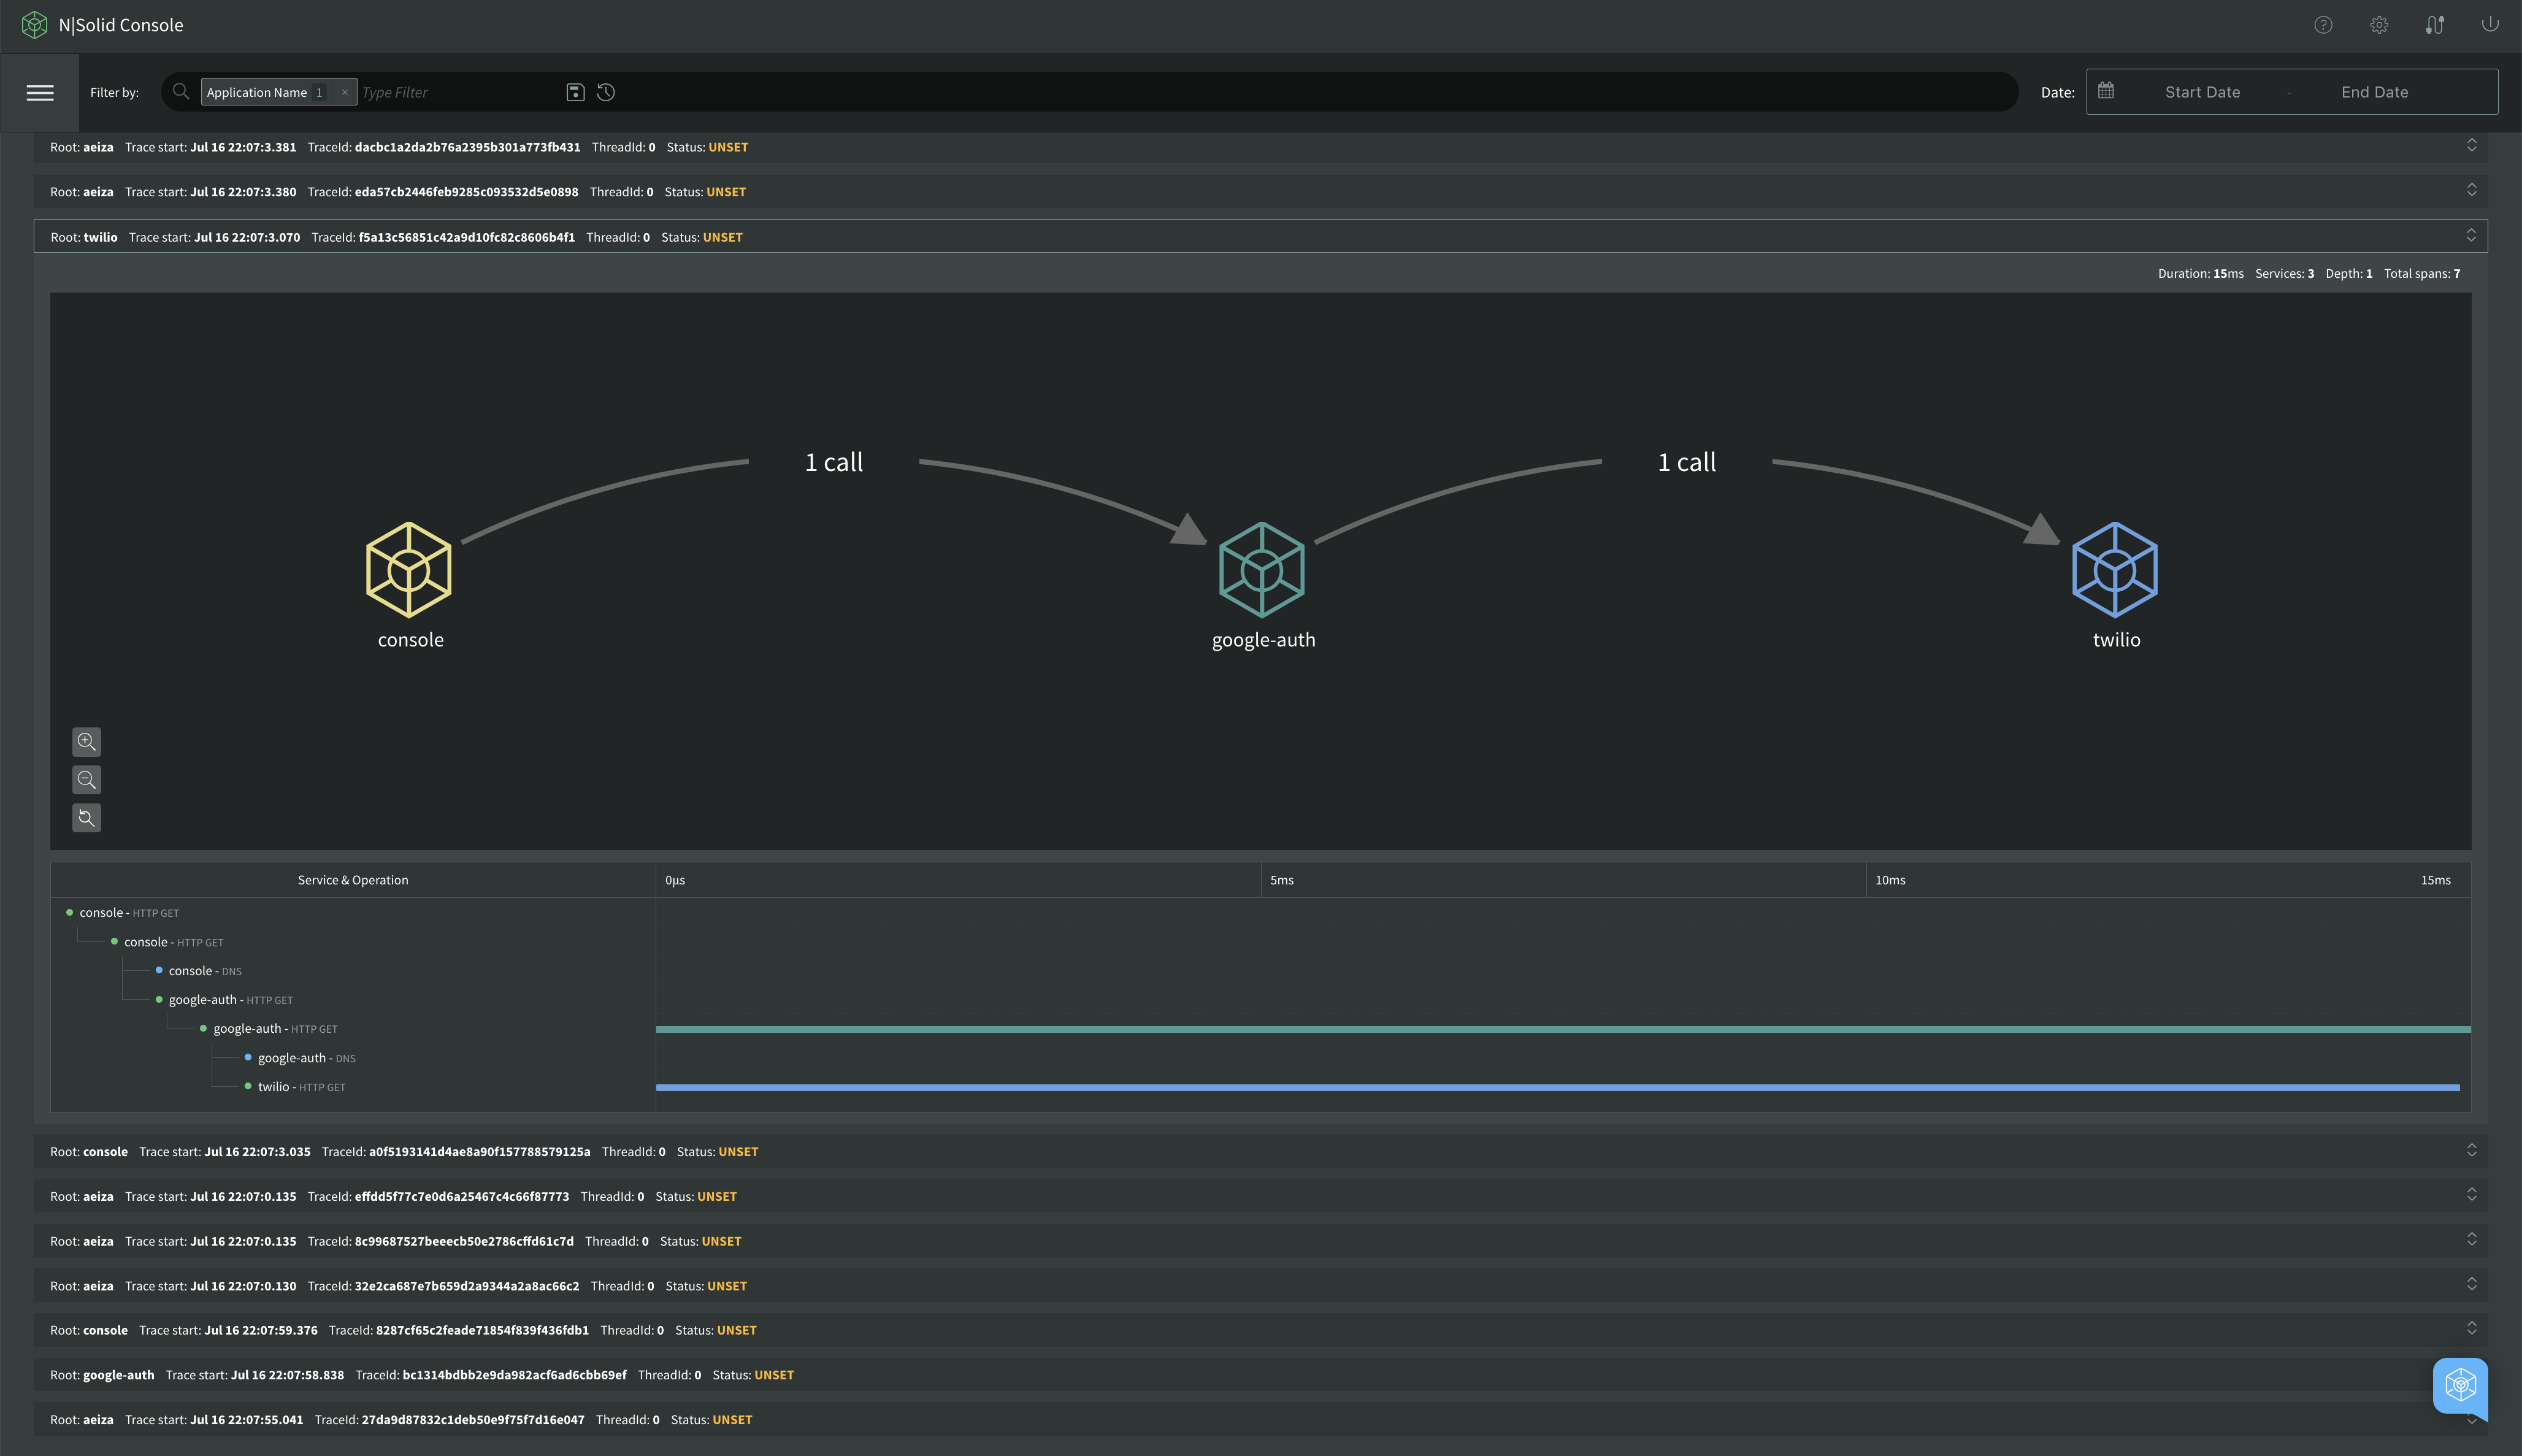
As such, the graph shows the whole “path”, starting from the console and finishing with the SMS service. This is how distributed tracing works using N|Solid managed systems.
The collected information can be used for debugging latency issues, service monitoring, and more. This is a valuable addition for users interested in debugging request latency. Tracing traces user requests through multiple Node applications, collecting data that can help find the cause of latency issues, errors, and other problems in a distributed system.
Changing Update Settings
You can configure the update settings for distributed tracing at the top of the Distributed Tracing view:
You can turn on or off Real Time Update and change the update interval. The default update interval is 10 seconds. Available options are 10, 15, 30, or 60 seconds.
Changing Time Range
To change the time range of tracing, click the calendar icon below the timeline graph:
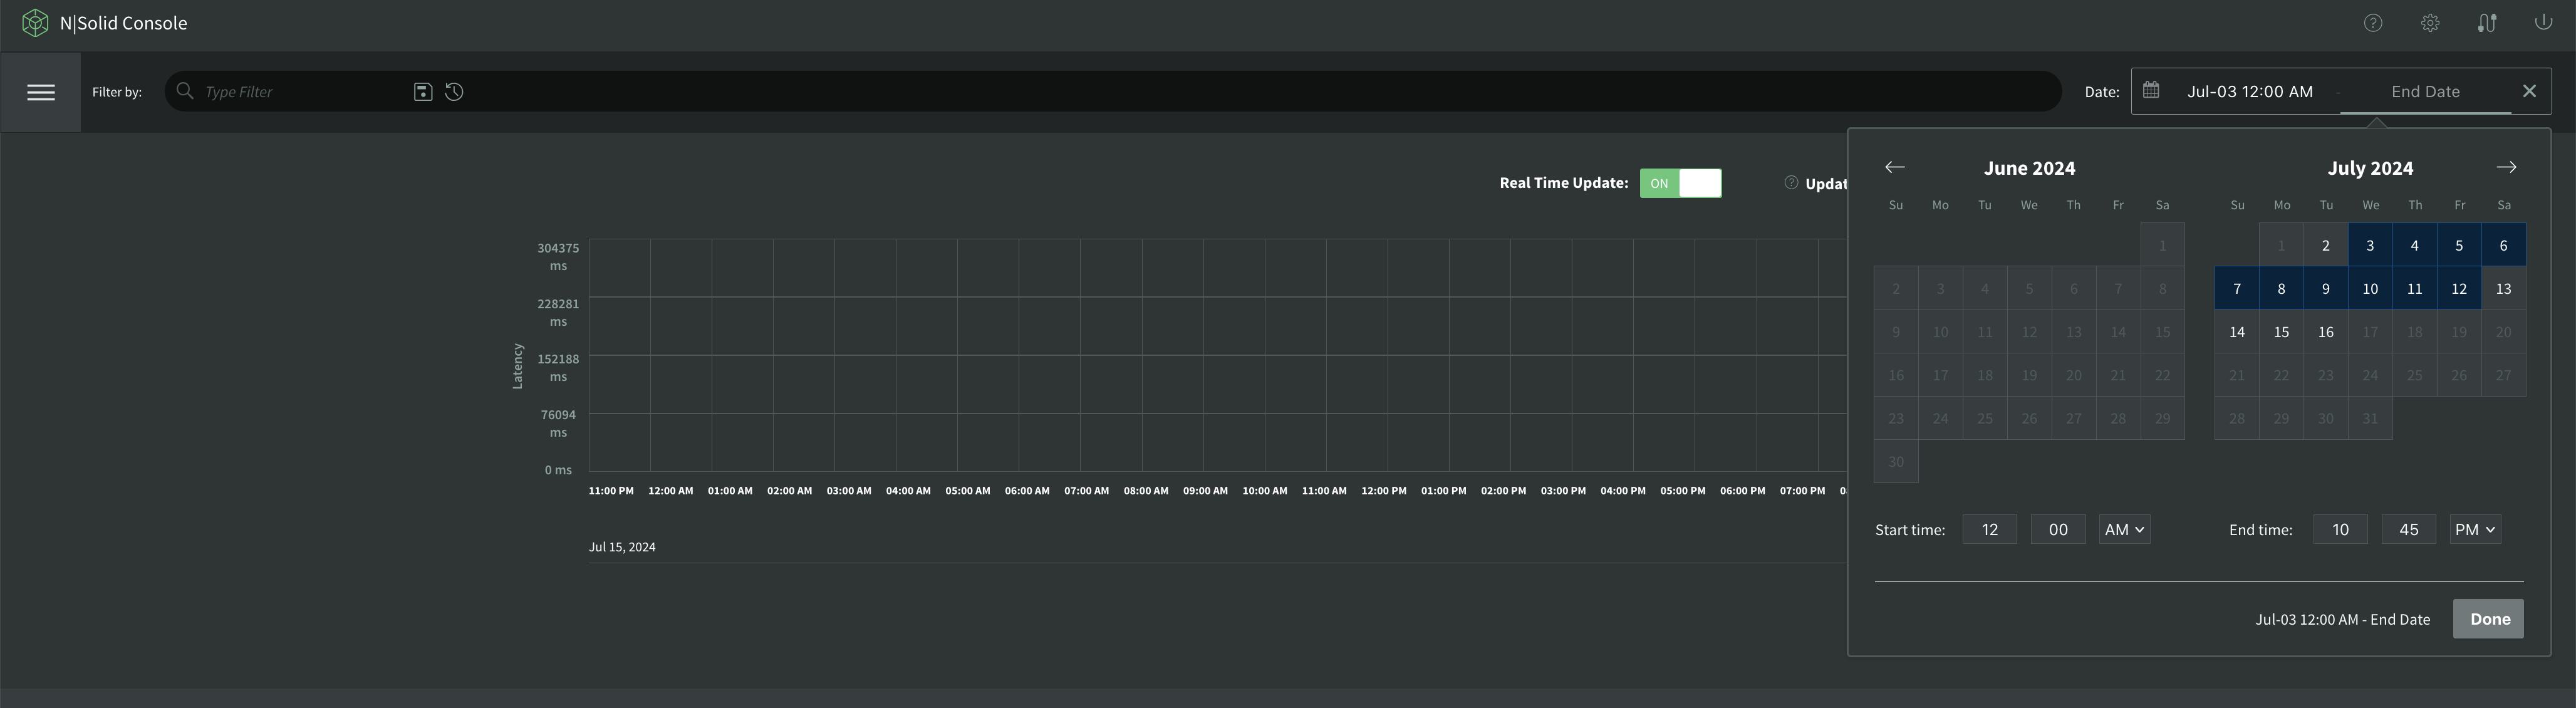
It will show a calendar for selecting a time range. The timeline graph range is updated every 1 minute, with an interval of 1 minute for the date range to move.
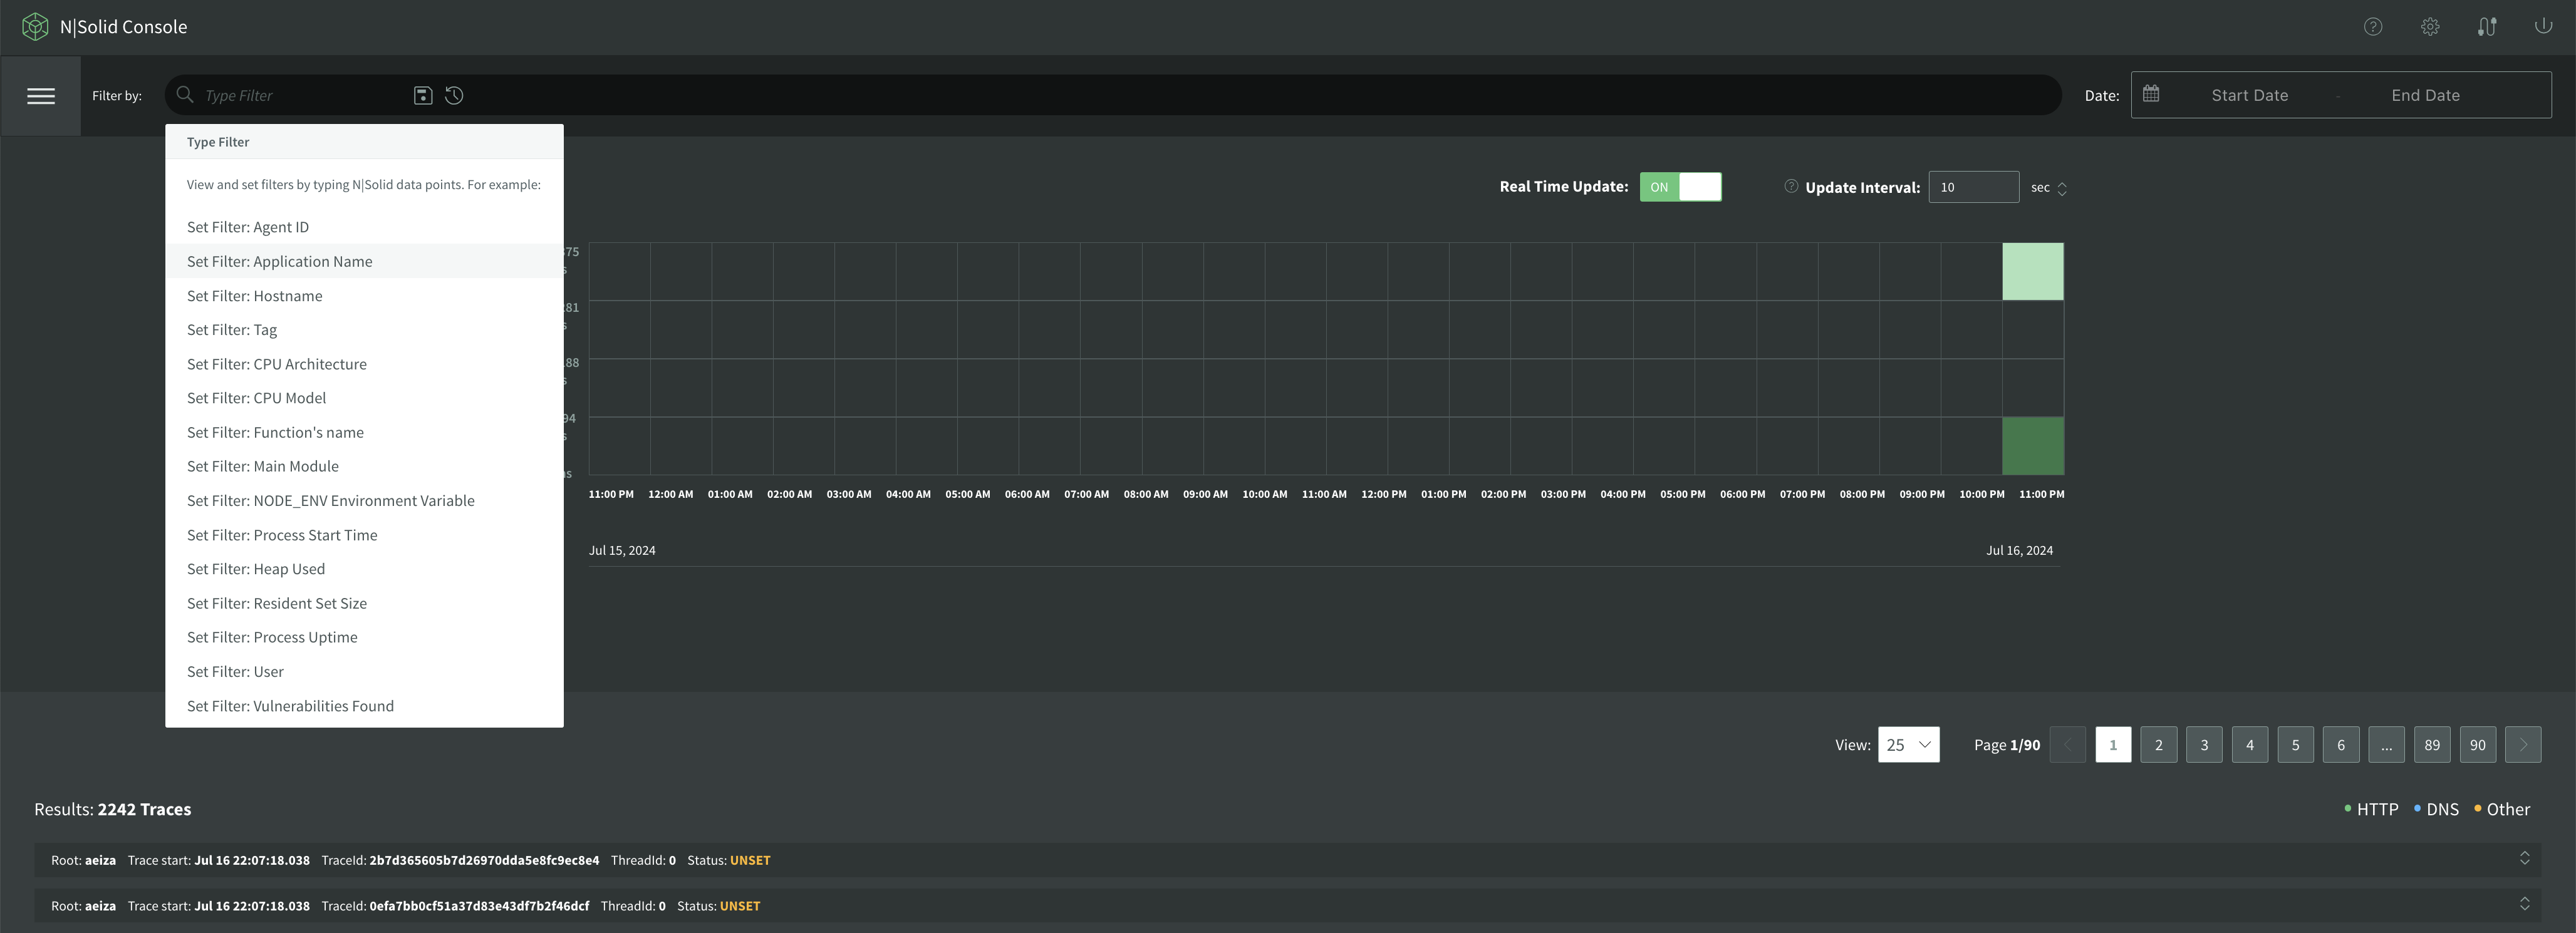
Filtering Results
Filtering the results by attributes of the span is easy for users. Just tap the Filter input area and select the attribute(s) you want to filter by:
HTTP Tracing
Enabling Tracing via N|Solid
To enable Tracing using N|Solid, set the environment variable NSOLID_TRACING_ENABLED=1. By enabling this feature, you can troubleshoot HTTP, DNS, and other network request problems that you might encounter using the N|Solid Console.
Using Distributed Tracing
Distributed tracing in the N|Solid Console is an extension of HTTP tracing in N|Solid. This documentation will use the following examples to cover how it works on the Console side under the following conditions:
- An application handling the authentication process:
  // console.js
  const http = require('http')
  const PORT = process.env.PORT || 3000
  http.createServer((req, res) => {
    if (req.url === '/auth') {
      console.log('AUTH handler')
      const authURL = 'http://localhost:4000'
      const gReq = http.request(authURL)
      gReq.end()
      gReq.on('close', () => res.writeHead(200).end('Google made it'))
    } else if (req.url === '/auth-2fa') {
      const authURL = 'http://localhost:4000/2fa'
      const twoFactor = http.request(authURL)
      twoFactor.end()
      twoFactor.on('close', () => res.writeHead(200).end('Auth made it with sms'))
    } else {
      res.end('ok')
    }
  }).listen(PORT)
- Another application doing the two-factor authentication process (google-auth):
  // google-auth.js
  const http = require('http')
  const PORT = process.env.PORT || 4000
  http.createServer((req, res) => {
    if (req.url === '/2fa') {
      const smsServiceURL = 'http://localhost:5000'
      const smsService = http.request(smsServiceURL)
      res.writeHead(200).end('Auth made it')
      smsService.end()
    } else {
      console.log('Auth root handler')
      res.writeHead(200).end('ok')
    }
  }).listen(PORT)
- The authentication requires a two-factor authentication
- The two-factor authentication service uses an SMS service to send a message (twilio):
  // twilio.js
  const http = require('http')
  const PORT = process.env.PORT || 5000
  http.createServer((req, res) => {
    res.writeHead(200).end('ok')
  }).listen(PORT)
- The N|Solid Console receives traces from all services involved in the distributed system.
