Optimize Performance with CPU Profiles
CPU Profiling
Analyzing Profiles Using the N|Solid Console
The N|Solid Console allows you to generate and analyze profiles in one action. This is particularly useful if you need to take a series of profiles, as it avoids the overhead of switching between environments. The console also saves a profile history, simplifying navigation between profiles when troubleshooting.
CPU profiles provide low‑overhead sampling over long durations. Overhead primarily comes from V8’s profiler and N|Solid command interactions.
- Select the process of interest.
- On the process details page, click the New CPU Profile button.
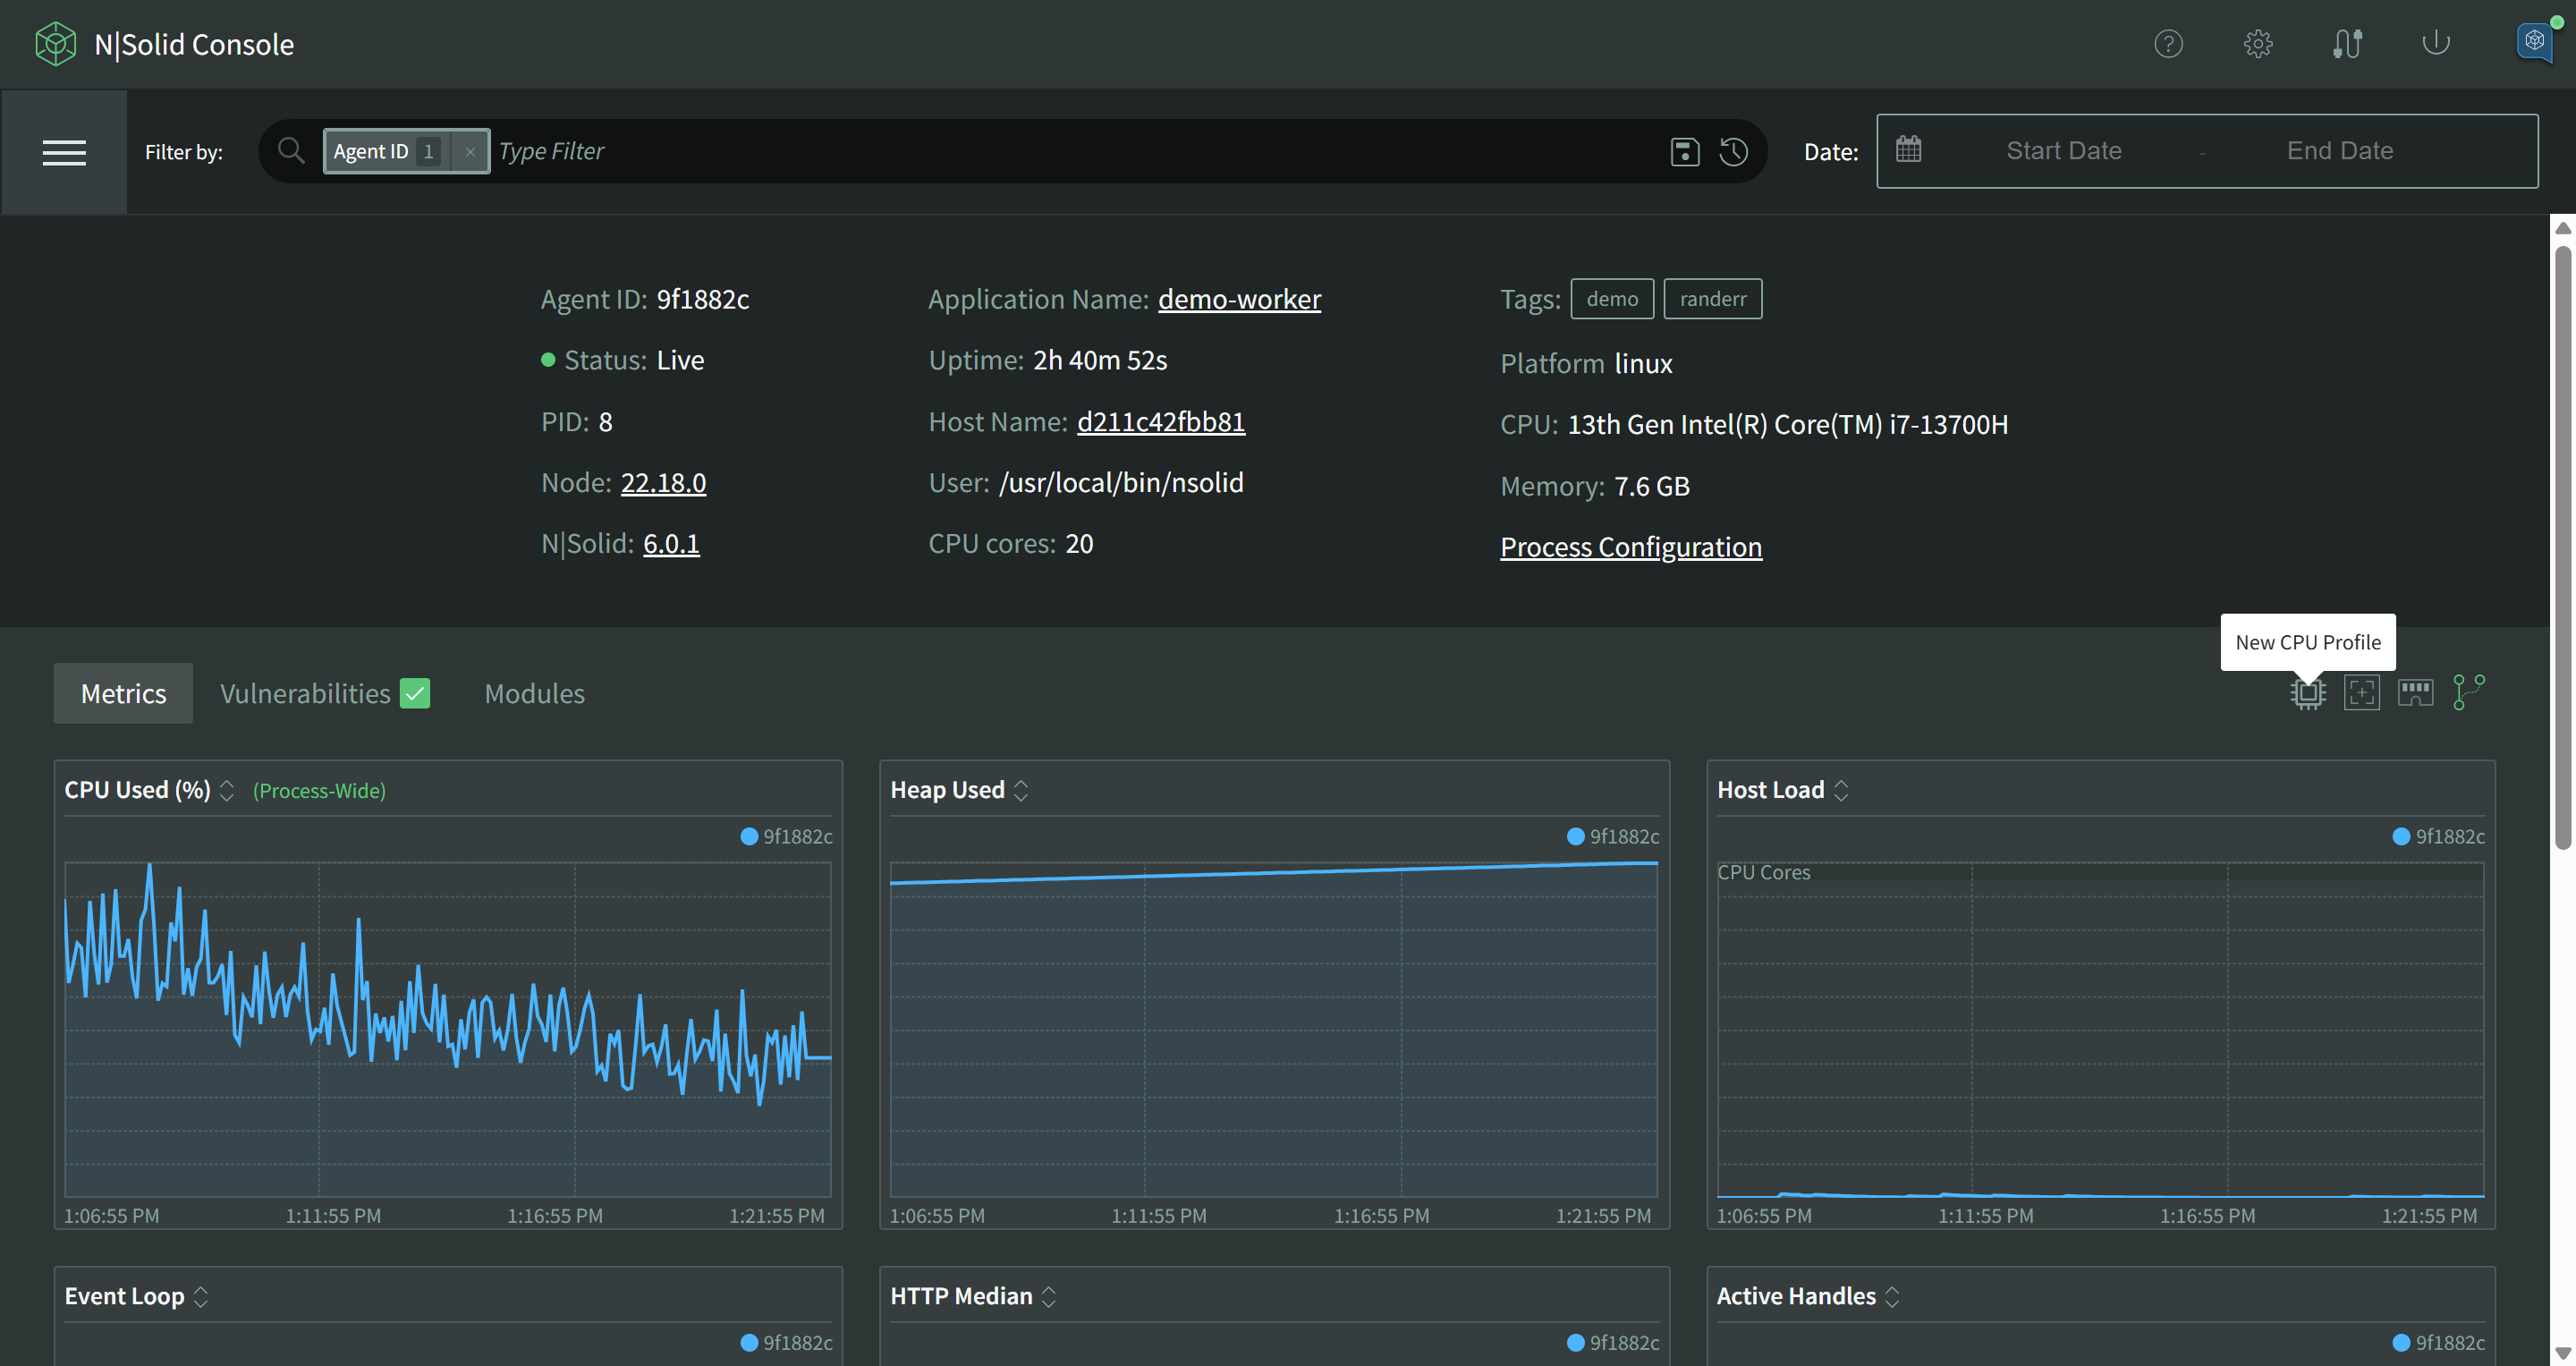
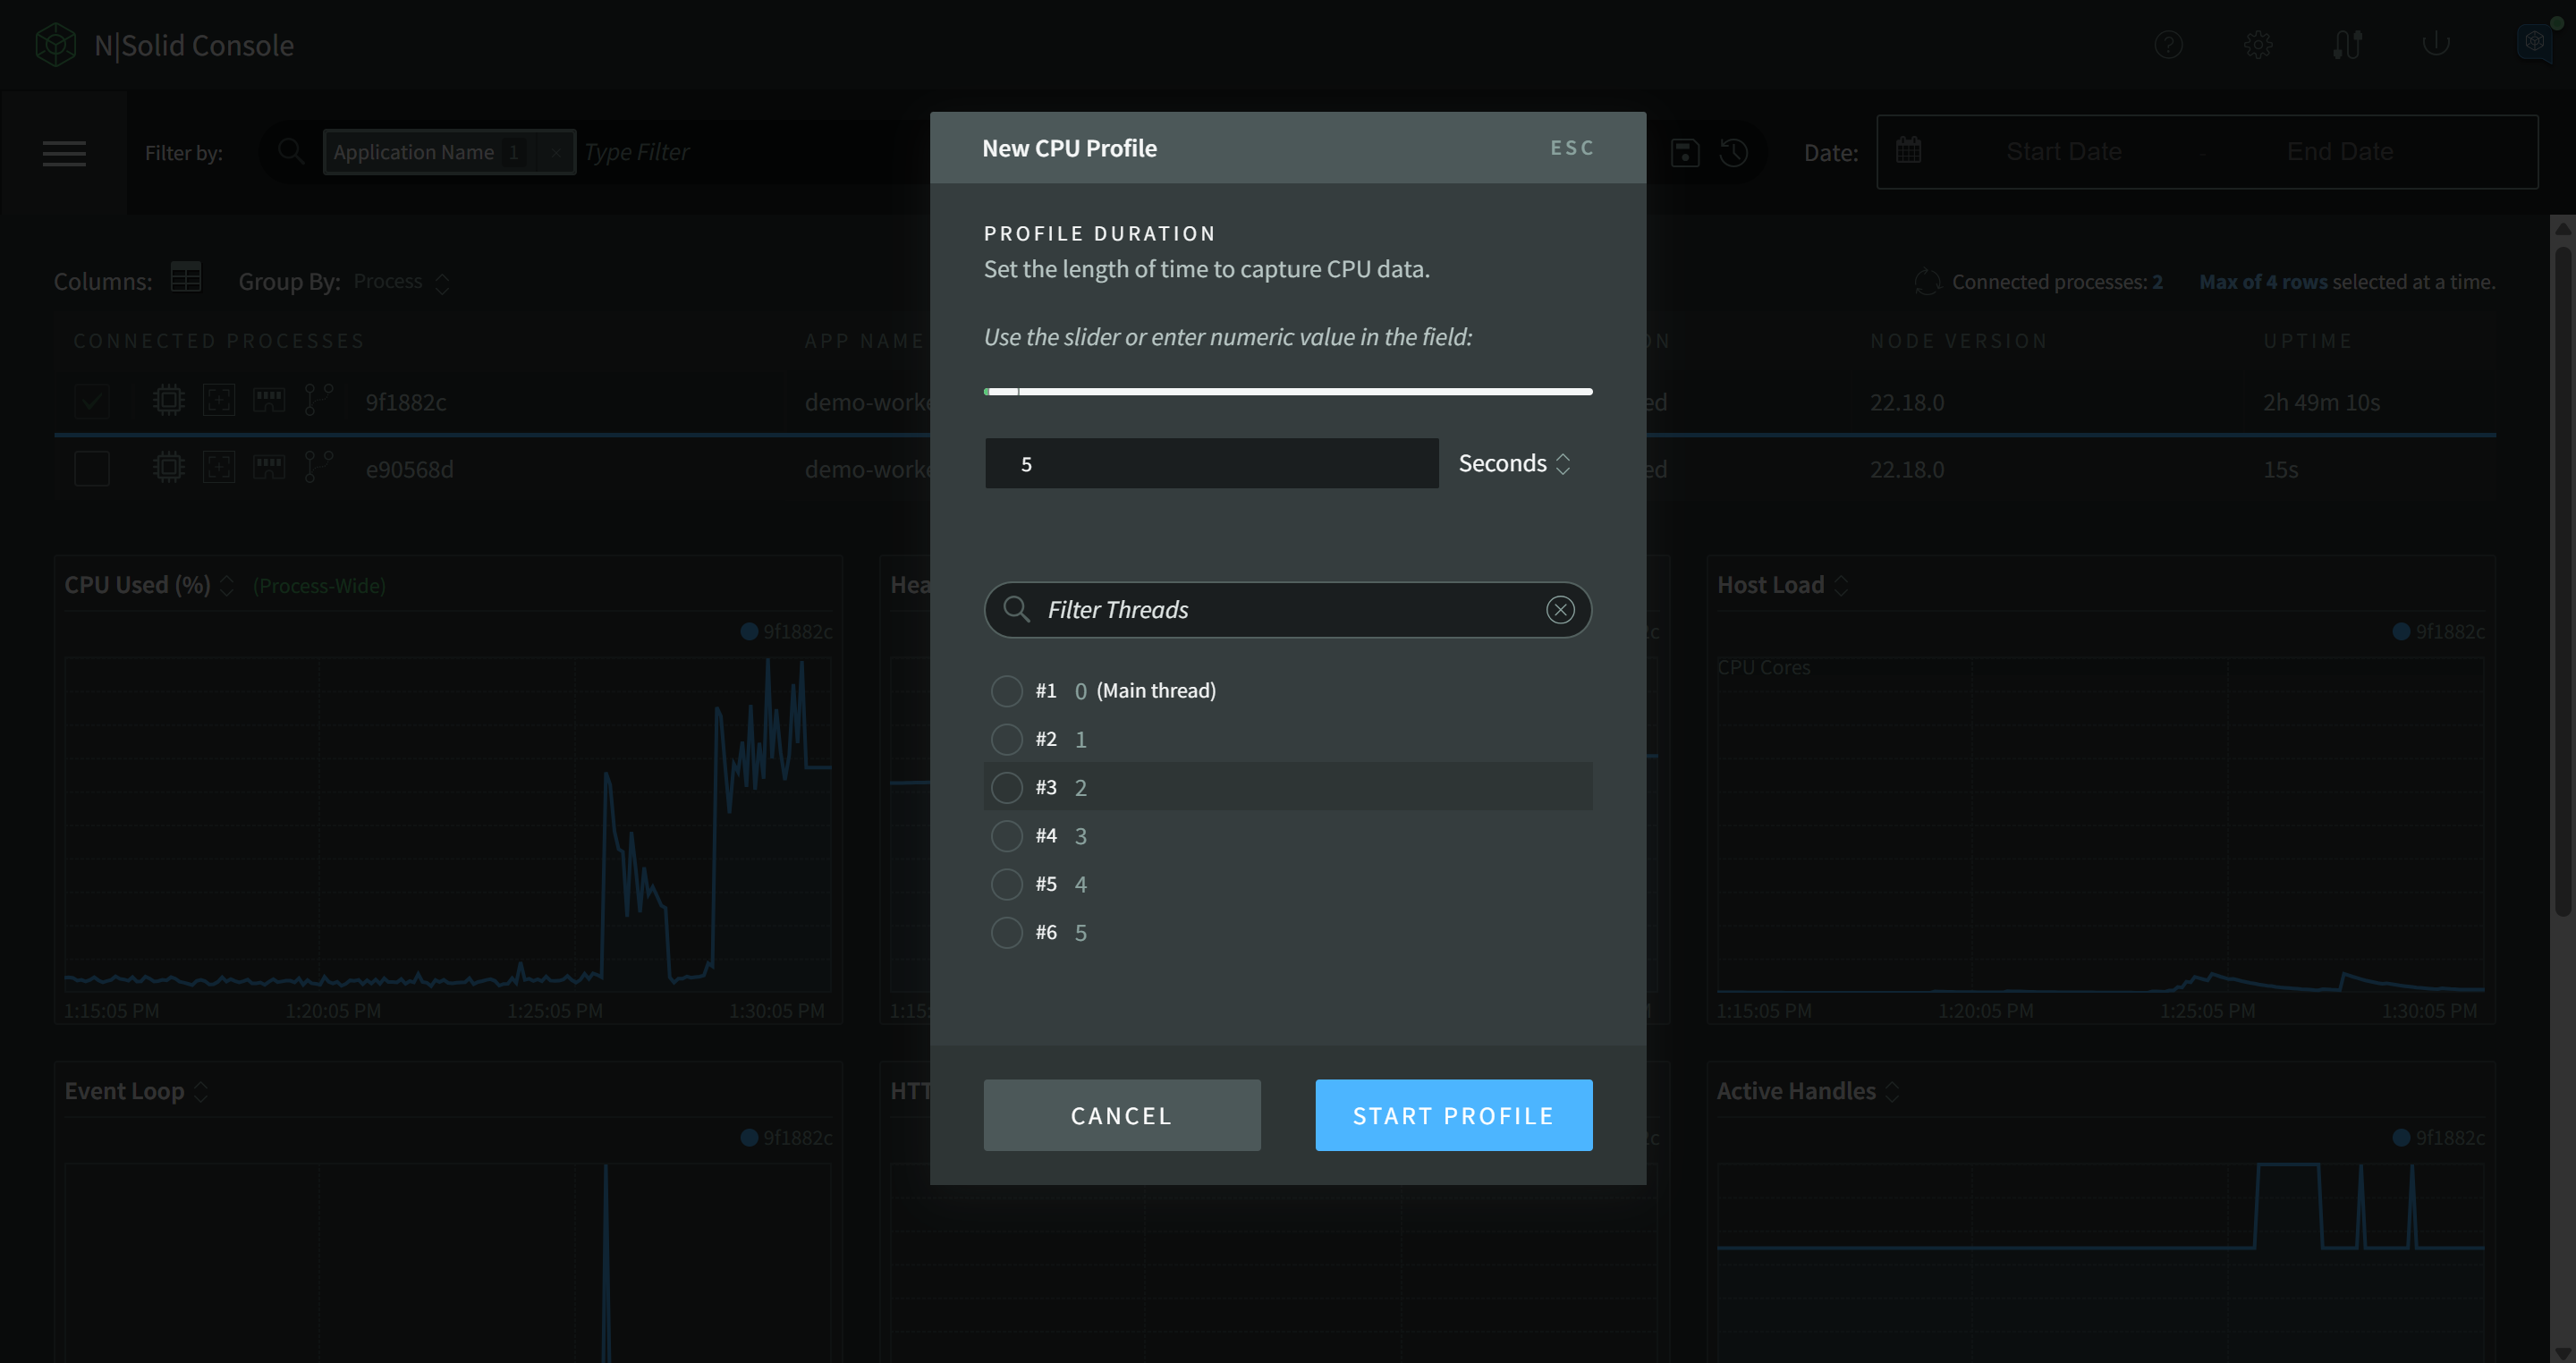
- Select your profile window (1 second up to whatever is necessary) using either the slide bar or the dialog box, the thread you want to profile (0 is the main thread, the rest of them are worker threads) and start the profile.
- N|Solid Console will pop up a green notification bar across the top of the screen when the profile is complete. Click it to view your new CPU profile.
For convenience, profiles are saved in your console session so you can easily flip between profiles. If your application ends before the profile is complete, N|Solid will try to save the profile data generated so far. If it is able to do so, your profile will be viewable under the Assets tab of the process detail page.
Visualizations Explained
Visualizations
All of the visualizations available for profile data show the unique set of stack traces captured during the profile, with the "area" of the stack indicating the proportional time spent in a function compared to that of its parent.
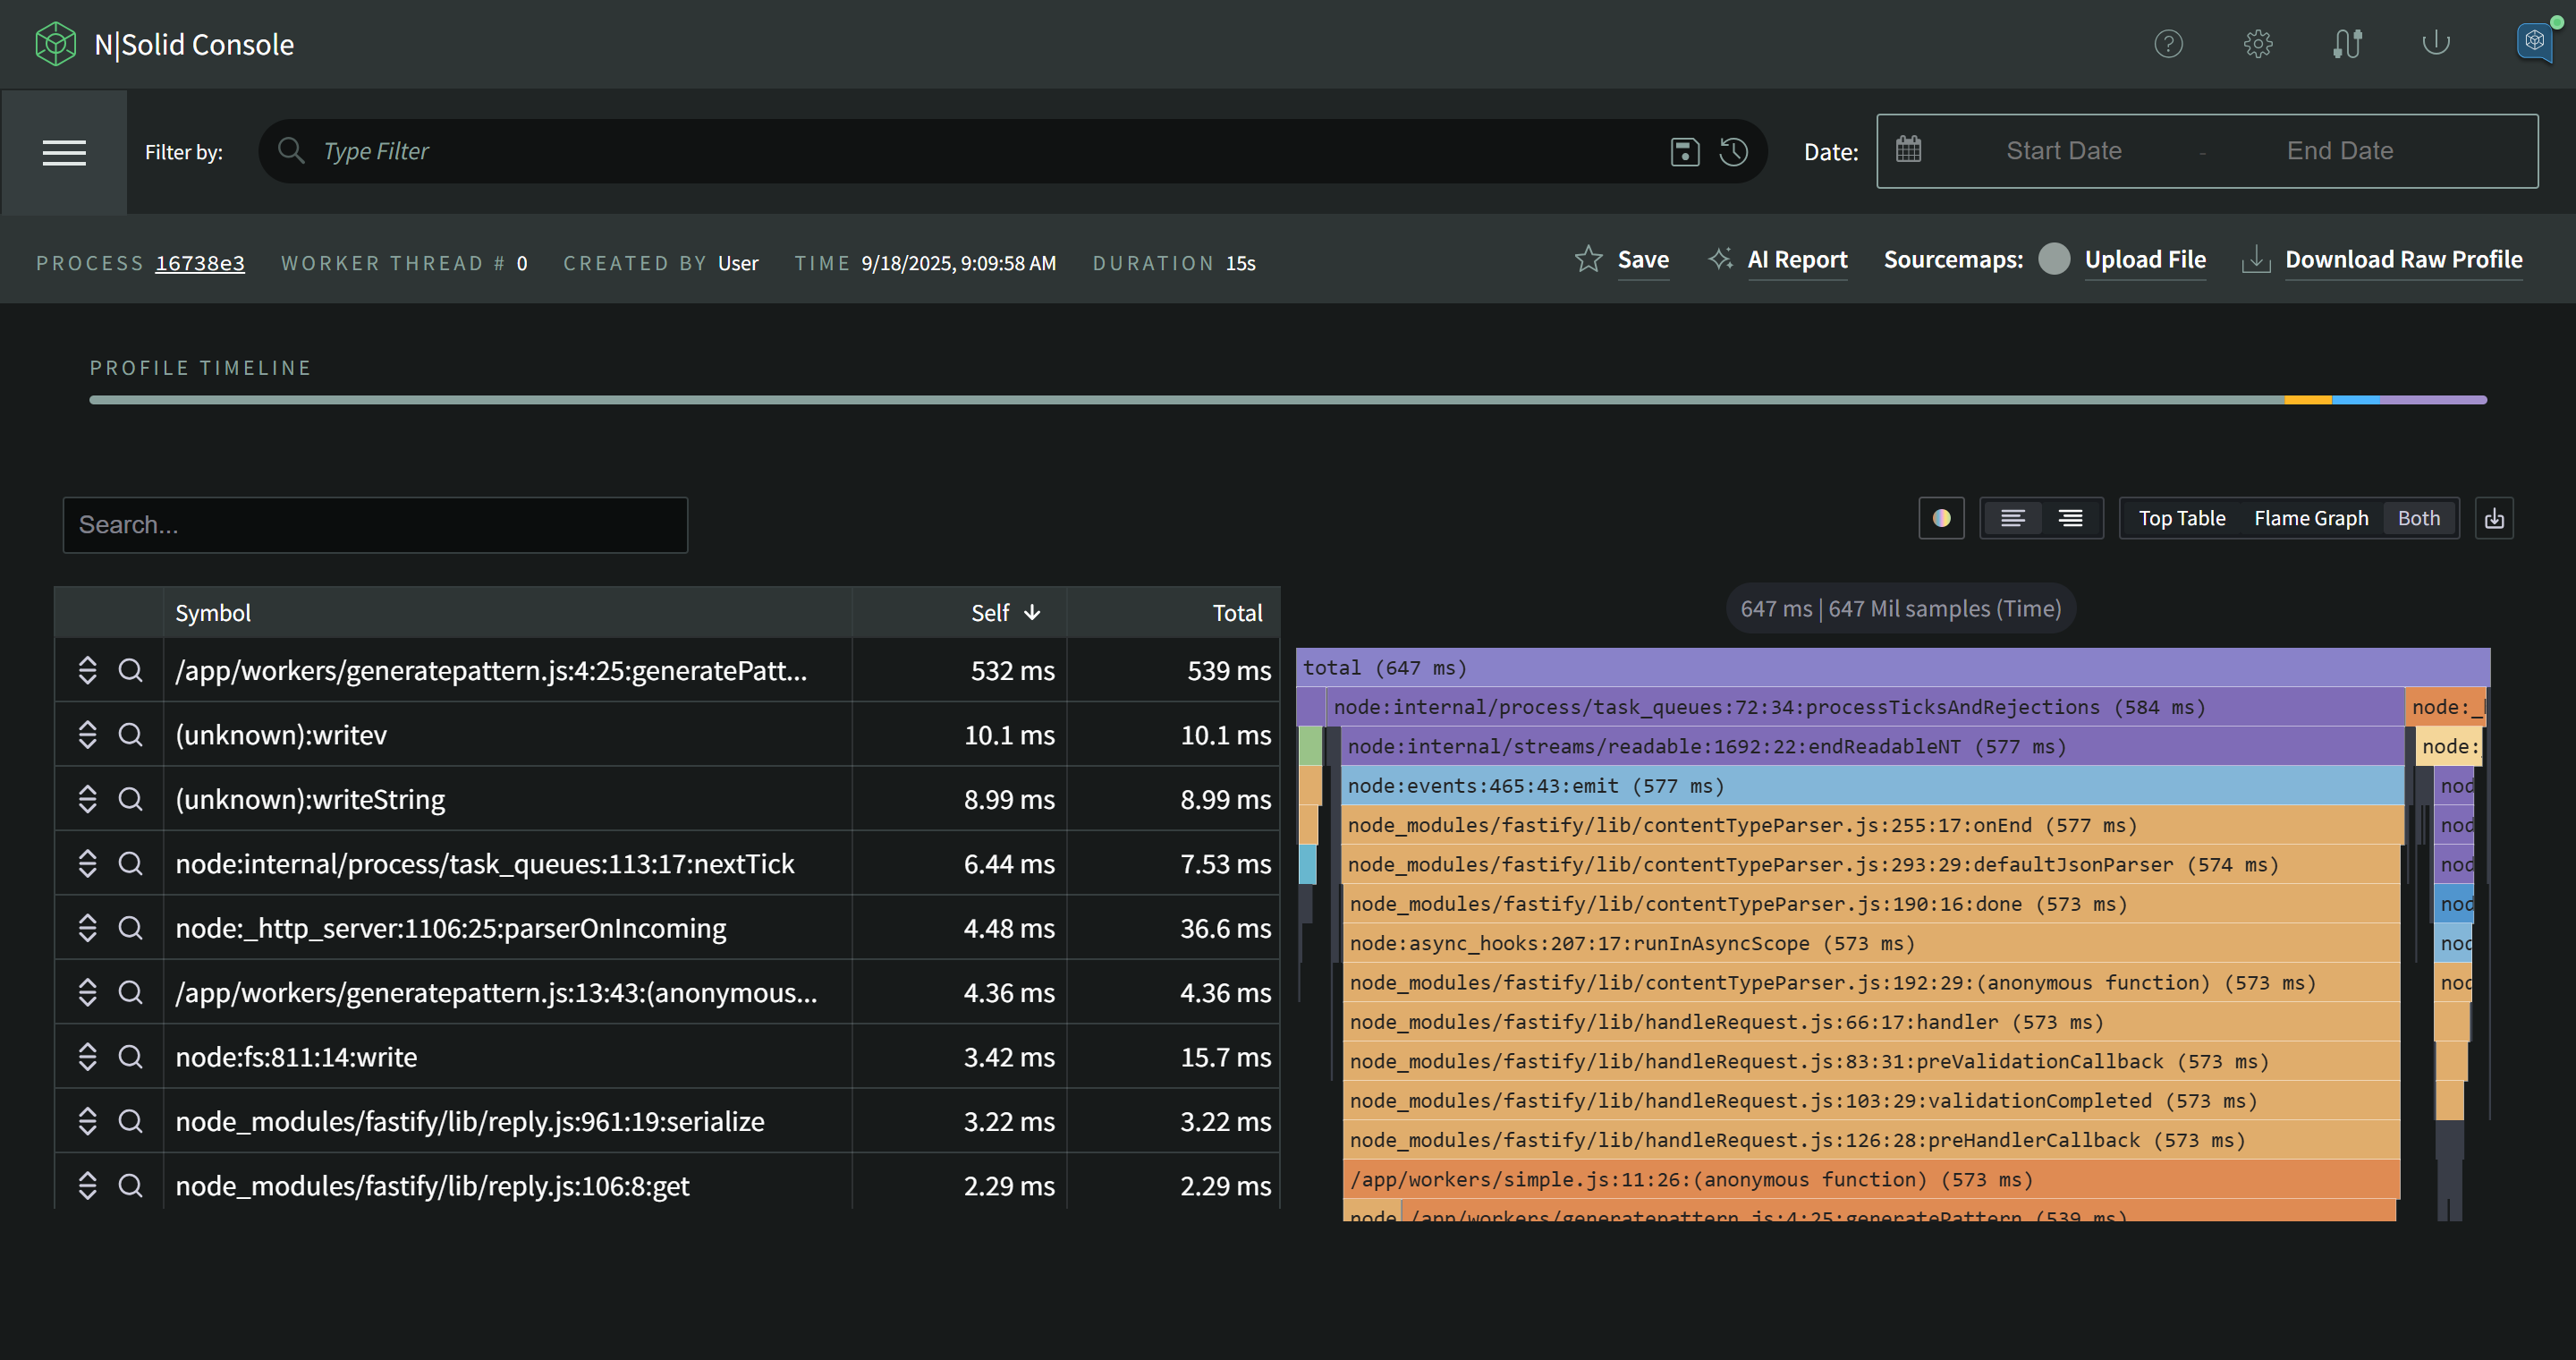
The Flame Graph visualization shows the time along the x-axis. The y-axis is used to show the function calls that make up a particular stack trace.
The Top Table visualization shows a clear table containing all function calls, their self time, and their total time.
You can use the visualizations to find long-running functions. These can be identified by:
- wide rectangles in the Flame Graph
- high self time in the Top Table
The stack trace height - how many functions deep a particular stack trace went - does not necessarily indicate a time issue. Focus on interpreting the time values as discussed above.
As you hover over the visualization itself, the function represented by the visualization will be shown. Clicking will show a stack trace to the right of the visualization.
When analyzing CPU profiles with the N|Solid Console visualizations, pay careful attention to stack trace entries that take up the most area. This is displayed as a factor of width in the Flame Graph and self time in the Top Table.
AI Reports
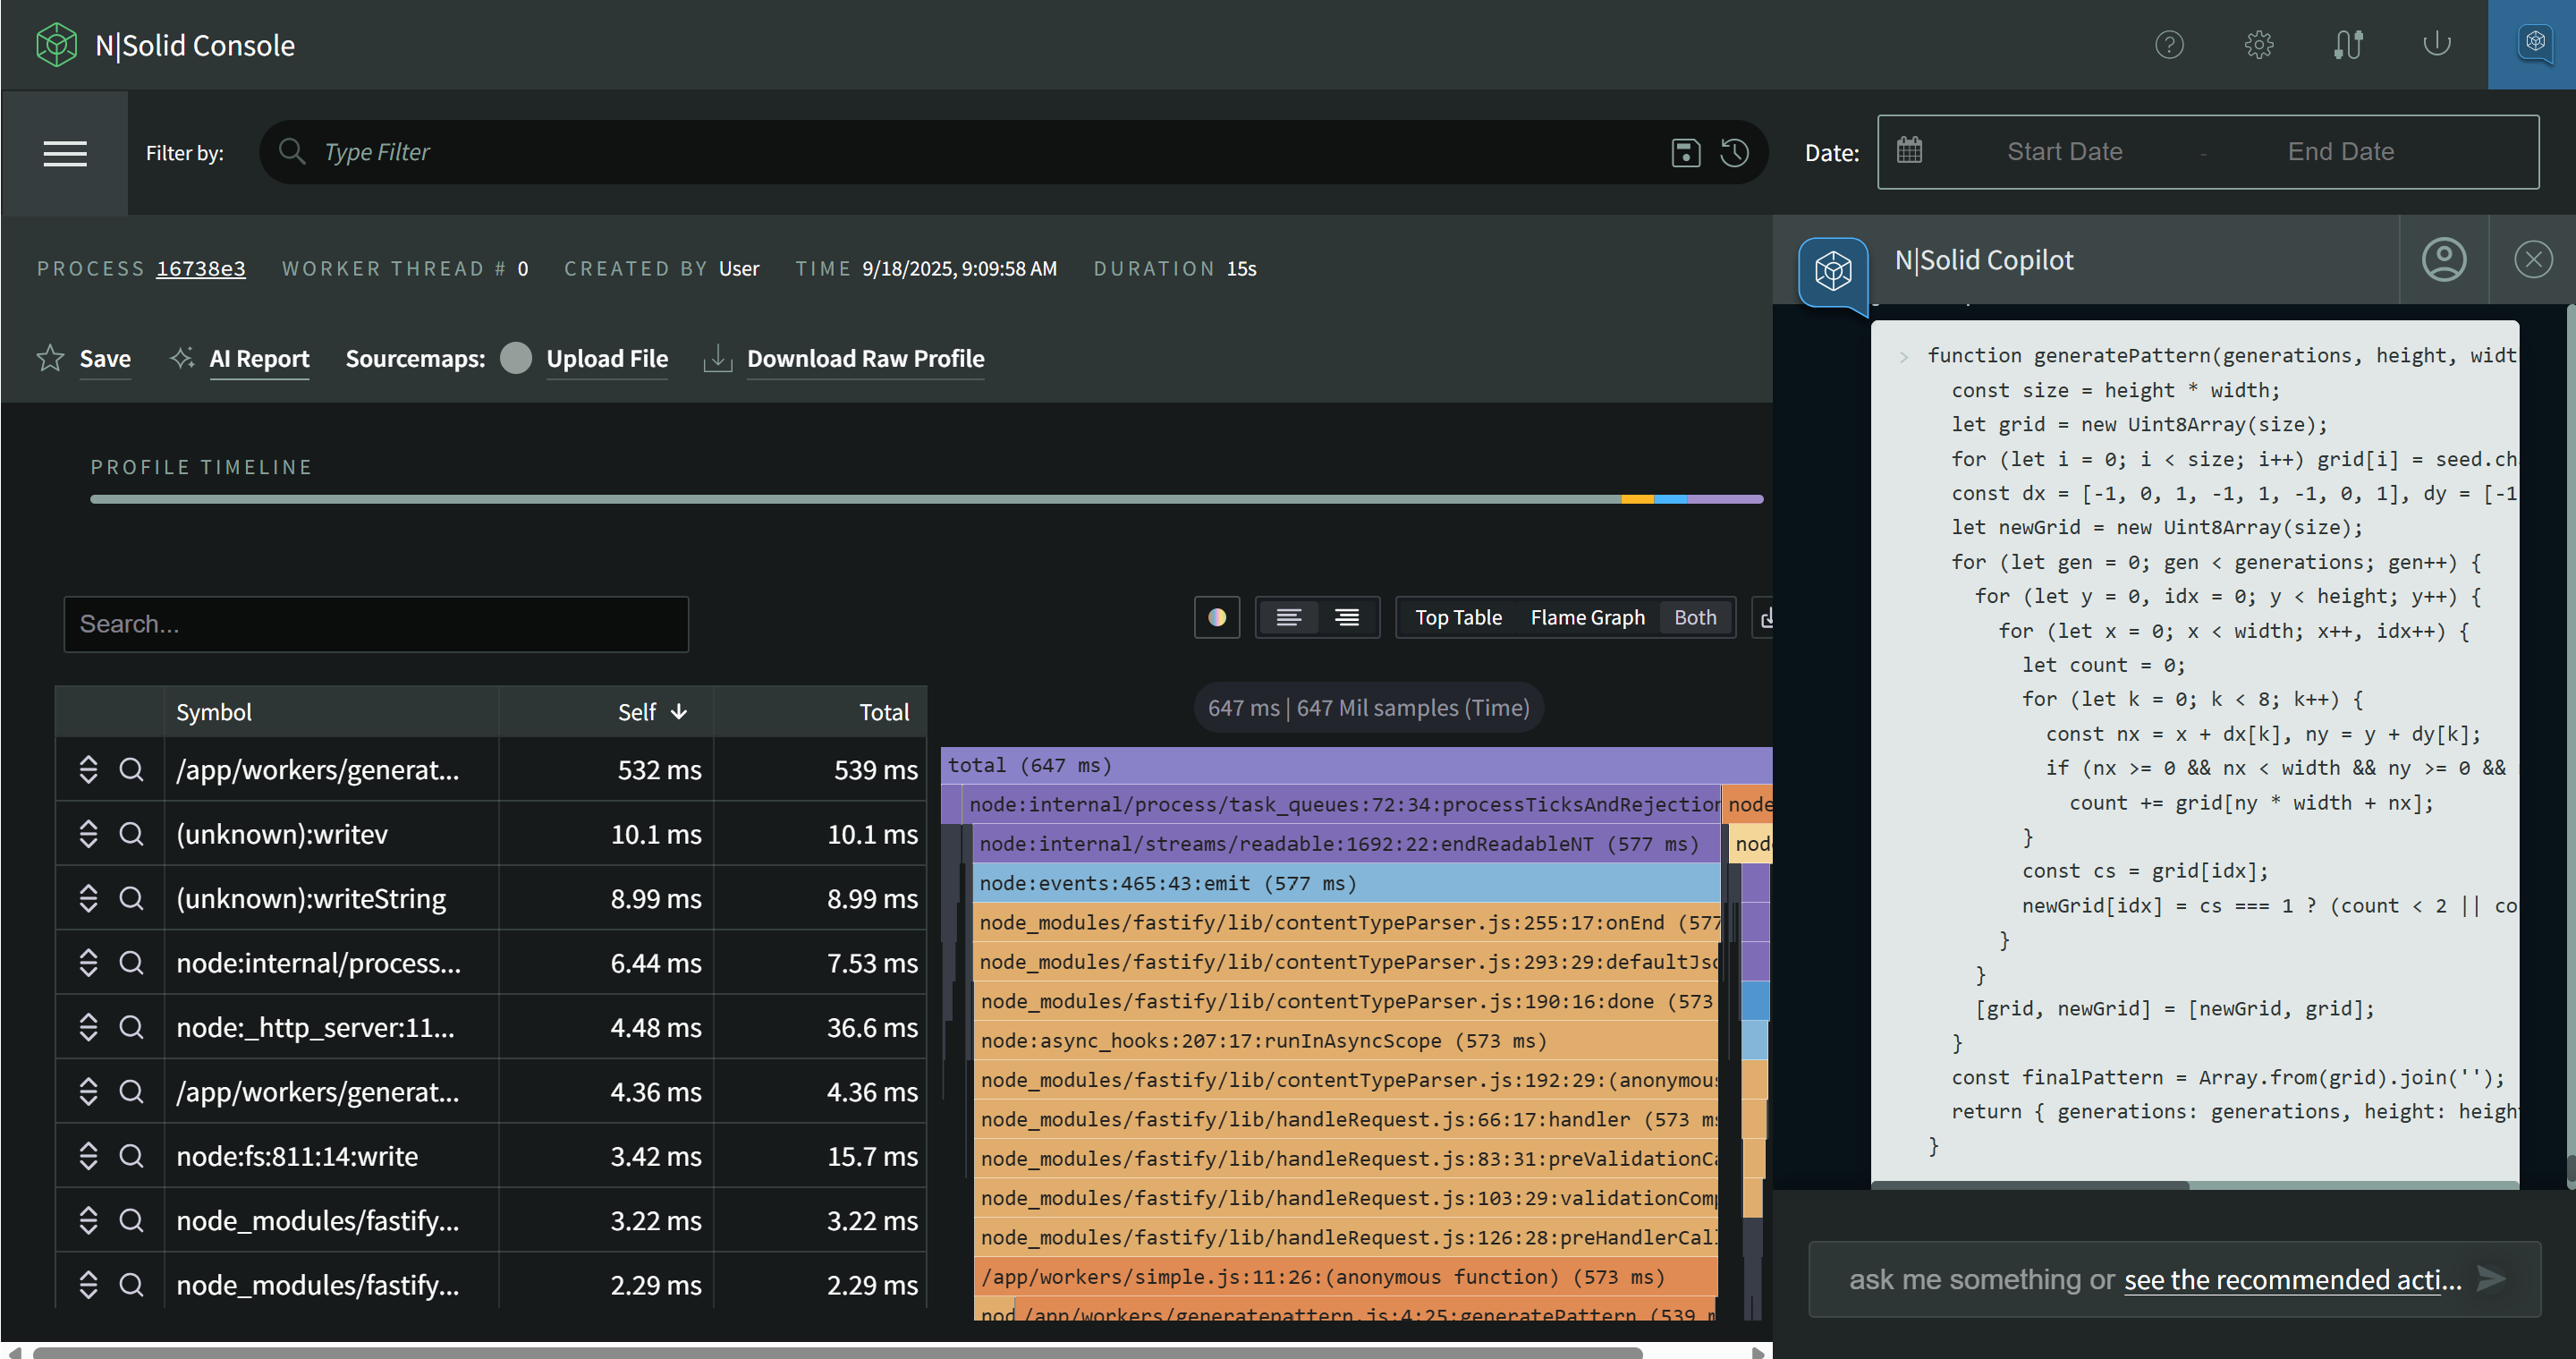
The N|Solid Copilot pairs with CPU Profiles to readily prepare in-depth analysis of any given CPU profile. AI reports can be executed directly from a CPU profile by clicking the "AI Report" button. The reports are able to surface process issues exemplified by high self-time, high call volume functions, and other less prominent characteristics. Upon recognizing a problem function, the agent will request access to the source file containing the function to attempt revising the function. All potential revised functions are first analyzed using NodeSource's benchmarking tool on the NodeSource backend, if it is able to generate a high-efficiency function, the AI will provide a new code snippet to replace the problem function.
With the N|Solid console's Github MCP Server integration, the N|Solid Copilot automatically generate pull requests after successfully identifying application level issues from a CPU profile. Check here to learn about MCP Server Integration with N|Solid.
Code Highlighting
Code highlighting shows the origin of each function. This makes it easier to determine the source of performance issues by selectively highlighting only one of the following categories of functions at a time:
- None: don't highlight anything.
- User Code: your application code. Selected by default.
- Core Code: any module compiled into the Node.js/N|Solid core, e.g.,
fs,http,net. - 3rd Party Code: any module installed into
node_modules/, including those authored by you and/or the organization you belong to.
Search
The search field allows you to search for nodes with matching function names and paths across the entire profile. It is case-sensitive, and only the first 500 matching results will be displayed.
Analyzing Profiles Using N|Solid and the Chrome Profiler
You can also view the generated CPU profile in Chrome DevTools:
- Click the Download Profile button on the left side of the screen
- Open the Chrome web browser
- Open Chrome DevTools from the overflow menu (the three dots in the right-hand side of the browser), hover
More toolsoption, and click onDeveloper tools(or pressctrl + shift + i,cmd + alt + ion macOS) - You will see the
Performancetab come up. Click theLoad profilebutton (up arrow logo) that appears in the left-hand pane under this tab. - Find the .cpuprofile file that was downloaded, and click the Open button
- A CPU profile chart will appear in the Performance tab
- Below it you will be able to see the Chart, Heavy (Bottom Up), and Tree (Top Down) views by selecting the respective entry in the dropdown menu located immediately above the CPU profile chart.
In addition to function execution times, the CPU profile chart also shows what functions were on the stack at the time the process was sampled.
Profiling Using the Command Line Interface (CLI)
N|Solid's Command Line Interface (CLI) is a great way to quickly pull profiles from remote processes for local examination. You can learn more about the profile command in the N|Solid Command Line Interface (CLI) reference using-the-cli.
CPU Profiling
CPU Profiling allows you to understand where opportunities exist to improve the speed and load capacity of your Node processes.
Analyzing the Function Call Stack
Generated CPU profiles can be used to indicate all of the functions on the function call stack. For instance, if a function foo() calls a function bar() during its execution, and a sample was taken while bar() was running, the function call stack will show that foo() called bar(). Because multiple samples may be taken while bar() is executing, there will be an approximate start and stop time recorded for bar(), which is an indication of how long it took to run. In addition, further samples before and after the ones that captured bar() will capture foo(), and likewise to the bottom of the function call stack.
This data can then be analyzed to show, for the function foo(), how much time was actually spent in foo() and not in bar(). Every function has two time values, a self time and a total time. For the foo() and bar() case, if foo() only calls the bar() function, then the self time for foo() plus the total time for bar() will equal the total time for foo():
function foo() {
        … processing that takes a lot of time but calls no other functions ...
    bar()
        … processing that takes a lot of time but calls no other functions …
}

function bar() {
    …
}
foo() total time = foo() self time + bar() total time
Note: Total time shows you which functions are fastest and slowest, from start to finish, but does not definitively tell you if the time was spent in that function or other functions.
Named Functions
Named functions are easier to spot in CPU profiles. The stack frame entries available in a CPU profile include the name of a function, and source code location information for detail views. For anonymous functions, the name will often be displayed as "(anonymous)". In some cases, the V8 JavaScript engine can calculate an "inferred name" for a function. When possible, name functions so that they can be easily spotted in a CPU profile.
For instance, a function busyFunction(), which you like to easily track the callers for, is being called from an anonymous function:
setInterval(function(){busyFunction()}, 1000)
In a CPU profile, you'll see that busyFunction() is being called by (anonymous).
To make this easier to spot in a CPU profile, you can simply use:
setInterval(function busyFunctionCaller(){busyFunction()}, 1000)
In the CPU profile, you'll now see that busyFunction() is called by busyFunctionCaller().
For additional code cleanliness and clearer profiling, consider moving the entire function out into the same scope as the function usage:
setInterval(busyFunctionCaller, 1000)
//...
function busyFunctionCaller() {
  busyFunction()
}
Because JavaScript functions are "hoisted" to the top level of the scope they're defined in, you can reference busyFunctionCaller before it is actually defined.
Source Map Support
Utilizing TypeScript and/or transpilers with N|Solid can make interpreting CPU profiles difficult unless the user is deeply familiar with the code. The integration of source maps provides a translation layer that references the compiled source code back to the original source code.
In an effort to address concrete customer pain points, NodeSource has introduced Source Map Support to the N|Solid CPU profiler. This feature continues to evolve with the specific requirements of our customers. NodeSource therefore envisages a phased rollout.
Currently, the feature can be accessed as follows:
- The N|Solid Console backend assumes that the source map is right next to the file, i.e.,
foo.js.map, which it subsequently reads and sends to the client. - When opening the Flame Graph view, ensure the Source Map checkbox is checked.
- This makes the client traverse the CPU profile and request a source map for all function locations from the Console backend.
- The client then uses the updated CPU profile to generate a Flame Graph.
- If the Source Map checkbox is unchecked, the original CPU profile is used again.
- The stored asset of the profile includes a Source Map setting and applies it when the asset is loaded again.
