OpenTelemetry Instrumentation
How to Inject OpenTelemetry Tracing Instrumentation into Your Applications
This is a guide for implementing custom OpenTelemetry trace and metric instrumentation into your team’s N|Solid projects.
N|Solid provides trace spans and metrics natively for HTTP and DNS requests, for many projects that may be all that is necessary. For those looking for more in-depth information on their applications, N|Solid provides a route for easy custom Otel instrumentation that can send data directly to the N|Solid console. Rather than performing traditional OpenTelemetry instrumentation with endpoints such as Grafana|Tempo, N|Solid users have the opportunity to keep all of their necessary diagnostic information in a single centralized suite.
Setup Requirements
- N|Solid runtime installed N|Solid Runtime Download
- N|Solid SaaS Connected
- Latest stable release of your desired OpenTelemetry instrumentation configured in package.json (e.g. @opentelemetry/instrumentation-ioredis, @opentelemetry/instrumentation-mongodb, etc.)
- Latest stable release of @opentelemetry/api configured in package.json
Implementation
For this example, we will set up mongodb instrumentation in a node application, repo available here
- Set instrumentation requirements for the desired module(s) before establishing other methods or requirements
// -- Otel Instrumentation  provides spans for worker management--
const nsolid = require('nsolid')
const { MongoDBInstrumentation } = require('@opentelemetry/instrumentation-mongodb')
const api = require('@opentelemetry/api') - Register the OpenTelemetry api with N|Solid
if (!nsolid.otel.register(api)){
    throw new Error('Failed to register NSOLID OpenTelemetry')
} - Register the desired instrumentation with the N|Solid native implementation of OpenTelemetry instrumentation
nsolid.otel.registerInstrumentations([
    new MongoDBInstrumentation()
]) - For custom implementation, users can implement custom hooks and options as specified by the original instrument’s documentation in the OpenTelemetry documentation
After performing this implementation and rebuilding your program, you can gain visibility into your MongoDB traces, etc. in the N|Solid console’s ‘traces’ menu. Some programs may require more detailed tooling with set hooks and added api context
Example
Using these instructions, the developers at NodeSource have put together a short demo application using a local mongoDB server to demonstrate the effectiveness of our integrated OpenTelemetry tooling. repo available here
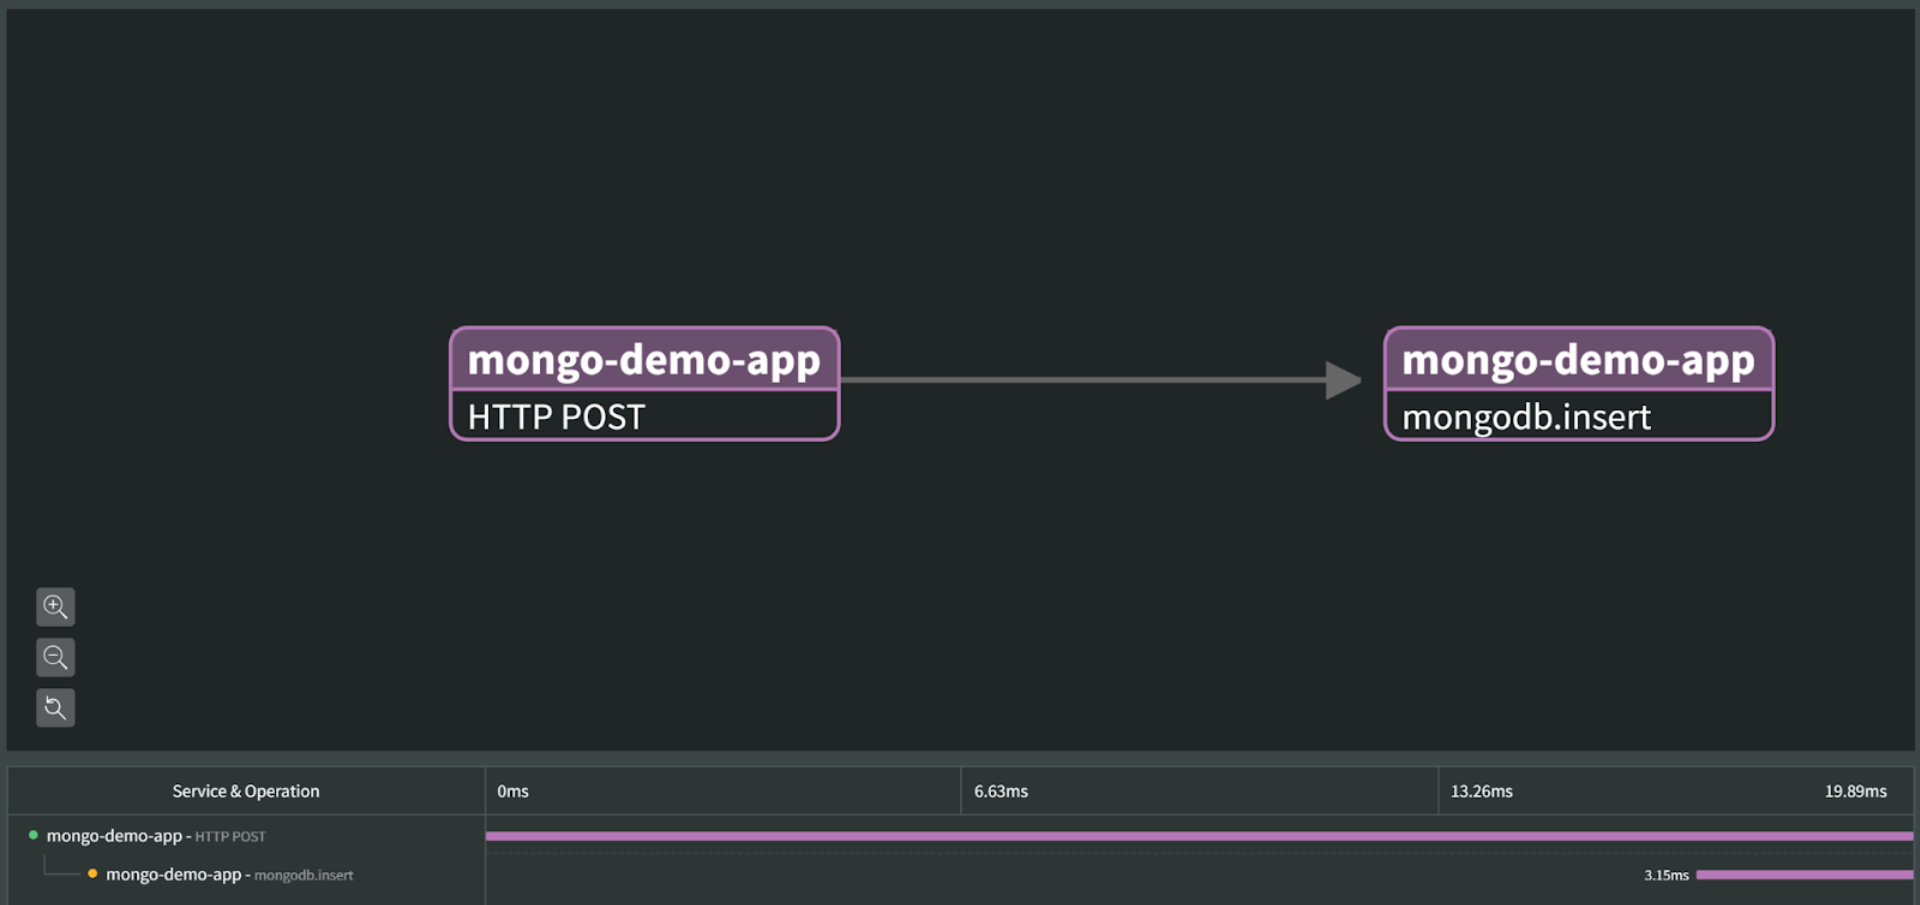
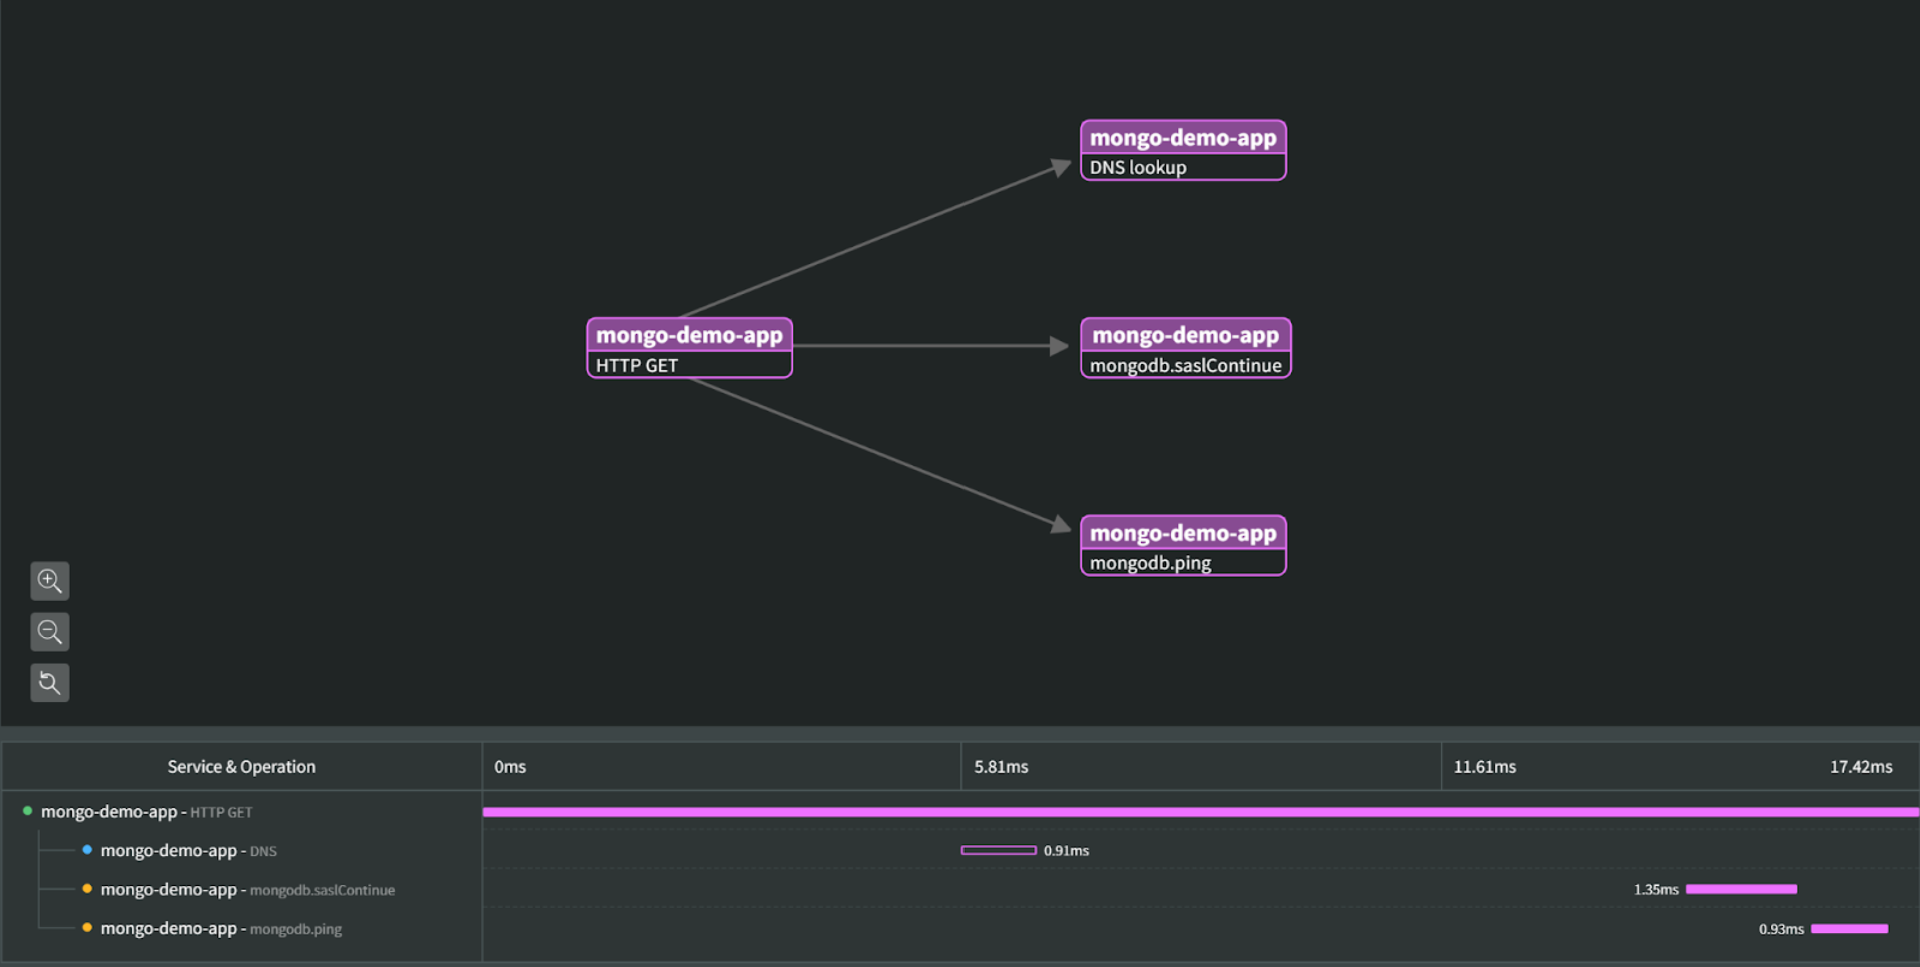
Using just a few lines of code added to server.js, we are able to view spans for http requests tracing to mongoDB.
Additional Tooling in Server.js
const nsolid = require('nsolid')
const { MongoDBInstrumentation } = require('@opentelemetry/instrumentation-mongodb')
const api = require('@opentelemetry/api')


// Register the OpenTelemetry api with nsolid
if (!nsolid.otel.register(api)) {
  throw new Error('Failed to register NSOLID OpenTelemetry')
}


// Register the desired instrumentation with the N|Solid native implementation
nsolid.otel.registerInstrumentations([
  new MongoDBInstrumentation()
])
HTTP GET:
HTTP POST: