Events
The N|Solid in the IDE Events view helps you monitor operational alerts from your N|Solid environment without leaving Visual Studio Code. Its main role is to surface important runtime events quickly, especially when a process becomes blocked or a process exits unexpectedly.
For many teams, this is the fastest way to notice that something is wrong with a running application and immediately move into investigation.
Primary Use Case
The most important use of the Events view is catching alerts for:
- Blocked processes -- Events such as
process-blockedcan indicate event loop stalls, long-running synchronous work, or other runtime conditions that prevent a process from responding normally. - Killed or exited processes -- Events such as
agent-exitcan indicate that a process terminated, restarted, disconnected, or was otherwise interrupted.
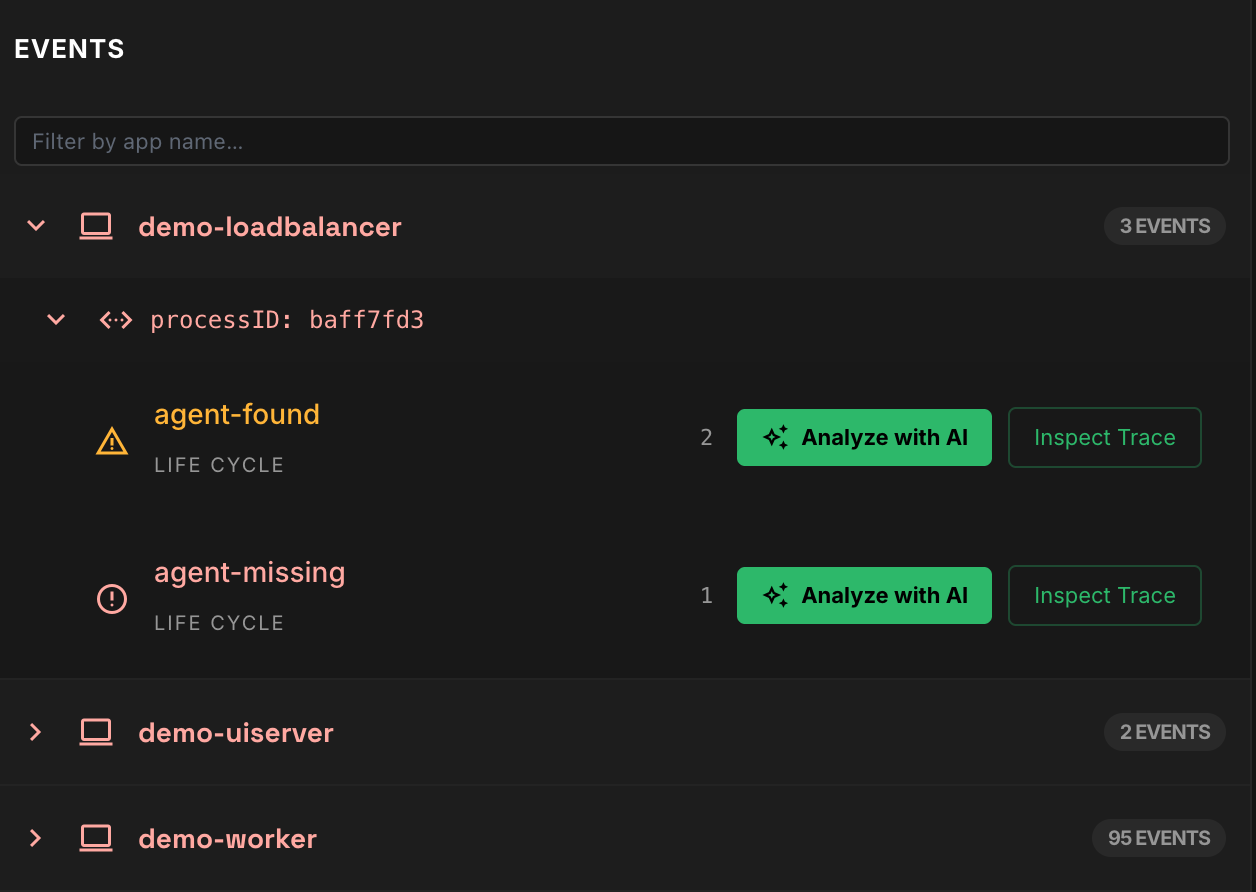
How Events Are Displayed
The Events view groups results in a way that helps you move from the broadest context to the specific failing process:
- Events are grouped by application first.
- Within each application, events are grouped by process.
- Within each process, repeated events are grouped by event name and count.
If your workspace is mapped to a specific app, the view prioritizes that app under a This Workspace section and places everything else under Other Apps.
Alerting Behavior
The Events view does more than list historical data. It also supports active alerting behavior for significant events.
N|Solid in the IDE watches for important alert events such as blocked processes and agent exits, evaluates them against local settings, and can raise a toast notification directly in the editor when a serious event is detected.
For blocked-process events, the extension uses a local threshold so that short stalls do not create unnecessary noise. For more general critical events, severity can still drive notification behavior even when no duration value is available.
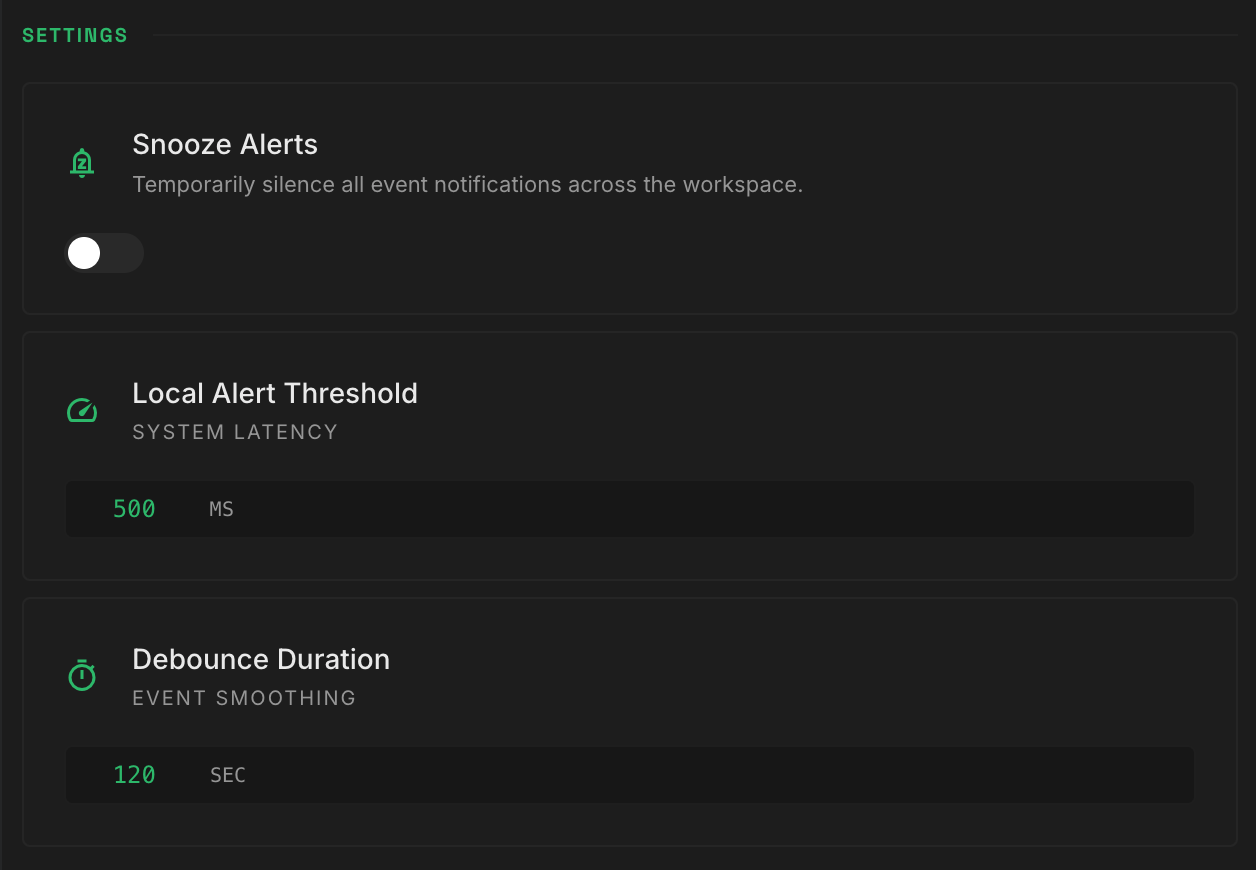
Event Settings
The Events view includes settings that let you control how noisy or aggressive alerting should be:
- Snooze Alerts -- Temporarily silence event notifications.
- Local Alert Threshold -- Set the local duration threshold used for latency-related alerts such as blocked processes.
- Debounce Duration -- Control how often alerts are rechecked so repeated events do not overwhelm you.
Investigating An Alert
When an important event is surfaced, the Events view supports two main follow-up actions:
- Analyze with AI -- Sends the event into the N|Solid chat workflow so an agent can inspect the event payload and help explain what likely happened.
- Inspect Trace -- Opens the trace or stack-oriented view for that event when stack information is available.
This is the key workflow for blocked or killed processes:
- A serious event appears in the Events view or as a notification.
- You identify the affected app and process.
- You open AI analysis or inspect the trace.
- You decide on the next diagnostic or remediation step based on the event evidence.
