Getting Started
N|Solid in the IDE brings N|Solid application monitoring directly into Visual Studio Code. It connects your editor to the runtime and Console data that help you understand how your Node.js applications are behaving while they run.
N|Solid in the IDE builds on the depth of insight made available by the N|Solid Runtime, NodeSource's open source fork of Node.js. The runtime works as a direct replacement for Node.js while adding low-impact diagnostic hooks, runtime monitors, and a native monitoring agent that can expose metrics from internals such as V8, libuv, CPU usage, memory, and event loop activity.
With that runtime data available, N|Solid in the IDE can surface connected applications, alerts, diagnostic assets, and AI-assisted investigation flows from inside your workspace. This gives development and operations teams a faster path from a performance signal to the context needed to investigate it.
Getting started with N|Solid in the IDE follows a simple flow:
- Install the extension in Visual Studio Code.
- Sign in with your browser.
- Confirm that your N|Solid connection is configured.
- Try the extension features most relevant to your workflow.
Install N|Solid in the IDE
Install N|Solid into Visual Studio Code, then open the N|Solid view from the Activity Bar. The extension provides onboarding and feature access directly in the editor so you can move from installation to sign-in and first use without additional setup steps as seamlessly as possible.
Users can install the extension from the Visual Studio Code marketplace by searching for "N|Solid" or by visiting the extension page in the marketplace.
Sign In
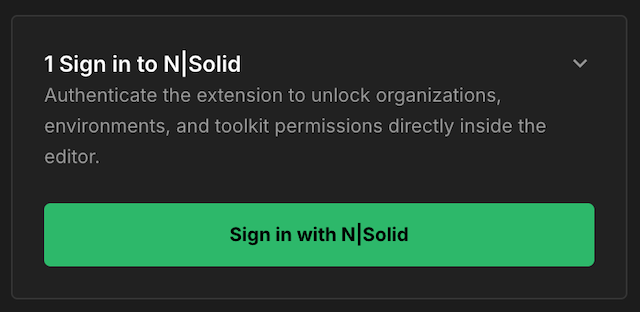
N|Solid in the IDE supports a browser-based sign-in flow and this should be the primary way most developers connect the extension to their account.
Use the extension's sign-in action to open your browser and authenticate with NodeSource. After authentication completes, N|Solid in the IDE returns to Visual Studio Code and stores the connection details needed to work with your N|Solid environment.
If your organization requires manual configuration, N|Solid in the IDE also supports settings-based setup such as consoleUrl and serviceToken. Treat that path as a fallback for troubleshooting or environments where the standard sign-in flow is not available.
Confirm Your Connection
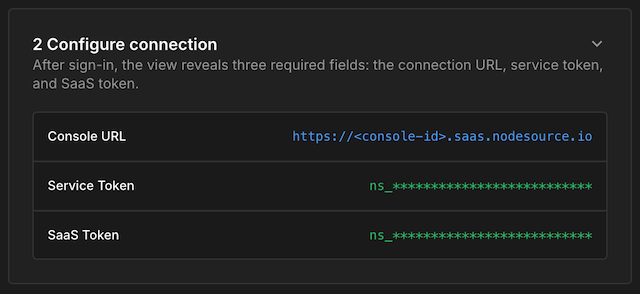
After sign-in, verify that N|Solid in the IDE is connected to the correct N|Solid Console environment. A successful setup should give the extension access to the credentials and connection details it needs for dashboard data, events, assets, package insights, and benchmarking-related workflows.
If the extension appears signed in but features are unavailable, check your connection-related settings and confirm that the configured console endpoint and credentials match your environment.
Install the AI Toolkit
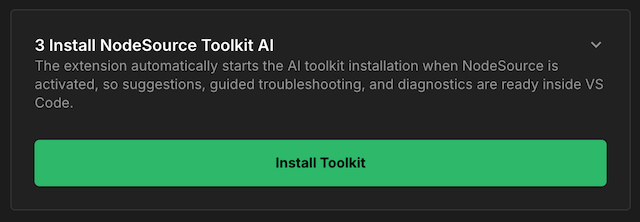
The Install NodeSource Toolkit AI step prepares the current workspace for the AI-assisted workflows in N|Solid in the IDE. Open the project folder you want to work with before installing the toolkit, because the generated configuration and skills are written into that workspace.
After you sign in and N|Solid in the IDE has the required connection details, select Install Toolkit from the Welcome view. During installation, N|Solid in the IDE creates or updates the workspace MCP configuration in .vscode/mcp.json so AI workflows can use NodeSource-backed tools for N|Solid Console, NCM, and benchmarking. It also installs or updates the NodeSource AI skills in .agents/skills.
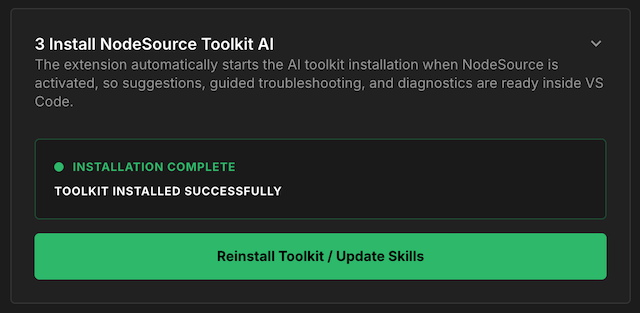
When the toolkit is installed, the Welcome view shows Installation Complete and the button changes to Reinstall Toolkit / Update Skills. Use that action again when you need to refresh the MCP configuration or update the installed skills for the workspace.
The toolkit installation requires an open workspace and configured N|Solid credentials. If the button is disabled, confirm that you are signed in and that the connection fields show a Console URL, service token, and SaaS token.
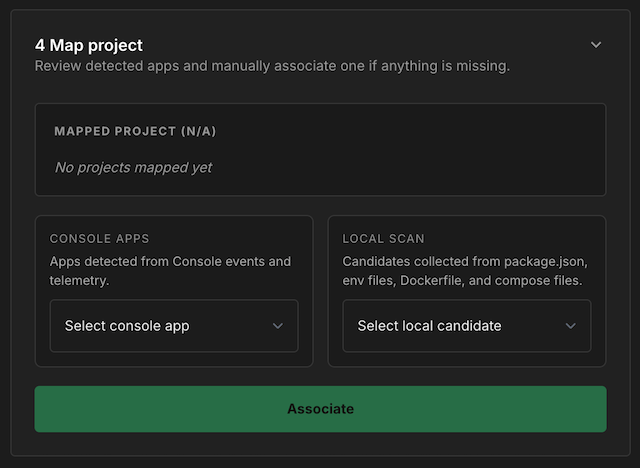
Map an Application
The Map project step tells N|Solid in the IDE which N|Solid Console application belongs to the workspace you currently have open. Mapping does not start the application by itself; it gives the extension a preferred app name to use when showing telemetry, events, assets, reports, and AI context for this workspace.
N|Solid in the IDE offers two sources for mapping candidates:
- Console Apps -- applications found from recent N|Solid Console events and telemetry.
- Local Scan -- application names detected from workspace files such as
package.json,.envfiles,Dockerfile, and Docker Compose files.
Choose the app that matches the runtime application name your process reports to N|Solid Console, then select Associate. N|Solid in the IDE saves that value as the workspace's mapped application and shows it in the Mapped Project panel. If you need to change it later, remove the existing mapping and associate a different Console app or local candidate.
After an app is mapped, the final quickstart step watches for telemetry from that app. If the app is already running with N|Solid, it can appear as connected automatically. If it is not connected yet, use Ask AI How to Connect or Launch Locally with N|Solid from the Application Quickstart section.
Application Quickstart
N|Solid in the IDE includes quickstart actions that help connect a workspace Node.js application to N|Solid Console. After you sign in and the extension has the required N|Solid connection details, use these actions from the Welcome view's Connect app to N|Solid Console step or from the Telemetry empty state.
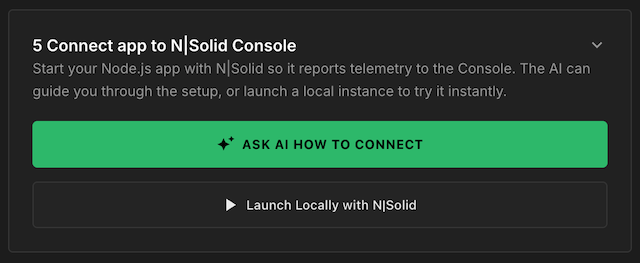
Ask AI
Select Ask AI How to Connect when you want guided setup for the project or deployment files in your workspace. N|Solid in the IDE opens a new N|Solid chat session with a setup prompt that asks the AI agent to inspect common Node.js configuration files, including .env files, package.json, Dockerfile, docker-compose.yml, and Kubernetes or Helm manifests.
The generated prompt uses safe placeholders for your N|Solid credentials and asks the AI agent to provide copy-pasteable changes for supported connection methods, such as:
- Setting
NSOLID_SAAS,NSOLID_APPNAME, andNSOLID_TRACING_ENABLEDin environment configuration. - Updating
package.jsonso the application starts withnsolid. - Using a NodeSource N|Solid Docker image for containerized deployments.
- Starting N|Solid programmatically from the application entry point.
Use this option when you want the AI agent to explain the required changes before you apply them, adapt the setup to containers or orchestration, or prepare deployment configuration for a non-local environment.
Launch Locally
Select Launch Locally with N|Solid when you want to run the current workspace application with the N|Solid runtime immediately. N|Solid in the IDE reads the workspace package.json, lists the available npm scripts, and prioritizes common script names such as dev, start, serve, develop, and debug.
After you choose a script, N|Solid in the IDE opens a terminal named N|Solid Quickstart in the workspace and runs:
npx nsolid-quickstart --saas "<token>" --npm "<script>"
The command uses the N|Solid SaaS token stored by the extension and launches the selected npm script through N|Solid so the process can report telemetry to N|Solid Console. In the Welcome view, N|Solid in the IDE refreshes telemetry and checks for the workspace app after the quickstart starts. Once telemetry is detected, the app appears in the Telemetry section.
N|Solid Quickstart requires an open workspace with a readable package.json, at least one npm script, and a configured N|Solid SaaS token. Use Ask AI How to Connect for tailored setup instructions and use Launch Locally with N|Solid for fast local validation.
Learn More
N|Solid in the IDE includes several focused documentation pages for specific feature areas:
- Telemetry -- Capture real time application metrics, and set notifications for critical application thresholds.
- Node Certified Modules -- Review package intelligence and vulnerability insights.
- Reports -- Understand generated reports and result summaries.
- Events -- Explore event history and operational signals.
- Assets Directory -- Browse and work with saved diagnostic assets (CPU Profiles, Heap Samples, and Heap Profiles).
- Agent Skills -- Learn how skill-based workflows support the extension experience.
- Function Benchmarks -- Benchmark applications using NodeSource's benchmarking MCP.
