Telemetry
The N|Solid in the IDE Telemetry section shows live application information pulled from N|Solid Console. It gives you a quick view of which applications are currently reporting, how they are behaving, and whether any app-level metrics have crossed important thresholds.
What Telemetry Shows
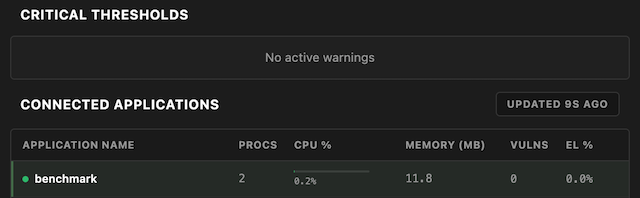
The telemetry view pulls application data from N|Solid Console and presents it as a connected-applications table. For each application, N|Solid in the IDE can show information such as:
- Application Name
- Connected Process Count
- CPU Usage
- Memory Usage (in MB)
- Vulnerability Count (Vulns)
- Event Loop Utilization (EL)
If your workspace is mapped to a specific app, that application is prioritized in the telemetry view so you can focus on the runtime information most relevant to the project you have open.
Alerts and Follow-Up Actions
The telemetry section can also surface alert cards when critical thresholds are crossed. These alerts are designed to highlight situations such as:
- CPU spikes
- Heap or memory spikes
- Event loop utilization spikes
When an alert appears, N|Solid in the IDE can offer an Ask AI action so you can move directly from the telemetry signal into investigation. This makes the telemetry view a starting point for deeper workflows rather than just a passive dashboard.
Connected Applications
The main table in the telemetry section is centered on connected applications. If no applications are currently reporting metrics to N|Solid Console, the section shows an empty state instead of metric rows.
That usually means one of two things:
- Your N|Solid credentials or connection are not configured correctly
- Your Node.js applications are not currently reporting telemetry to the selected Console environment
