Taking and Analyzing Heap Snapshots
Heap Snapshots
Taking Heap Snapshots Using the N|Solid Console
The N|Solid Console allows you to capture heap data from a running process directly in the UI. This is useful for investigating memory growth, retaining paths, and unexpected object allocations without needing to attach an inspector locally.
Heap snapshots are point-in-time captures of V8 heap state. They can be large and may briefly pause the process while the snapshot is generated and transferred.
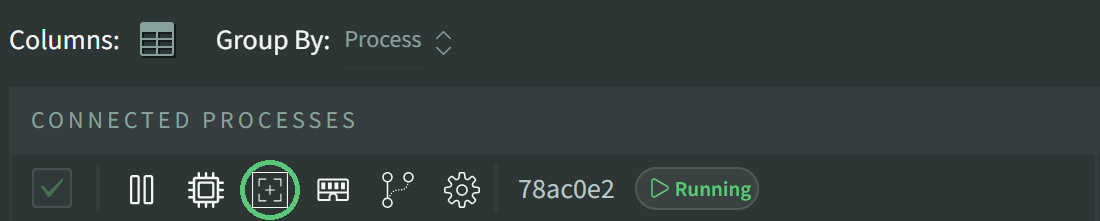
- Identify the process of interest on the main dashboard.
- Either from the single process view or from the process list, click the New Heap Snapshot action.
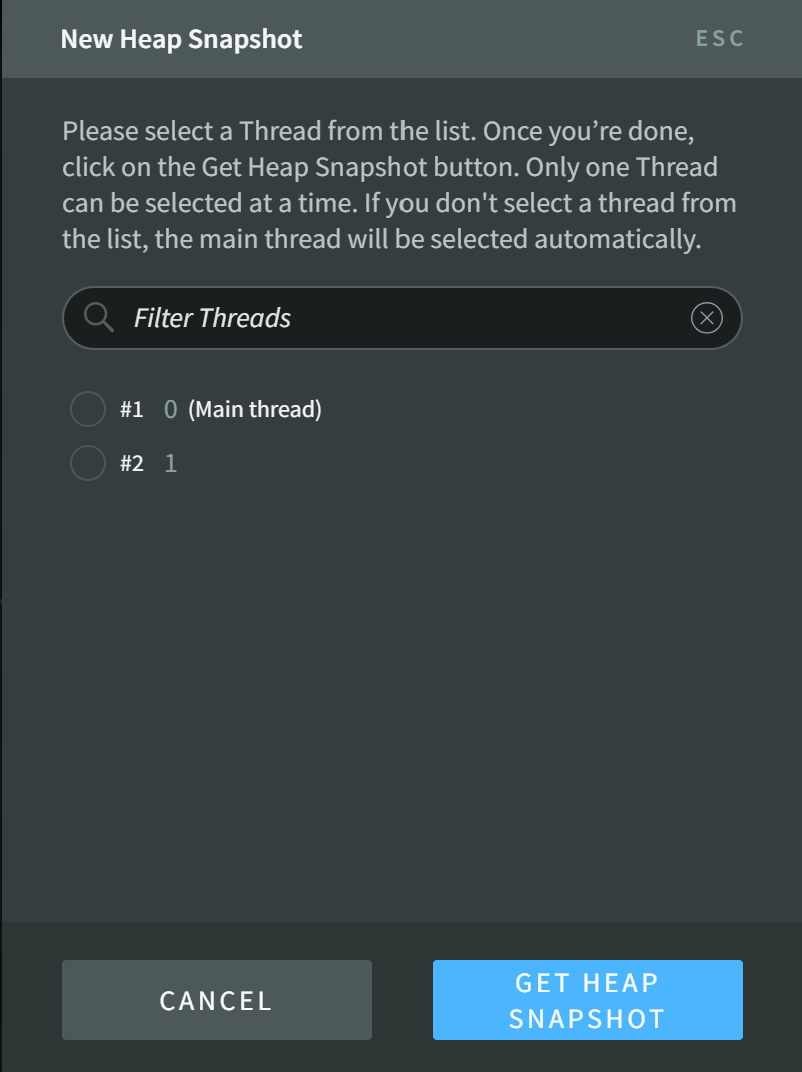
- Select your desired thread and click GET HEAP SNAPSHOT to start the capture.

- When the capture finishes, open the Assets tab from the completion notification or from the Assets tab on the process detail page. Download the new asset.

If your application ends before the snapshot is complete, N|Solid will attempt to save whatever data was generated. If successful, the snapshot will still be available under the Assets tab.
Taking Heap Samples Using the N|Solid Console
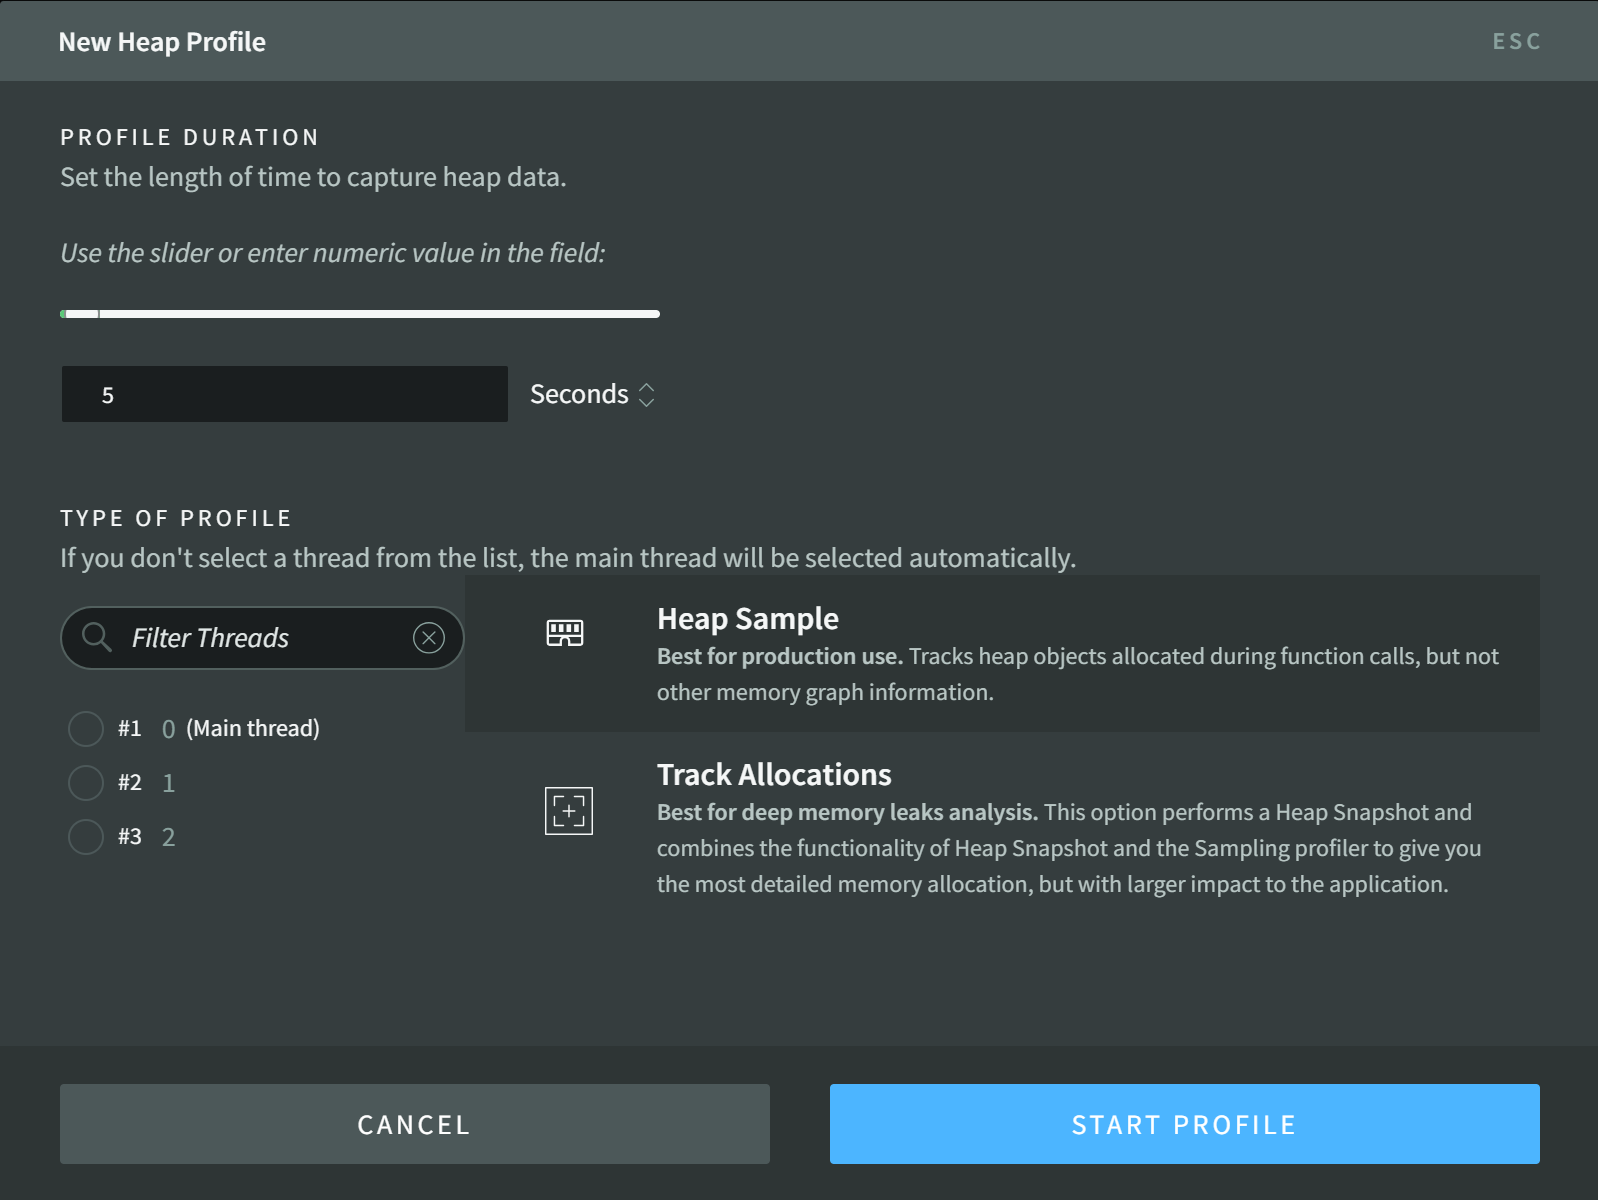
In addition to full heap snapshots, the N|Solid Console can generate heap sampling data. A generic Heap Sample is the best tool provided for memory profiling processes in production.
The Track Allocations option works best for analyzing deep memory leaks. Allocation tracking combines the functionality of both heap snapshots and heap samples to give the most detailed view of your process' memory allocation, with a large impact on the application's performance.
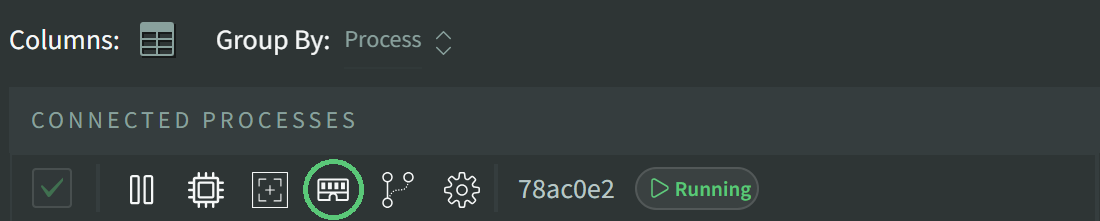
- Identify the process of interest on the main dashboard.
- Either from the single process view or from the process list, click the New Profiler action.
- Select your desired profiling time window, thread, and profiling method (Heap Sample or Allocation Tracking).
- Click START PROFILE to start the capture.
- When the capture finishes, open the Assets tab from the completion notification or from the Assets tab on the process detail page. Download the new asset.


Analyzing Heap Data Using Chrome DevTools
You can download heap snapshot and sampling assets from the N|Solid Console and analyze them locally using Chrome DevTools.
Analyze a Heap Snapshot
- From the heap snapshot view in the N|Solid Console, click Download.
- Open the Chrome web browser.
- Open Chrome DevTools from the overflow menu (the three dots in the right-hand side of the browser), hover
More tools, and clickDeveloper tools(or pressctrl + shift + i,cmd + alt + ion macOS). - Open the
Memorytab. - In the
Memorytab, selectHeap snapshot, then click the load/import control in the left pane. - Select the downloaded heap snapshot file (typically a
.heapsnapshot) and open it.
Once loaded, you can use the standard DevTools heap snapshot views (for example, Summary, Containment, Comparison, and Statistics) to inspect memory usage and retained objects.
Analyze a Heap Sample (Heap Profile)
- From the heap sample view in the N|Solid Console, click Download.
- Open Chrome DevTools.
- Open the
Memorytab. - Select
Allocation sampling, then use the load/import control to load the downloaded heap sampling profile.
The sampling views focus on allocations over the capture window and help identify hot allocation call stacks.
What to Look For
Analyzing heap snapshots and profiles can be complex. Chrome for Developers has helpful documentation on using Chrome DevTools when analyzing heap snapshots and heap profiles a.k.a. allocation profiles.
Heap Analysis Using the Command Line Interface (CLI) and the N|Solid API
If you prefer working locally, you can also pull heap assets from remote processes using the N|Solid Command Line Interface (CLI) and then load them into Chrome DevTools as described above. Instructions for handling assets with the CLI can be found in the appendix of these docs
You can also trigger heap snapshots and samples using the N|Solid API.
